Trend Titan Neutronstar [QuantraSystems]Trend Titan NEUTRONSTAR
Credits
The Trend Titan NEUTRONSTAR is a comprehensive aggregation of nearly 100 unique indicators and custom combinations, primarily developed from unique and public domain code.
We'd like to thank our TradingView community members: @IkKeOmar for allowing us to add his well-built "Normalized KAMA Oscillator" and "Adaptive Trend Lines " indicators to the aggregation, as well as @DojiEmoji for his valuable "Drift Study (Inspired by Monte Carlo Simulations with BM)".
Introduction
The Trend Titan NEUTRONSTAR is a robust trend following algorithm meticulously crafted to meet the demands of crypto investors. Designed with a multi layered aggregation approach, NEUTRONSTAR excels in navigating the unique volatility and rapid shifts of the cryptocurrency market. By stacking and refining a variety of carefully selected indicators, it combines their individual strengths while reducing the impact of noise or false signals. This "aggregation of aggregators" approach enables NEUTRONSTAR to produce a consistently reliable trend signal across assets and timeframes, making it an exceptional tool for investors focused on medium to long term market positioning.
NEUTRONSTAR ’s powerful trend following capabilities provide investors with straightforward, data driven analysis. It signals when tokens exhibit sustained upward momentum and systematically removes allocations from assets showing signs of weakness. This structure aids investors in recognizing peak market phases. In fact, one of NEUTRONSTAR ’s most valuable applications is its potential to help investors time exits near the peak of bull markets. This aims to maximize gains while mitigating exposure to downturns.
Ultimately, NEUTRONSTAR equips investors with a high precision, adaptable framework for strategic decision making. It offers robust support to identify strong trends, manage risk, and navigate the dynamic crypto market landscape.
With over a year of rigorous forward testing and live trading, NEUTRONSTAR demonstrates remarkable robustness and effectiveness, maintaining its performance without succumbing to overfitting. The system has been purposefully designed to avoid unnecessary optimization to past data, ensuring it can adapt as market conditions evolve. By focusing on aggregating valuable trend signals rather than tuning to historical performance, the NEUTRONSTAR serves as a reliable universal trend following system that aligns with the natural market cycles of growth and correction.
Core Methodology
The foundation of the NEUTRONSTAR lies in its multi aggregated structure, where five custom developed trend models are combined to capture the dominant market direction. Each of these aggregates has been carefully crafted with a specific trend signaling period in mind, allowing it to adapt seamlessly across various timeframes and asset classes. Here’s a breakdown of the key components:
FLARE - The original Quantra Signaling Matrix (QSM) model, best suited for timeframes above 12 hours. It forms the foundation of long term trend detection, providing stable signals.
FLAREV2 - A refined and more sophisticated model that performs well across both high and low timeframes, adding a layer of adaptability to the system.
NEBULA - An advanced model combining FLARE and FLAREV2. NEBULA brings the advantages of both components together, enhancing reliability and capturing smoother, more accurate trends.
SPARK - A high speed trend aggregator based on the QSM Universal model. It focuses on fast moving trends, providing early signals of potential shifts.
SUNBURST - A balanced aggregate that combines elements of SPARK and FLARE, confirming SPARK’s signals while minimizing false positives.
Each of these models contributes its own unique perspective on market movement. By layering fast, medium, and slower trend following signals, NEUTRONSTAR can confirm strong trends while filtering out shorter term noise. The result is a comprehensive tool that signals clear market direction with minimized false signals.
A Unique Approach to Trend Aggregation
One of the defining characteristics of NEUTRONSTAR is its deliberate choice to avoid perfectly time coherent indicators within its aggregation. In simpler terms, NEUTRONSTAR purposefully incorporates trend following indicators with slightly different signal periods, rather than synchronizing all components to a single signaling period. This choice brings significant benefits in terms of diversification, adaptability, and robustness of the overall trend signal.
When aggregating multiple trend following components, if all indicators were perfectly time coherent - meaning they responded to market changes in exactly the same way and over the time periods - the resulting signal would effectively be no different from a single trend following indicator. This uniformity would limit the system’s ability to capture a variety of market conditions, leaving it vulnerable to the same noise or false signals that any single indicator might encounter. Instead, NEUTRONSTAR leverages a balanced mix of indicators with varied timing: some fast, some slower, and some in the medium range. This choice allows the system to extract the unique strengths of each component, creating a combined signal that is stronger and more reliable than any single indicator.
By incorporating different signal periods, NEUTRONSTAR achieves what can be thought of as a form of edge accumulation. The fast components within NEUTRONSTAR , for example, are highly sensitive to quick shifts in market direction. These indicators excel at identifying early trend signals, enabling NEUTRONSTAR to react swiftly to emerging momentum. However, these fast indicators alone would be prone to reacting to market noise, potentially generating too many premature signals. This is where the medium term indicators come into play. These components operate with a slower reaction time, filtering out the short term fluctuations and confirming the direction of the trend established by the faster indicators. The combination of these varying signal speeds results in a balanced, adaptive response to market changes.
This approach also allows NEUTRONSTAR to adapt to different market regimes seamlessly. In fast moving, volatile markets, the faster indicators provide an early alert to potential trend shifts, while the slower components offer a stabilizing influence, preventing overreaction to temporary noise. Conversely, in steadier or trending markets, the medium and slower indicators sustain the trend signal, reducing the likelihood of premature exits. This flexible design enhances NEUTRONSTAR ’s ability to operate effectively across multiple asset classes and timeframes, from short term fluctuations to longer term market cycles.
The result is a powerful, multi-layered trend following tool that remains adaptive, capturing the benefits of both fast and medium paced reactions without becoming overly sensitive to short term noise. This unique aggregation methodology also supports NEUTRONSTAR ’s robustness, reducing the risk of overfitting to historical data and ensuring that the system can perform reliably in forward testing and live trading environments. The slightly staggered signal periods provide a greater degree of resilience, making NEUTRONSTAR a dependable choice for traders looking to capitalize on sustained trends while minimizing exposure during periods of market uncertainty.
In summary, the lack of perfect time coherence among NEUTRONSTAR ’s sub components is not a flaw - but a deliberate, robust design choice.
Risk Management through Market Mode Analysis
An essential part of NEUTRONSTAR is its ability to assess the market's underlying behavior and adapt accordingly. It employs a Market Mode Analysis mechanism that identifies when the market is either in a “Trending State” or a “Mean Reverting State.” When enough confidence is established that the market is trending, the system confirms and signals a “Trending State,” which is optimal for maintaining positions in the direction of the trend. Conversely, if there’s insufficient confidence, it labels the market as “Mean Reverting,” alerting traders to potentially avoid trend trades during likely sideways movement.
This distinction is particularly valuable in crypto, where asset prices often oscillate between aggressive trends and consolidation periods. The Market Mode Analysis keeps traders aligned with the broader market conditions, minimizing exposure during periods of potential whipsaws and maximizing gains during sustained trends.
Zero Overfitting: Design and Testing for Real World Resilience
Unlike many trend following indicators that rely heavily on backtesting and optimization, NEUTRONSTAR was built to perform well in forward testing and live trading without post design adjustments. Over a year of live market exposure has all but proven its robustness, with the system’s methodology focused on universal applicability and simplicity rather than curve fitting to past data. This approach ensures the aggregator remains effective across different market cycles and maintains relevance as new data unfolds.
By avoiding overfitting, NEUTRONSTAR is inherently more resistant to the common issue of strategy degradation over time, making it a valuable tool for traders seeking reliable market analysis you can trust for the long term.
Settings and Customization Options
To accommodate a range of trading styles and market conditions, NEUTRONSTAR includes adjustable settings that allow for fine tuning sensitivity and signal generation:
Calculation Method - Users can choose between calculating the NEUTRONSTAR score based on aggregated scores or by using the state of individual aggregates (long, neutral, short). The score method provides faster signals with slightly more noise, while the state based approach offers a smoother signal.
Sensitivity Threshold - This setting adjusts the system’s sensitivity, defining the width of the neutral zone. Higher thresholds reduce sensitivity, allowing for a broader range of volatility before triggering a trend reversal.
Market Regime Sensitivity - A sensitivity adjustment, ranging from 0 to 100, that affects the sensitivity of the sub components in market regime calculation.
These settings offer flexibility for users to tailor NEUTRONSTAR to their specific needs, whether for medium term investment strategies or shorter term trading setups.
Visualization and Legend
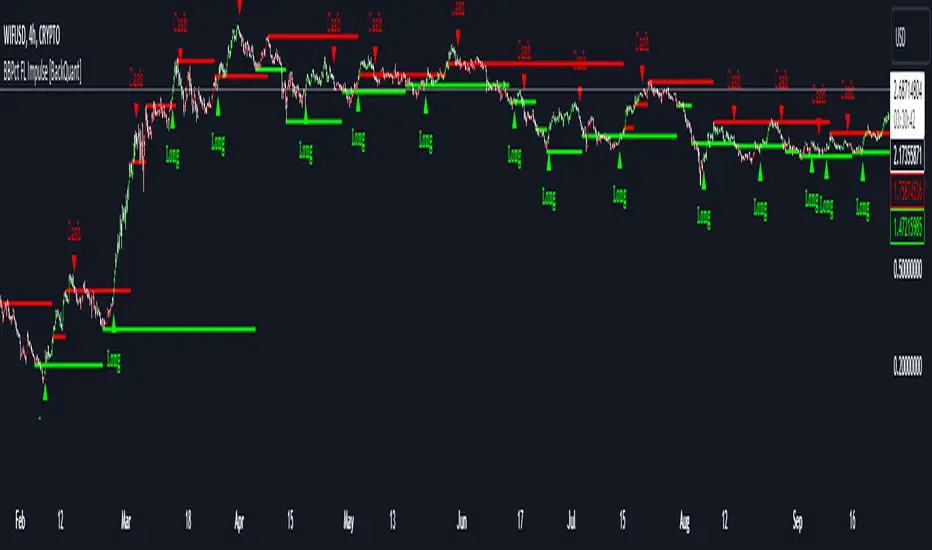
For intuitive usability, NEUTRONSTAR uses color coded bar overlays to indicate trend direction:
Green - indicates an uptrend.
Gray - signals a neutral or transition phase.
Purple - denotes a downtrend.
An optional background color can be enabled for market mode visualization, indicating the overall market state as either trending or mean reverting. This feature allows traders to assess trend direction and strength at a glance, simplifying decision making.
Additional Metrics Table
To support strategic decision making, NEUTRONSTAR includes an additional metrics table for in depth analysis:
Performance Ratios - Sharpe, Sortino, and Omega ratios assess the asset’s risk adjusted returns.
Volatility Insights - Provides an average volatility measure, valuable for understanding market stability.
Beta Measurement - Calculates asset beta against BTC, offering insight into asset volatility in the context of the broader market.
These metrics provide deeper insights into individual asset behavior, supporting more informed trend based allocations. The table is fully customizable, allowing traders to adjust the position and size for a seamless integration into their workspace.
Final Summary
The Trend Titan NEUTRONSTAR indicator is a powerful and resilient trend following system for crypto markets, built with a unique aggregation of high performance models to deliver dependable, noise reduced trend signals. Its robust design, free from overfitting, ensures adaptability across various assets and timeframes. With customizable sensitivity settings, intuitive color coded visualization, and an advanced risk metrics table, NEUTRONSTAR provides traders with a comprehensive tool for identifying and riding profitable trends, while safeguarding capital during unfavorable market phases.
Penunjuk Pine Script®