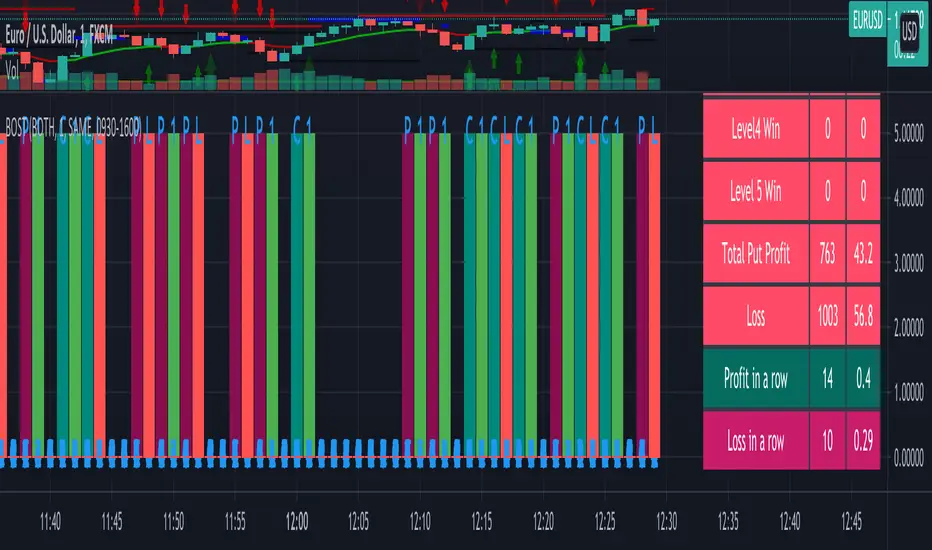
Binary Option Strategy Tester with MartingaleIn Binary options, strategy testing is a bit different. The script is just a try to test Binary options strategies.
Assumption:
We are opening position at next candle after signal come
We are taking the position at opening price
Our call will be profitable if we get a green candle and put will be profitable if we get a red candle
We can open only one trade at a time. So if we are in trade, subsequent signals will be ignored.
The script is not counting your profit or loss, it just counting the winning and losing trades.
Input Options:
Choose long only or short only test. Default is both.
You can continue your trade with Martingale Level, up to 5. Default is 1 (no Martingale)
You can choose Martingale trade type
SAME: if call subsequent trade will be call only and vice versa
OPPOSITE: if call subsequent trade will be put
FOLLOW CANDLE COLOR: Subsequent trade will follow previous candle color
OPPOSITE CANDLE COLOR: Subsequent trade will opposite of previous candle color
You can choose trading session to test. Default is false.
The strategy is taken from Vdub Binary Options SniperVX v1 (by @vdubus) . I have deleted extra parts and kept only the necessary part.
Without Martingale
Result Table
With Martingale
I am very new to Pine script, so waiting for your comments and review.
Trading
RaBot V1.0.0Rabot is an indicator for new users as well as experienced users.
This indicator tries to predict both buy and sell signals. You can configure it for both scalping and swing trading.
It has two modes, one more "conservative", where the number of entries will be less than the other "greedy" mode.
Based on the famous and complex indicator "Koncorde" that combines both trend and volume knowing the manipulation of strong and weak hands, patterns, and crossing of emas customized by us; for example: a buy signal in conservative mode will only open if the trend is bullish and vice versa.
The user can configure the way they like by opening many positions or few but more secure based on their trading style.
The indicator also has the option to configure which chart we want to obtain the trend from, this is to avoid perhaps opening shorts in a very bullish trend line for example.
Rabot is a fairly complex indicator, which can be used for automatic use of inputs and outputs, as well as manual.
You also have the option of NOT opening a position if there is one currently open, and the option for the next signal to be the opposite of the last one.
5TPs, 1SL, and Breakeven after take profit achieved.
Finally version 1.0.0 is now available! :)
This version does not have backtesting (we have another that yes)
We are continuously working, testing and updating bugs and improvements.
Do not hesitate to get in touch for a feedback, it will be welcome and we will take it into account.

RaBot V1.0.0 - BacktestingRabot is an indicator for new users as well as experienced users.
This indicator tries to predict both buy and sell signals. You can configure it for both scalping and swing trading.
It has two modes, one more "conservative", where the number of entries will be less than the other "greedy" mode.
Based on the famous and complex indicator "Koncorde" that combines both trend and volume knowing the manipulation of strong and weak hands, patterns, and crossing of emas customized by us; for example: a buy signal in conservative mode will only open if the trend is bullish and vice versa.
The user can configure the way they like by opening many positions or few but more secure based on their trading style.
The indicator also has the option to configure which chart we want to obtain the trend from, this is to avoid perhaps opening shorts in a very bullish trend line for example.
Rabot is a fairly complex indicator, which can be used for automatic use of inputs and outputs, as well as manual.
You also have the option of NOT opening a position if there is one currently open, and the option for the next signal to be the opposite of the last one.
5TPs, 1SL, and Breakeven after take profit achieved.
Finally version 1.0.0 is now available! :)
This version contains backtesting with 5000 backbars to see if it is being profitable or not.
We are continuously working, testing and updating bugs and improvements.
Do not hesitate to get in touch for a feedback, it will be welcome and we will take it into account.

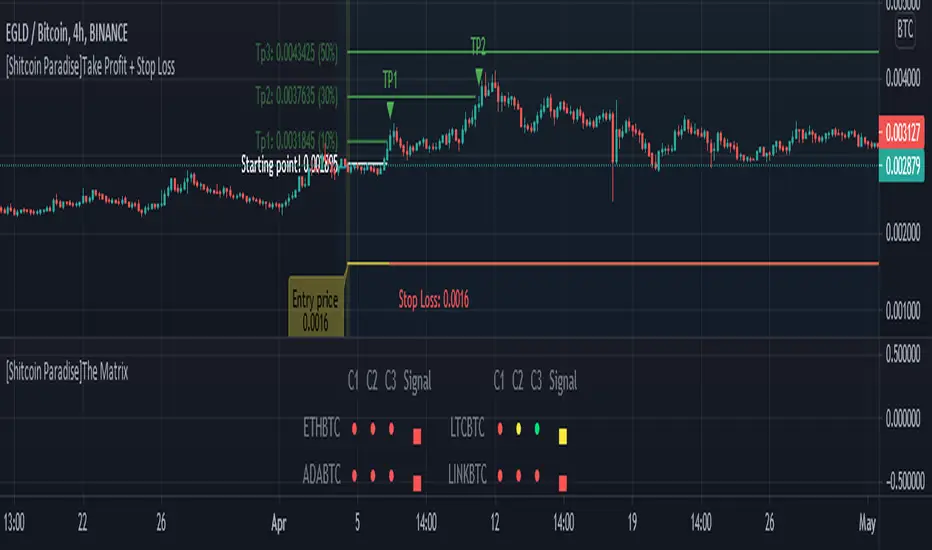
[Shitcoin Paradise]Take Profit + Stop LossThe Take profit + Stop loss indicator is built around The Matrix strategy , it is not suitable for anything else!
*Use it only on 4h charts*
How to use it:
- when a setup from The Matrix is ready, set the date and hour when that setup happened
- set the entry price
- set the targets (you can use the default ones)
- for conservative trading, check the "Use only one TP?" box
- set alert messages for every event
When the price reached the first TP, the stop loss will automatically be moved at entry price, yellow line (entry price) become red(stop loss).
The indicator can be set to have 3 take profits (it takes longer to finish a trade, the reward is greater, but also the risk is bigger), or the conservative way, with only one take profit.
The Take profit + Stop loss indicator uses 3 different stop losses in cascade, multiple algorithms and MTF to calculate them and calculate the starting point, from where the targets are calculated.
Scenario 1:
The price have a setup for continuing the trade, the price touches 1st TP, SL is moved to the entry price, the price reaches all targets => the trade is closed.
Scenario 2:
The price have a setup for continuing the trade, the price touches 1st TP, SL is moved to the entry price, the price fail to touch the other TPs and SL is triggered.
Scenario 3:
The price does not have a setup for continuing the trade, the SL is triggered.
Scenario 4 (conservative trading):
The price have a setup for continuing the trade, the price touches 1st TP => the trade is closed.
For invites, more details and questions, you can send us a private message.
Enjoy!
Shitcoin Paradise

[Shitcoin Paradise]The MatrixThe Matrix strategy is a strategy developed by @zsone and @edward_Z, that combine multiple indicators and algorithms on various time frames.
*Use it only on 4h charts*
The Matrix is built for multiple currencies/pairs and user friendly.
Features:
- possibility to choose your own crypto currencies
- setup is ready when the square from the Signal tab is green (3 green dots)
- set only 1 alert for the entire script (no need to set one alert for each pair)
- it uses multi time frames for better entries
- it uses multiple confirmations
- it have a safety net (you can set to not buy if the candle is greater than x%)
- can be easily paired with 3commas or other trading platform via webhooks
- it is user friendly, so it's ready to use/plug and play
The Matrix strategy gives setups for entries, after that you can set your own exits (take profit, stop loss, trailing stop...), or you can use our Take Profit + Stop Loss indicator , which is built for The Matrix.
For invites, more details and questions, you can send us a private message.
Enjoy!
Shitcoin Paradise
Ichimoku + RSI Crypto trending strategyThis is a crypto trending strategy designed for big timeframes such as 3-4h+.
Its components are:
RSI
ICHIMOKU full pack
Heikin Ashi candles for logic calculation inside
Rules for entry.
For long : we have a long cross condition on ichimoku and price is above the ichimoku lines, and at the same time RSI value is > 50.
For long : we have a short cross condition on ichimoku and price is below the ichimoku lines, and at the same time RSI value is < 50.
Rules for exit
We exit whenever we receive an opposite signal of the initial entry.
SInce this strategy is using no risk management inside, I recommend to be careful with it .
If you have any questions, let me know !

QFL bull bypassThis bypass indicator triggers plots 1 when the price is above the QFL base.
This can be used as a "bypass" by a consumer indicator that can skip trades when the bypass is triggering.
You can use it for long and short strategies, to prevent using buy or sell signals in areas were the price is either overextended.
QFL works better in 1, 2 or 4 hours timeframes.

Supertrend with Chop SuppressionA Standard Supertrend indicator with Chop Suppression added to minimize bad entries when the market goes sideways. Chop Suppression will hide alerts/entry signals that otherwise would have been generated during sideway price action.
Recommend using this indicator with a secondary long-term trend indicator such as VWAP or 200 EMA . Trade with the long-term trend for higher success rates.
You can use either traditional fixed stop loss and profit taking or adjust the stop loss with the rising Supertrend line and exit when color of Supertrend changes.
Good luck!

DAYOFWEEK performance1 -Objective
"What is the ''best'' day to trade .. Monday, Tuesday...."
This script aims to determine if there are different results depending on the day of the week.
The way it works is by dividing data by day of the week (Monday, Tuesday, Wednesday ... ) and perform calculations for each day of the week.
1 - Objective
2 - Features
3 - How to use (Examples)
4 - Inputs
5 - Limitations
6 - Notes
7 - Final Tooughs
2 - Features
AVG OPEN-CLOSE
Calculate de Percentage change from day open to close
Green % (O-C)
Percentage of days green (open to close)
Average Change
Absolute day change (O-C)
AVG PrevD. Close-Close
Percentage change from the previous day close to the day of the week close
(Example: Monday (C-C) = Friday Close to Monday close
Tuesday (C-C) = Monday C. to Tuesday C.
Green % (C1-C)
Percentage of days green (open to close)
AVG Volume
Day of the week Average Volume
Notes:
*Mon(Nº) - Nº = Number days is currently calculated
Example: Monday (12) calculation based on the last 12 Mondays. Note: Discrepancies in numbers example Monday (12) - Friday (11) depend on the initial/end date or the market was closed (Holidays).
3 - How to use (Examples)
For the following example, NASDAQ:AAPL from 1 Jan 21 to 1 Jul 21 the results are following.
The highest probability of a Close being higher than the Open is Monday with 52.17 % and the Lowest Tuesday with 38.46 %. Meaning that there's a higher chance (for NASDAQ:AAPL ) of closing at a higher value on Monday while the highest chance of closing is lower is Tuesday. With an average gain on Tuesday of 0.21%
Long - The best day to buy (long) at open (on average) is Monday with a 52.2% probability of closing higher
Short - The best day to sell (short) at open (on average) is Tuesday with a 38.5% probability of closing higher (better chance of closing lower)
Since the values change from ticker to ticker, there is a substantial change in the percentages and days of the week. For example let's compare the previous example ( NASDAQ:AAPL ) to NYSE:GM (same settings)
For the same period, there is a substantial difference where there is a 62.5% probability Friday to close higher than the open, while Tuesday there is only a 28% probability.
With an average gain of 0.59% on Friday and an average loss of -0.34%
Also, the size of the table (number of days ) depends if the ticker is traded or not on that day as an example COINBASE:BTCUSD
4 - Inputs
DATE RANGE
Initial Date - Date from which the script will start the calculation.
End Date - Date to which the script will calculate.
TABLE SETTINGS
Text Color - Color of the displayed text
Cell Color - Background color of table cells
Header Color - Color of the column and row names
Table Location - Change the position where the table is located.
Table Size - Changes text size and by consequence the size of the table
5 - LIMITATIONS
The code determines average values based on the stored data, therefore, the range (Initial data) is limited to the first bar time.
As a consequence the lower the timeframe the shorter the initial date can be and fewer weeks can be calculated. To warn about this limitation there's a warning text that appears in case the initial date exceeds the bar limit.
Example with initial date 1 Jan 2021 and end date 18 Jul 2021 in 5m and 10 m timeframe:
6 - Notes and Disclosers
The script can be moved around to a new pane if need. -> Object Tree > Right Click Script > Move To > New pane
The code has not been tested in higher subscriptions tiers that allow for more bars and as a consequence more data, but as far I can tell, it should work without problems and should be in fact better at lower timeframes since it allows more weeks.
The values displayed represent previous data and at no point is guaranteed future values
7 - Final Tooughs
This script was quite fun to work on since it analysis behavioral patterns (since from an abstract point a Tuesday is no different than a Thursday), but after analyzing multiple tickers there are some days that tend to close higher than the open.
PS: If you find any mistake ex: code/misspelling please comment.

MY_VISIONThe MY_VISION strategy is designed to work with any tool (cryptocurrency, stocks, forex) on any TF.
The signal formation is based on the Donchan channel with the author's revision of the conditions for fixing the price above or below the trend line.
Setup is set up by adjusting the period and multiplier, which are standard for the Donetsk channel.
Also, the strategy has the ability to display additional signals that may occur in the area of the main signal (LONG/SHORT) after confirming the formed pivot (pivot point/rebound) and subject to the closing of the previous transaction.
You can choose several types of takes:
1. ATR-takes, which depend on the price volatility and the width of the Donetsk channel.
2. FIX-takes that you set manually in % of the price.
3. TRIGGER-takes that are formed according to the triggers found by the script on the chart. Triggers are certain price points that appear on the chart when testing the support or resistance level, in the future, the price in 90% of cases returns to these levels and breaks through them. The MY_VISION strategy finds these points on any TF, takes into account those already worked out/overlapped by the price and uses these values as takes.
You can use from 1 to 3 takes to choose from; the desired take is marked with a check mark in the settings.
You can also use several types of stop lines:
The ATR value of the stop line is formed on the basis of the volatility along the ATR line and has a tuning multiplier that allows you to bring the stop line closer or further away from the price.
1. FIX - a fixed value of the stop line as a % of the entry price of the position.
2. TREND - the value of the stop line is carried out along the base trend line of the Donetsk channel.
3. PIVOT - the value of the stop line is set at the nearest pivot (pivot/rebound point) and is shifted if a new one is formed.
You have the opportunity to activate the stop-line lift under the following conditions:
1. Lift at tp1 to breakeven.
2. Lift at tp2 to breakeven.
3. Lifting the stop line to the specified level in % of the entry point when the price reaches the specified profit. (This is especially convenient if you do not use fixed takings or they are of great importance).
Also, the strategy has the ability to display a table with a list of triggers (the price at which a breakout is expected) at the top and bottom of the current price up to 10 pcs. on each side.
It is possible to display the trend line, the current state of the strategy (position, take values, stop line value), the background illumination of the trading zone (LONG/SHORT). As well as displaying a compact display in the indicator settings table, for the convenience of saving your settings using the PrintScreen function.
You can sign the strategy in the Notes field - this is convenient if you place several versions of the MY_VISION strategy on the chart with different settings (for different pairs or for different TF).
>> In the strategy settings, each field has hints, to do this, hover the cursor over the sign ⓘ
-------------------------------------
The MY_VISION strategy is closed! You can get test access to it for 48 hours.
In order to get access or ask questions, write to me in private messages or by the contacts specified in my signature.
-------------------------------------
Стратегия MY_VISION предназначена для работы с любым инструментом (криптовалюта, акции, форекс) на любом ТФ.
В основе формирования сигналов лежит канал Дончана с авторской доработкой условий закрепления цены выше или ниже трендовой линии.
Настройка сетапа производится с помощью регулировки периода и множителя, стандартных для канала Дончан.
Также в стратегии есть возможность отображения дополнительных сигналов, которые могут возникать в зоне действия основного сигнала (LONG/SHORT) после подтверждения сформировавшегося пивота (точки разворота/отскока) и при условии закрытия предыдущей сделки.
Вы можете выбрать несколько типов тейков:
1. ATR - тейки, которые зависят от волатильности цены и ширины канала Дончан.
2. FIX - тейки, которые Вы задаёте вручную в % от цены.
3. TRIGGER - тейки, которые формируются по найденным скриптом триггерам на графике. Триггеры - это определенные ценовые точки, которые появляются на графике при тестировании уровня поддержки или сопротивления, в дальнейшем цена в 90% случаев возвращается к этим уровням и пробивает их. Стратегия MY_VISION находит эти точки на любом ТФ, учитывает уже отработанные/перекрытые ценой и использует эти значения в качестве тейков.
Вы можете использовать от 1 до 3 тейков на выбор; нужный тейк отмечается в настройках галочкой.
Также Вы можете использовать несколько видов стоп-линий:
1. ATR - значение стоп-линии формируется на базе волатильности по линии ATR и имеет подстроечный множитель, который позволяет приблизить или отдалить стоп-линию от цены.
2. FIX - фиксированное значение стоп-линии в % от цены входа в позицию.
3. TREND - значение стоп-линии ведётся по базовой трендовой линии канала Дончан.
4. PIVOT - значение стоп-линии выставляется по ближайшему пивоту (точке разворота/отскока) и смещается, если формируется новый.
У Вас есть возможность активировать подтяжку стоп-линии при следующих условиях:
1. Подтяжка при tp1 в безубыток.
2. Подтяжка при tp2 в безубыток.
3. Подтяжка стоп-линии на заданный уровень в % от точки входа при достижении ценой заданного профита. (Это особенно удобно, если Вы не используете фиксированные тейки или они имеют большое значение).
Также в стратегии есть возможность отобразить таблицу со списком триггеров (цена, по которой ожидается пробитие) сверху и снизу от текущей цены до 10 шт. с каждой стороны.
Есть возможность отображать трендовую линию, текущее состояние стратегии (позиция, значения тейков, значение стоп-линии), фоновая подсветка торговой зоны (LONG/SHORT). А также отображение компактное отображение в таблице настроек индикатора, для удобства сохранения своих настроек с помощью функции PrintScreen.
Вы можете подписать стратегию в поле Notes - это удобно, если Вы размещаете на графике несколько версий стратегии MY_VISION с разными настройками (для разных пар или для разных ТФ).
>> В настройках стратегии у каждого поля есть подсказки, для этого наведите курсор на знак ⓘ
-------------------------------------
Стратегия MY_VISION является закрытой! Вы можете получить к ней тестовый доступ на 48 часов.
Для того, чтобы получить доступ или задать вопросы пишите мне в личные сообщения или по контактам, указанным в моей подписи.
-------------------------------------

Options Scalping V2This Indicator is Owned by Team Option Scalping.
It has 4 Plots and 2 Tables.
This indicator to be used only in BankNifty Futures
VWAP ( Volume weighted average price )
• User can input the source and enable/disable the VWAP from input section.
• When price is more than the VWAP its Bullish Trend and vice versa.
VWMA ( Volume weighted moving average )
• Default value of 20 is used in VWMA . User can enable/disable it from input section.
• When price is more than the VWMA its Bullish Trend and vice versa.
Parabolic SAR
• User can input “start”, “increment” and “maximum” values from input section and can enable/disable SAR also.
• When price is more than the Parabolic SAR its Bullish Trend and vice versa.
SuperTrend
• User can input ATR Period and ATR Multiplier values from input section. By defaults it’s 10 and 2.
• User have option of enable/disable “Change ATR calculation Method”, if enabled then ATR is calculated differently for SuperTrend.
• Enable/disable “BUY/SELL signals” on SuperTrend.
• When price is more than the SuperTrend its Bullish Trend and vice versa.
Top Right Corner TABLE ( 6 , 10 )
When you are trading in Banknifty futures , we have to check major Banks which is contributing to Banknifty move. So we have given that in this tab.
This table consist data of 9 following stocks:
• BankNifty
• Nifty
• Dow
• INDIA
• VIX
• HDFC
• ICICI
• KOTAK
• AXIS
• SBI
And following data of each stock has been provided:
• LTP
• Daily Change
• Daily Percentage Change
• 15-minute Change Percentage
• 1-Hour Change Percentage
Bottom Right Corner TABLE (3, 6 )
This table consist of 4 indicators values and Up/Down indicator:
• VWMA (When price is more than the VWMA its Bullish and vice versa)
• SuperTrend (10.2, When price is more than the SuperTrend its Bullish and vice versa.)
• RSI (14)
• VWAP (When price is more than the VWAP its Bullish and vice versa.)

Decision Points for TradingSimple script to highlight
Previous Day Low (PDL), Previous Day High(PDH), Previous Day Close(PDC)
Big round Numbers (BRN)
High Of the Day (HoD)
Low Of the Day (LOD)
-- Will add more DP's going fwd.
Usage : Especially useful to trade on NIFTY/Bank Nifty without any additional specific indicators.
Especially for daily analysis and intraday trading - Decision Points(DP's) are critical and will be using this simple script.

mark strategy2 divergence bot v0.5 for xbtusdHi first of all thanks for read this.
This is my second strategy for make trading, I optimized it for xbtusd with 30 min charts.
You can personalize some setting for reach a better result then me, these are the setting:
this script is only for long trade, so bearish divergence don't work
1)ema1
U can change this value for use another ema and use a faster or slower trend
2)ema2
U can change this value for use another ema and use a faster or slower trend
3)pivot right
U can change this value for watch a number of bar on your right
4)pivot left
U can change this value for watch a number of bar on your left
5)high range
U can change this value for watch a max number of bar
6)low range
U can change this value for watch a min number of bar
7)bullish
U can change this value for enable signal with bullish divergence
8)hidden bullish
U can change this value for enable signal with hidden bullish divergence
9)bearish
U can change this value for enable signal with bearish divergence
10)hidden bearish
U can change this value for enable signal with hidden bearish divergence
11)profit 1 %
U can change this value for the first take profit target
12)profit 2 %
U can change this value for the second take profit target
13)qty target 1 %
U can change this value for close a % of your trade at target 1
14)loss %
U can change this value for close the trade at a % of loss
Have nice day and send me a message if u will earn with my strategy.
If u want my code send me a message
for info send me a message

Consecutive Color Reversal for Binary Option TradingThis indicator is only for Binary Option trading. It alerts when a specific number of consecutive same color candlesticks are generated and it signals for a reversal. As an example, when it signals "Long", a long trade should be opened for a few of next candlesticks (upto 2 to 3 candles).

Ichimoku breakoutIf you use Ichimoku Cloud strategies, this indicator is very useful for you!
This code indicates the candles that break the ichimoku cloud in both directions!
conversion line, base line and lagging span are disable by default, you can enable it from settings window.
green triangles under the candles with green backgrounds show break out the red clouds.
red triangles at the top of the candles with red backgrounds show break out the red clouds.
you can set alerts to be notified when an Ichimoku Cloud is broken.

FieryTrading Suite BThis oscillator tries to give traders an idea of the current trend, as well as trend reversals. The higher the lengths, the bigger the potential trends can become. Be aware that higher lengths are less responsive to market movements. The default inputs are best for most traders. Alerts for this indicator can be made in the FT Trading Suite A, indicated by the blue up / down triangles.
Please visit my FieryTrading Suite A for a complete overview:

Legacy Scalper - Trend Trading SystemLegacy Scalper Trend Trading System
Welcome to the Legacy Scalper
This indicator is based on a trend trading strategy using multiple EMA's, with an added colored algo to help traders enter orders while simultaneously reducing noise in the markets by changing candlesticks to one solid color dependant upon direction of price.
This indicator capitalizes on short term momentum while ensuring that you are trading with the trend using the commonly known fact of EMA's being above or below price to ensure the trend.
The customization and plotting of different length EMA's allows for freedom to design your own system within the realm of the indicators, or use the recommended strategies below.
////////
The Legacy Scalper plots 3 main EMA's listed as following:
-50 EMA
-200 EMA
-800 EMA
Additionaly there is an algo coded into the mix that allows for:
- Tradingview alarms for buys and sells
- change of period (frequency) for buys and sells
- color selection of the moving average
- change all candlestick color dependant upon buy and sell alerts.
////////
The Strategies (Or Create Your Own)
Basic
Sell only when you get an alert above the 50 EMA (Only 50 EMA plotted on screen)
Buy only when you get an alert with the 50 EMA below price (Only 50 EMA plotted on screen)
Sell Example:
Intermediate
Sell only when 50EMA is below the 200EMA and you get a sell alert
Buy only when the 50 EMA is above the 200EMA and you get a buy Alert
Buy Example:
Advanced
Sell only when you get a sell alert with all EMA's above price
Buy only when you get a buy alert with all EMA's below price
Example:
Legacy Mode
Backtesting is highly recommended
Remove EMA's and plot a high period MA and take alerts both ways to capitalize on longer moves
And/Or
Add Ema's for swing trading with a higher plot MA
Example:
NOTES:
This is designed to work on all time frames
This is designed to work on all financial instruments
Feel free to backtest which period setting is best, however visually glancing at most charts the default setting appears the best across all instruments.
Feel free to add in other indicators for additional confirmation such as an RSI, TDI, Stoch, or WAE
DISCLAIMER
THIS IS NOT FINANCIAL OR INVESTMENT ADVICE AND SHOULD NOT BE INTERPRETED AS SUCH.
Trading foreign exchange on margin carries a high level of risk, and may not be suitable for all investors. Past performance is not indicative of future results. The high degree of leverage can work against you as well as for you. Before deciding to invest in foreign exchange you should carefully consider your investment objectives, level of experience, and risk appetite. The possibility exists that you could sustain a loss of some or all of your initial investment and therefore you should not invest money that you cannot afford to lose. You should be aware of all the risks associated with foreign exchange trading, and seek advice from an independent financial advisor if you have any doubts.

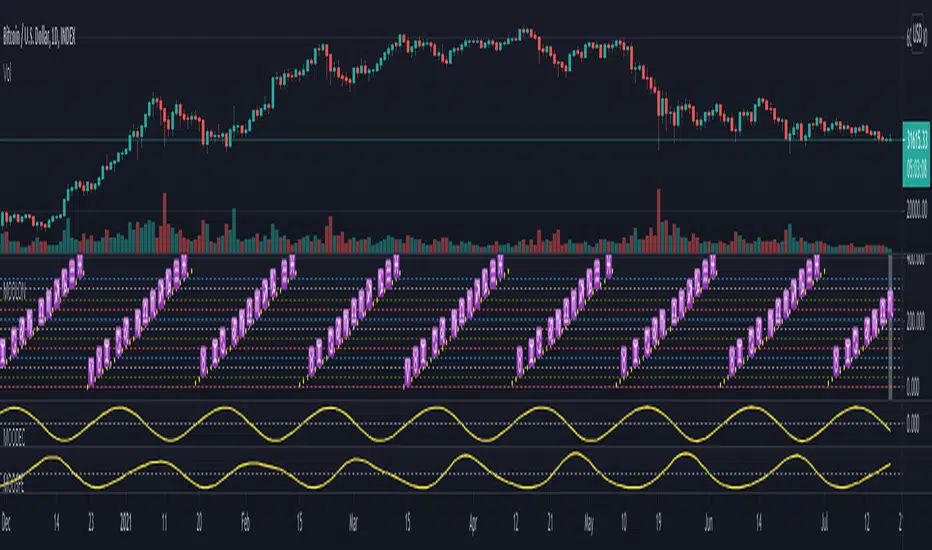
Financial Astrology Moon LongitudeMoon energy represent the masses, crowds, public places, children and emotions. The transit of the Moon through the zodiacal signs will color the crowd emotional responses that fluctuate based on the elemental qualities of the signs: fire (energetic and impulsive), earth (rigid, static, patient), water (assimilation, transformation, humor fluctuations), air (expansion, fervent, germination).
The daily average speed of the Moon is 13 degrees, for this reason the emotional elemental energy is transforming in average every 2 days and few hours, this mood fluctuations produces the short term instinctive and emotional actions performed by traders that forget the precise mathematical / statistical approach in favor of irrational and emotional impulses.
Based on statistical buy/sell frequency analysis we discovered that for BTC-USD, the Moon is usually bullish in zodiac signs: Aries, Libra, Scorpio, Aquarius and Pisces, the most relevant bullish sign is "Aquarius", from 206 observations in all the BTC-USD price history where Moon was in this sign the 60% of those days the price increased compared to the previous day. The bearish zodiac signs for BTC-USD are: Taurus, Cancer, Leo, Sagittarius and Capricorn, the most relevant bearish sign is "Capricorn".
Interestingly this zodiac sign locations tends to fluctuate during some periods of time and from the last 10 observations of the Moon transiting through Aries we noted that 7 of the 10 observations coincide with a dip, sometimes the Moon in Aries indicate the reversal of the short term trend, this is kind of expected considering that when Moon approaches Taurus the fall becomes more likely due to the fact that Moon in Taurus is a bearish signal.
With this indicator there is unlimited possibilities to explore across different markets and complementing with Moon phases this may be the perfect financial astrology indicator for those intraday traders that keep positions only for few hours.
We encourage you to analyze the Moon zodiac sign cycles in different markets and share with us your observations, leave us a comment with your research outcomes. Happy trading!
Note: The Moon longitude indicator is based on an ephemeris array that covers years 2010 to 2030, prior or after this years the longitude is not available, this daily ephemeris are based on UTC time so in order to align properly with the price bars times you should set UTC as your chart reference timezone.
Hull MA with BB (With Alerts)This is a combination of the standard Bollinger bands with a VWAP(Pink line), and the 'Hull Trend with Kahlman' script by user capissimo, and the NMA (Moving Average 3.0 (3rd Generation)) script by everget.
You can find the original scripts here:
This indicator gives you several confirmations of a good entry and exit positions for Crypto currency like bitcoin and most alt coins. I use this on a 15min, 30min, 1hour, and 4hour chart for best results.
How to use:
Entry Signals:
-A candle closes above the NMA (Yellow Step Line). AND
-You see a Long (text) flag. AND
-The candles are near the bottom of the Bollinger bands and heading upwards.
Exit Signals:
-Candles have passed below and closed below the NMA (Yellow Step Line). AND
-You see a Short (text) flag.
It's important to use these confirmations with other indicators so you have the best entry/exit positions, and make sure you are on normal candles and not HA or any other types.
There are alerts built in that you can setup for the Short and Long text flags that you see. These are generally good alerts to follow. I use the alerts as a reminder to check the charts and see if my other indicators line up for a good trade.

Penrose DiagramGreetings Traders! This is my measly 2 dimensional non-curved take on a Penrose Diagram .
What is a Penrose Diagram?
jila.colorado.edu
"A Penrose diagram is a kind of spacetime diagram arranged to make clear the complete causal structure of any given geometry. They are an indispensable map for navigating inside a black hole. Roger Penrose, who invented this kind of diagram in the early 1950s, himself calls them conformal diagrams." - Source: jila.colorado.edu
Penrose Diagrams allow an understanding of an infinite surface by projecting 4D Spheres on 2 Dimension Squares. The 4D shape within the 2D Square has the ability to reference a definable edge on an infinite boundary.
I thought this concept interesting, as I tend to hold a viewpoint of price being infinite in its own nature, and tried to combine the concepts as best I could.
In a true Penrose Diagram, you'd see curvature as you reached the edge of each Diagram Square to represent the curvature of space-time and the distorted boundary. However due to limitations of Pine and perhaps my own abilities, I decided to go the cheap route and opt for straight lines, as well as beginning each new Penrose Diagram on a new Session Start.
Also in this version, you will notice on some instruments that, as an example, two triangles overlap each other when you Extend the Penrose Diagram. The result of this is intentional and is due to the calculation of the first Triangle for the Penrose Diagram. The data points for each triangle are variable upon the average highest/lowest point from Open Price and the Max/Min highest/lowest point from Open Price over a variable amount of days. For typical instruments such as Futures products and Forex, it is common to see differences between the Highest High Breakout & Lowest Low Breakout, and therefore a difference between the true center of the Triangle and the corresponding angles. I prefer to use a 20-Day Average Period for Forex and Futures Products, for Crypto a 30 Day Average Period, all adjustable from the options menu.
Due to the differences between the data points(particularly the difference from the Session Open to the Highest High/ Lowest Low), the initial values for the extended Penrose Diagram will sometimes overlap with the initial triangle for Penrose Diagram creation. However keep in mind, all triangles are exactly the same, just rotated 180°and translated above and below the current Session Open Price. You can confirm this yourself using the handy Triangle Tool in your Drawing Tools directly from your TradingView Chart.
Haven't managed to play around on all instruments yet, so give it a whirl, and any feedback is greatly appreciated. Hope you enjoy!
-@DayTradingOil

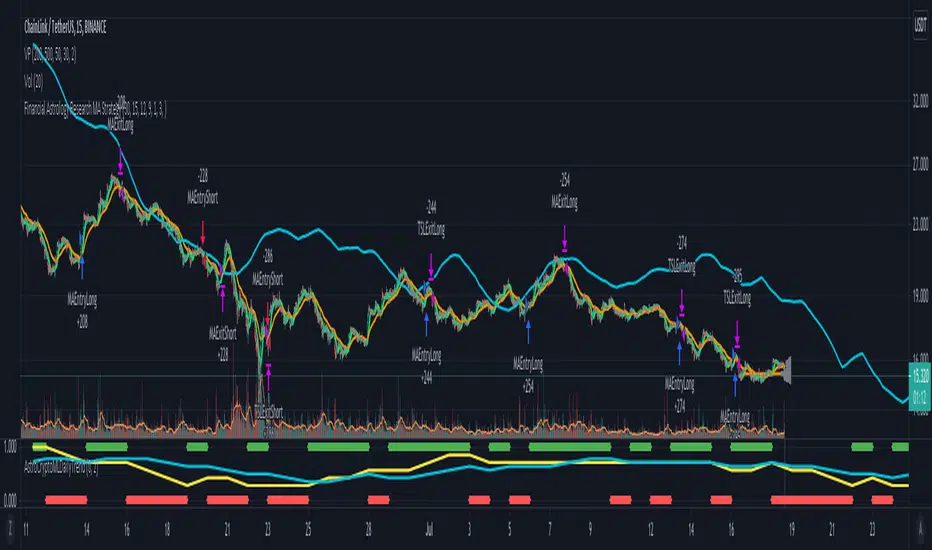
Morun Astro Trend MAs cross StrategyAstrology machine learning cycles indicator signals with technical MAs indicators strategy, based on signals index of Github project github.com
3min Scalp N.roiIndicator for 3 min time frame scalping.
Fast ema + slow Sma for entrance signal
Modified Sar for TP/SL
SIgnals for entry in both Short and Long direction!
Built by
NOEL ROI

Hourly Scalp Engine◆ Purpose of this Script
The Hourly Scalp Engine (HSE) is designed to show scalp long opportunities on lower timeframes (H, 2H or 4H) based on a Fibonacci-valued MA-like structure. It was tested for Bitcoin and Ethereum, with the 2H timeframe seemingly giving the best test results. The chart shows a few instances where the price crossed below the HSE to trigger an entry (marked manually with arrows).
◆ Settings
Default scaling input (10.6) is tuned for Ethereum (ETH/USD) on Kraken.
Scaling input for Bitcoin (XBT/USD) on Kraken: 10.4.
Reasonable timeframes: H, 2H, 4H. Recommended timeframe: 2H.
You should probably set an alert for when Price crosses under the HSE.
◆ Instructions
As this is purely a scalp engine (and not feasible for long-term trades), the instructions have to be followed precisely for intended functionality:
As soon as Price crosses below the HSE, contemplate if you want to scalp, i.e. check current price, other indicators and market conditions. If yes, enter a scalp long. Do not enter the trade if : price has crossed above the HSE already and sits more than 1 % above it, or the down-wick was so deep and quick that it already retraced 10 % to the upside from the wick low (even if price is still below the HSE). In both cases it might be too late to enter.
Watch the 2H candle, at which you entered the trade, closing. Draw a 10 % price range from the wick low to the upside. The range high is your exit point. Set a take profit trigger there. Set a stop loss slightly below the wick low.
Observe the price action for the next 6 hours (i.e. the next three 2H candle closes). If price bounces up and hits the target, you exit with 10 % gains. If price hasn't moved to the target after 6 hours, close the trade at current price. If the stop loss should be hit in the meantime, you will have closed the trade automatically. The 10 % gain as a target was chosen because it seems to be hit very often, while higher targets are not reliably hit.
◆ Example Trade
Shown below is an example trade with correct drawing of the 10 % price range.
◆ Viability
From backtesting this should be a viable strategy for most instances where the HSE is crossed. However the HSE is not as hard as a boundary as e.g. the Confidence Bands (also published by DeanTrader), so that price can and will sometimes breach through (= close below) the HSE (as e.g. in the case of the March 2020 black swan event). Still even there a profitable trade could have been performed on the first bounce dependent on actual entry, although more risky due to very high volatility. Before using the HSE please make yourself familiar with the price action history of the considered asset and review the instances where the price crossed below the HSE in connection with the rules laid out in "Instructions" to understand the system and how to execute the trades. Also note that scalp trades are generally harder to perform than slower-paced swing trades, as timing becomes much more important and noise becomes relevant.
◆ Access
For access to this indicator please contact me via DM on TradingView or on Twitter (linked on my TradingView profile and in my signature).
