Ultimate Market Structure [Alpha Extract]Ultimate Market Structure
A comprehensive market structure analysis tool that combines advanced swing point detection, imbalance zone identification, and intelligent break analysis to identify high-probability trading opportunities.Utilizing a sophisticated trend scoring system, this indicator classifies market conditions and provides clear signals for structure breaks, directional changes, and fair value gap detection with institutional-grade precision.
🔶 Advanced Swing Point Detection
Identifies pivot highs and lows using configurable lookback periods with optional close-based analysis for cleaner signals. The system automatically labels swing points as Higher Highs (HH), Lower Highs (LH), Higher Lows (HL), and Lower Lows (LL) while providing advanced classifications including "rising_high", "falling_high", "rising_low", "falling_low", "peak_high", and "valley_low" for nuanced market analysis.
swingHighPrice = useClosesForStructure ? ta.pivothigh(close, swingLength, swingLength) : ta.pivothigh(high, swingLength, swingLength)
swingLowPrice = useClosesForStructure ? ta.pivotlow(close, swingLength, swingLength) : ta.pivotlow(low, swingLength, swingLength)
classification = classifyStructurePoint(structureHighPrice, upperStructure, true)
significance = calculateSignificance(structureHighPrice, upperStructure, true)
🔶 Significance Scoring System
Each structure point receives a significance level on a 1-5 scale based on its distance from previous points, helping prioritize the most important levels. This intelligent scoring system ensures traders focus on the most meaningful structure breaks while filtering out minor noise.
🔶 Comprehensive Trend Analysis
Calculates momentum, strength, direction, and confidence levels using volatility-normalized price changes and multi-timeframe correlation. The system provides real-time trend state tracking with bullish (+1), bearish (-1), or neutral (0) direction assessment and 0-100 confidence scoring.
// Calculate trend momentum using rate of change and volatility
calculateTrendMomentum(lookback) =>
priceChange = (close - close ) / close * 100
avgVolatility = ta.atr(lookback) / close * 100
momentum = priceChange / (avgVolatility + 0.0001)
momentum
// Calculate trend strength using multiple timeframe correlation
calculateTrendStrength(shortPeriod, longPeriod) =>
shortMA = ta.sma(close, shortPeriod)
longMA = ta.sma(close, longPeriod)
separation = math.abs(shortMA - longMA) / longMA * 100
strength = separation * slopeAlignment
❓How It Works
🔶 Imbalance Zone Detection
Identifies Fair Value Gaps (FVGs) between consecutive candles where price gaps create unfilled areas. These zones are displayed as semi-transparent boxes with optional center line mitigation tracking, highlighting potential support and resistance levels where institutional players often react.
// Detect Fair Value Gaps
detectPriceImbalance() =>
currentHigh = high
currentLow = low
refHigh = high
refLow = low
if currentOpen > currentClose
if currentHigh - refLow < 0
upperBound = currentClose - (currentClose - refLow)
lowerBound = currentClose - (currentClose - currentHigh)
centerPoint = (upperBound + lowerBound) / 2
newZone = ImbalanceZone.new(
zoneBox = box.new(bar_index, upperBound, rightEdge, lowerBound,
bgcolor=bullishImbalanceColor, border_color=hiddenColor)
)
🔶 Structure Break Analysis
Determines Break of Structure (BOS) for trend continuation and Directional Change (DC) for trend reversals with advanced classification as "continuation", "reversal", or "neutral". The system compares pre-trend and post-trend states for each break, providing comprehensive trend change momentum analysis.
🔶 Intelligent Zone Management
Features partial mitigation tracking when price enters but doesn't fully fill zones, with automatic zone boundary adjustment during partial fills. Smart array management keeps only recent structure points for optimal performance while preventing duplicate signals from the same level.
🔶 Liquidity Zone Detection
Automatically identifies potential liquidity zones at key structure points for institutional trading analysis. The system tracks broken structure points and provides adaptive zone extension with configurable time-based limits for imbalance areas.
🔶 Visual Structure Mapping
Provides clear visual indicators including swing labels with color-coded significance levels, dashed lines connecting break points with BOS/DC labels, and break signals for continuation and reversal patterns. The adaptive zones feature smart management with automatic mitigation tracking.
🔶 Market Structure Interpretation
HH/HL patterns indicate bullish market structure with trend continuation likelihood, while LH/LL patterns signal bearish structure with downtrend continuation expected. BOS signals represent structure breaks in trend direction for continuation opportunities, while DC signals warn of potential reversals.
🔶 Performance Optimization
Automatic cleanup of old structure points (keeps last 8 points), recent break tracking (keeps last 5 break events), and efficient array management ensure smooth performance across all timeframes and market conditions.
Why Choose Ultimate Market Structure ?
This indicator provides traders with institutional-grade market structure analysis, combining multiple analytical approaches into one comprehensive tool. By identifying key structure levels, imbalance zones, and break patterns with advanced significance scoring, it helps traders understand market dynamics and position themselves for high-probability trade setups in alignment with smart money concepts. The sophisticated trend scoring system and intelligent zone management make it an essential tool for any serious trader looking to decode market structure with precision and confidence.
Trading

Candle close on high time frameOVERVIEW
This indicator plots persistent closing levels of higher time frame candles (H1, H4, and Daily) on the active intraday chart in real time. Unlike similar tools, it offers granular control over line projection length, fully independent toggles per timeframe, and a built-in mechanism that automatically limits the total number of historical levels to avoid chart clutter and performance issues.
CONCEPTS
Key levels from higher time frames often act as areas where price reacts or consolidates. By projecting each candle's exact closing price forward as a horizontal reference, traders can quickly identify dynamic support and resistance zones relevant to the current price action. This indicator enables seamless multi-timeframe analysis without the need to manually switch chart intervals or re-draw lines.
FEATURES
Independent Time Frame Selection: Enable or disable H1, H4, and Daily levels individually to tailor the analysis.
Custom Extension Length: Each timeframe's closing level can be projected forward for a user-defined number of bars.
Performance Optimization: The script maintains an internal limit (default: 100) on the number of active lines. When this threshold is exceeded, the oldest lines are removed automatically.
Visual Differentiation: Colors for each timeframe are fully customizable, enabling immediate recognition of level origin.
Immediate Update: New levels appear as soon as a higher timeframe candle closes, ensuring real-time reference.
USAGE
From the indicator inputs, select which timeframes you want to track.
Adjust the extension lengths to fit your trading style and time horizon.
Customize the line colors for clarity and personal preference.
Use these projected levels as part of your confluence criteria for entries, exits, or stop placement.
Combine with trend indicators or price action tools to enhance your multi-timeframe strategy.
ORIGINALITY AND ADDED VALUE
While similar scripts exist that plot higher timeframe levels, this implementation differs in:
Its efficient automatic cleanup of old lines to preserve chart performance.
The independent extension and color settings per timeframe.
Immediate reaction to new candle closes without repainting.
Simplicity of use combined with precise customization.
This combination makes it a practical and flexible tool for traders who rely on clear HTF level visualization without manual drawing or the limitations of built-in TradingView tools.
LICENSE
This script is published open-source under the Mozilla Public License 2.0.

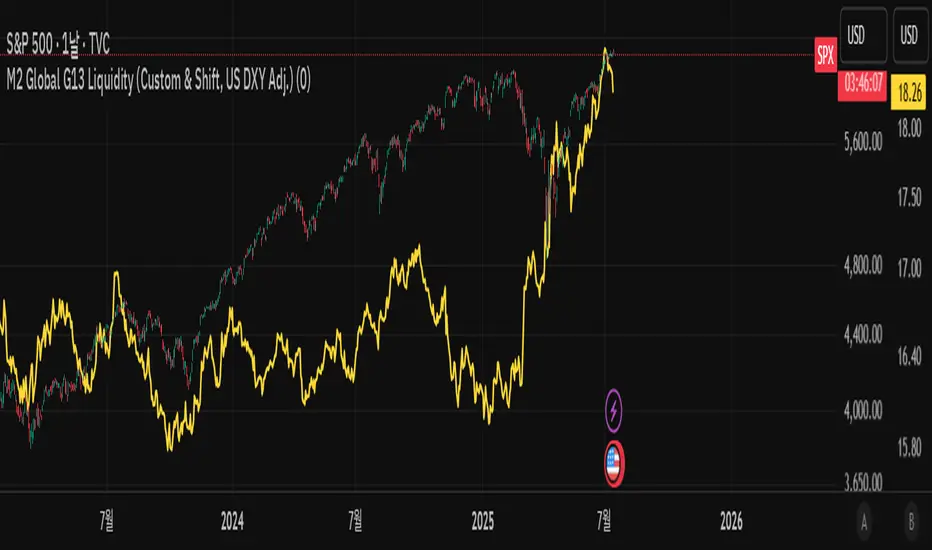
M2 Global G13 Liquidity (Custom & Shift, US DXY Adj.)🌎 M2 Global G13 Liquidity index (Custom & Shift, US DXY Adj.)
💡 Indicator Overview
The M2 Global G13 Liquidity indicator combines the M2 liquidity of 13 major countries, allowing users to selectively include or exclude each country to visualize global capital flows and potential investment liquidity at a glance.
Each country's M2 data is converted to USD using real-time exchange rates, and the US M2 is further adjusted using the Dollar Index (DXY) to reflect the impact of dollar strength or weakness on US liquidity.
✅ What is M2?
M2 is a broad measure of money supply that includes cash, demand deposits, savings deposits, and certain financial products.
It represents a country's overall liquidity and capital supply and is often interpreted as "dry powder" ready to be deployed into various assets such as equities, real estate, and bonds.
Therefore, M2 serves as a crucial benchmark for assessing a country's potential investment capacity that can flow into markets at any time.
💰 Exchange Rate & Dollar Index Adjustment
- All country M2 data is converted from local currencies to USD.
- The US M2 is further adjusted using the Dollar Index (DXY) to better reflect its real global power:
- DXY > 100 → Liquidity contraction (strong dollar effect)
- DXY < 100 → Liquidity expansion (weak dollar effect)
🗺️ Country Selection Options
- Default selection: United States
- Major selections: China, Eurozone, Japan, United Kingdom (core G5 economies)
- Additional selections: Switzerland, Canada, India, Russia, Brazil, South Korea, Mexico, South Africa
- Users can freely add or remove countries to customize the indicator to match their analytical needs.
📈 Example Use Cases
- Monitor global capital flows: Track worldwide liquidity trends and detect potential market risk signals.
- Analyze exchange rate and monetary policy trends: Compare dollar strength with major central bank policies.
- Benchmark against equity indices: Evaluate correlations with MSCI World, KOSPI, NASDAQ, etc.
- Valuation analysis: Compare overall liquidity levels to equity index prices or market capitalization to assess relative valuation and identify potential overvaluation or undervaluation.
- Crisis response strategy: Identify liquidity contraction during global credit crises or deleveraging phases.
==================================================
🌎 M2 글로벌 G13 유동성 지수 (Custom & Shift, US DXY Adj.)
💡 지표 소개
M2 Global G13 Liquidity 지표는 세계 13개 주요국의 M2 유동성을 선택적으로 결합하여, 글로벌 자금 흐름과 잠재 투자 자금을 한눈에 시각화할 수 있도록 설계된 종합 유동성 지표입니다.
국가별 M2 데이터를 환율과 결합해 달러 기준으로 표준화하며, 특히 미국 M2는 달러지수(DXY)로 보정하여 달러 강약에 따른 파급력을 반영합니다.
✅ M2란?
M2는 광의 통화지표로, 현금 + 요구불 예금 + 저축성 예금 + 일부 금융상품을 포함합니다.
이는 한 국가의 유동성 수준과 자금 공급 상태를 나타내는 핵심 거시경제 지표이며, **주식·부동산·채권 등 다양한 자산에 투자될 준비가 된 '대기자금'**으로도 해석됩니다.
따라서 M2는 투자시장으로 언제든지 흘러들어갈 수 있는 잠재적 투자 역량을 평가할 때 중요한 기준입니다.
💰 환율 및 달러지수 보정
- 모든 국가 M2는 자국 통화에서 **달러(USD)**로 환산됩니다.
- 특히 미국 M2는 달러 가치의 글로벌 실질 파워를 평가하기 위해 DXY 보정을 적용합니다.
- DXY > 100 → 유동성 축소 (강달러 효과)
- DXY < 100 → 유동성 확대 (약달러 효과)
🗺️ 국가별 선택 옵션
- 기본 선택: 미국
- 주요 선택: 중국, 유로존, 일본, 영국 (주요 G5)
- 추가 선택: 스위스, 캐나다, 인도, 러시아, 브라질, 한국, 멕시코, 남아공
- 사용자는 각 국가를 자유롭게 더하거나 빼면서 커스터마이즈할 수 있습니다.
📈 활용 예시
- 글로벌 자금 흐름 모니터링: 전세계 유동성 추세 및 시장 리스크 신호 분석
- 환율/금리 정책 분석: 달러 강약과 주요국 정책 변화 비교
- 주가지수 벤치마크 비교: MSCI World, 코스피, 나스닥 등과 상관관계 확인
- 밸류에이션 분석: 전체 유동성 수준을 주가지수나 시가총액과 비교하여, 시장의 상대적 고평가·저평가 여부를 평가
- 위기 대응 전략: 글로벌 신용위기·자금 긴축 국면 대비
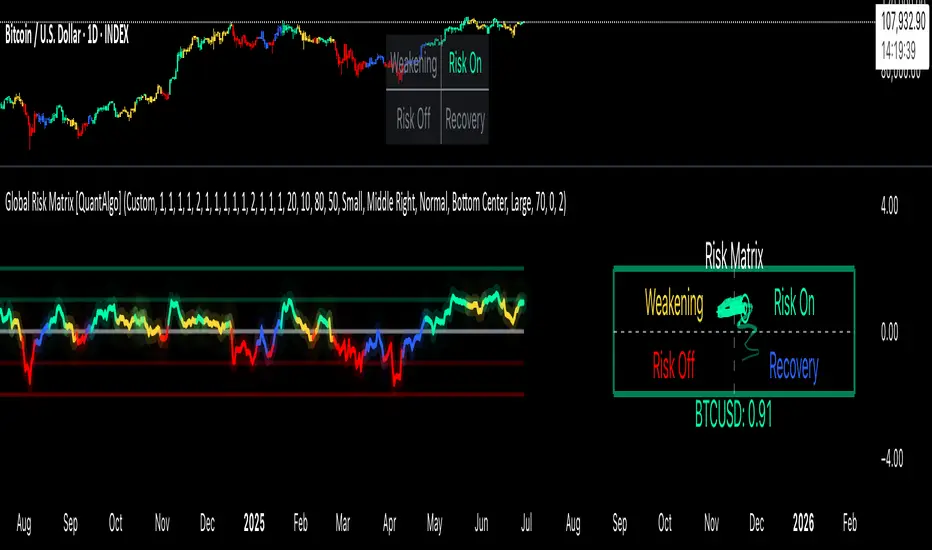
Global Risk Matrix [QuantAlgo]🟢 Overview
The Global Risk Matrix is a comprehensive macro risk assessment tool that aggregates multiple global financial indicators into a unified risk sentiment framework. It transforms diverse economic data streams (from currency strength and liquidity measures to volatility indices and commodity prices) into standardized Z-Score readings to identify market regime shifts across risk-on and risk-off conditions.
The indicator displays both a risk oscillator showing weighted average sentiment and a dynamic 2D matrix visualization that plots signal strength against momentum to reveal current market phase and historical evolution. This helps traders and investors understand broad market conditions, identify regime transitions, and align their strategies with prevailing macro risk environments across all asset classes.
🟢 How It Works
The indicator employs Z-Score normalization across various global macro components, each representing distinct aspects of market liquidity, sentiment, and economic health. Raw data from sources like DXY, S&P 500, Fed liquidity, global M2 money supply, VIX, and commodities undergoes statistical standardization. Several components are inverted (USDT.D, DXY, VIX, credit spreads, treasury bonds, gold) to align with risk-on interpretation, where positive values indicate bullish conditions.
This unique system applies configurable weights to each component based on selected asset class presets (Crypto Investor/Trader, Stock Trader, Commodity Trader, Forex Trader, Risk Parity, or Custom), creating a weighted average Z-Score. It then analyzes both signal strength and momentum direction to classify market conditions into four distinct phases: Risk-On (positive signal, rising momentum), Risk-Off (negative signal, falling momentum), Recovery (negative signal, rising momentum), and Weakening (positive signal, falling momentum). The 2D matrix visualization plots these dimensions with historical trail tracking to show regime evolution over time.
🟢 How to Use
1. Risk Oscillator Interpretation and Phase Analysis
Positive Territory (Above Zero) : Indicates risk-on conditions with capital flowing toward growth assets and higher risk tolerance
Negative Territory (Below Zero) : Signals risk-off sentiment with capital seeking safety and defensive positioning
Extreme Levels (±2.0) : Represent statistically significant deviations that often precede regime reversals or trend exhaustion
Zero Line Crosses : Mark critical transitions between risk regimes, providing early signals for portfolio rebalancing
Phase Color Coding : Green (Risk-On), Red (Risk-Off), Blue (Recovery), Yellow (Weakening) for immediate regime identification
2. Risk Matrix Visualization and Trail Analysis
Current Position Marker (⌾) : Shows real-time location in the risk/momentum space for immediate situational awareness
Historical Trail : Connected path showing recent market evolution and regime transition patterns
Quadrant Analysis : Risk-On (upper right), Risk-Off (lower left), Recovery (lower right), Weakening (upper left)
Trail Patterns : Clockwise rotation typically indicates healthy regime cycles, while erratic movement suggests uncertainty
3. Pro Tips for Trading and Investing
→ Portfolio Allocation Filter : Use Risk-On phases to increase exposure to growth assets, small caps, and emerging markets while reducing defensive positions during confirmed green phases
→ Entry Timing Enhancement : Combine Recovery phase signals with your technical analysis for optimal long entry points when macro headwinds are clearing but prices haven't fully recovered
→ Risk Management Overlay : Treat Weakening phase transitions as early warning systems to tighten stop losses, reduce position sizes, or hedge existing positions before full Risk-Off conditions develop
→ Sector Rotation Strategy : During Risk-On periods, favor cyclical sectors (technology, consumer discretionary, financials) while Risk-Off phases favor defensive sectors (utilities, consumer staples, healthcare)
→ Multi-Timeframe Confluence : Use daily matrix readings for strategic positioning while applying your regular technical analysis on lower timeframes for precise entry and exit execution
→ Divergence Detection : Watch for situations where your asset shows bullish technical patterns while the matrix shows Risk-Off conditions—these often provide the highest probability short opportunities and vice versa
Volatility-Adjusted Momentum Score (VAMS) [QuantAlgo]🟢 Overview
The Volatility-Adjusted Momentum Score (VAMS) measures price momentum relative to current volatility conditions, creating a normalized indicator that identifies significant directional moves while filtering out market noise. It divides annualized momentum by annualized volatility to produce scores that remain comparable across different market environments and asset classes.
The indicator displays a smoothed VAMS Z-Score line with adaptive standard deviation bands and an information table showing real-time metrics. This dual-purpose design enables traders and investors to identify strong trend continuation signals when momentum persistently exceeds normal levels, while also spotting potential mean reversion opportunities when readings reach statistical extremes.
🟢 How It Works
The indicator calculates annualized momentum using a simple moving average of logarithmic returns over a specified period, then measures annualized volatility through the standard deviation of those same returns over a longer timeframe. The raw VAMS score divides momentum by volatility, creating a risk-adjusted measure where high volatility reduces scores and low volatility amplifies them.
This raw VAMS value undergoes Z-Score normalization using rolling statistical parameters, converting absolute readings into standardized deviations that show how current conditions compare to recent history. The normalized Z-Score receives exponential moving average smoothing to create the final VAMS line, reducing false signals while preserving sensitivity to meaningful momentum changes.
The visualization includes dynamically calculated standard deviation bands that adjust to recent VAMS behavior, creating statistical reference zones. The information table provides real-time numerical values for VAMS Z-Score, underlying momentum percentages, and current volatility readings with trend indicators.
🟢 How to Use
1. VAMS Z-Score Bands and Signal Interpretation
Above Mean Line: Momentum exceeds historical averages adjusted for volatility, indicating bullish conditions suitable for trend following
Below Mean Line: Momentum falls below statistical norms, suggesting bearish conditions or downward pressure
Mean Line Crossovers: Primary transition signals between bullish and bearish momentum regimes
1 Standard Deviation Breaks: Strong momentum conditions indicating statistically significant directional moves worth following
2 Standard Deviation Extremes: Rare momentum readings that often signal either powerful breakouts or exhaustion points
2. Information Table and Market Context
Z-Score Values: Current VAMS reading displayed in standard deviations (σ), showing how far momentum deviates from its statistical norm
Momentum Percentage: Underlying annualized momentum displayed as percentage return, quantifying the directional strength
Volatility Context: Current annualized volatility levels help interpret whether VAMS readings occur in high or low volatility environments
Trend Indicators: Directional arrows and change values provide immediate feedback on momentum shifts and market transitions
3. Strategy Applications and Alert System
Trend Following: Use sustained readings beyond the mean line and 1σ band penetrations for directional trades, especially when VAMS maintains position in upper or lower statistical zones
Mean Reversion: Focus on 2σ extreme readings for contrarian opportunities, particularly effective in sideways markets where momentum tends to revert to statistical norms
Alert Notifications: Built-in alerts for mean crossovers (regime changes), 1σ breaks (strong signals), and 2σ touches (extreme conditions) help monitor multiple instruments for both continuation and reversal setups

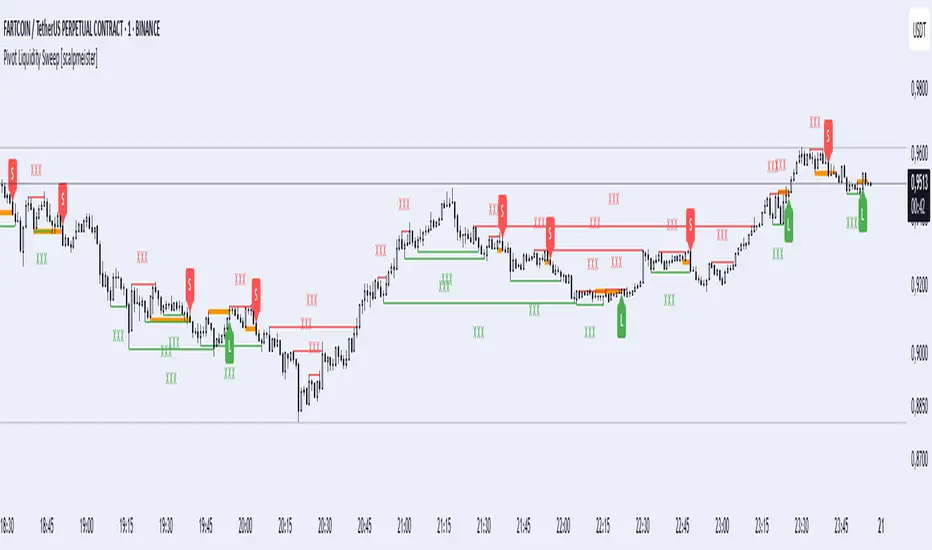
Pivot Liquidity Sweep [scalpmeister]📌 Pivot Liquidity Sweep
Scalp-oriented, liquidity sweep-based advanced signal and strategy indicator.
This indicator analyzes the price's sweeping of significant pivot levels and the subsequent breakouts to generate long/short signals based on different logics. It is sensitive to both classic sweep logic and strong reversal candles. Additionally, it visually marks liquidity gathering zones, offering excellent opportunities especially for scalp and intraday traders.
⚙️ Features and Strategy Types
🟢 Automatic Pivot Detection:
Pivot high/low levels are detected and stored based on the number of left and right bars.
🔴 Sweep Detection (Stop Hunt):
If the price violates a pivot level with a wick and closes inside, it is considered a sweep (liquidity cleaning). Strategies activate after this sweep.
🧠 5 Different Signal Styles:
SweepBreak:
It is expected that the extreme (high/low) level of the sweeping candle is broken with a close.
PivotBreak:
After the sweep, the first newly formed pivot in the trend direction is expected to break. (It is dynamically determined and drawn on the chart.)
StrongSweep:
It is sufficient if the candle following the sweep surpasses the previous candle with a single candle. No additional breakout is expected.
StrongCandle:
Strong momentum candles measured with a special RSI calculation are taken into account. It considers strong opposite-direction candles formed shortly after a pivot sweep.
ReversalCandleSweep:
Reversal candles that close in the opposite direction after a sweep (e.g., a red close on a sweep candle formed at the top or a green close at the bottom) are directly considered as signals.
📐 Technical Details:
Signals are triggered only once (triggered control).
Sweep lines (green/red), Long and Short lines (Orange)
Strong candles are filtered using an RSI-momentum-based measurement system (StrongCandle).
Sweep and breakout zones are dynamically invalidated. That is, if the zones are violated by the price, the signals and lines are automatically canceled.
🎯 Who Should Use It?
Professional traders working with liquidity zones
Scalp and intraday strategy practitioners
Those focused on stop hunts, sweeps, and reversal zones
🔔 Alert Support:
Sweep High / Low Alert
Long / Short Signal Alert
Bear Market Defender [QuantraSystems]Bear Market Defender
A system to short Altcoins when BTC is ranging or falling - benefit from Altcoin bleed or collapse .
QuantraSystems guarantees that the information created and published within this document and on the TradingView platform is fully compliant with applicable regulations, does not constitute investment advice, and is not exclusively intended for qualified investors.
Important Note!
The system equity curve presented here has been generated as part of the process of testing and verifying the methodology behind this script.
Crucially, it was developed after the system was conceptualized, designed, and created, which helps to mitigate the risk of overfitting to historical data. In other words, the system was built for robustness, not for simply optimizing past performance.
This ensures that the system is less likely to degrade in performance over time, compared to hyper-optimized systems that are tailored to past data. No tweaks or optimizations were made to this system post-backtest.
Even More Important Note!!
The nature of markets is that they change quickly and unpredictably. Past performance does not guarantee future results - this is a fundamental rule in trading and investing.
While this system is designed with broad, flexible conditions to adapt quickly to a range of market environments, it is essential to understand that no assumptions should be made about future returns based on historical data. Markets are inherently uncertain, and this system - like all trading systems - cannot predict future outcomes.
INTRODUCTION TO THE STAR FRAMEWORK
The STAR Framework – an abbreviation for Strategic Trading with Adaptive Risk - is a bespoke portfolio-level infrastructure for dynamic, multi-asset crypto trading systems. It combines systematic position management, adaptive sizing, and “intra-system” diversification, all built on a rigorous foundation of Risk-based position sizing .
At its core, STAR is designed to facilitate:
Adaptive position sizing based on user-defined maximum portfolio risk
Capital allocation across multiple assets with dynamic weight adjustment
Execution-aware trading with robust fee and slippage adjustment
Realistic equity curve logic based on a compounding realized PnL and additive unrealized PnL
The STAR Framework is intended for use as both a standalone portfolio system or preferred as a modular component within a broader trading “global portfolio” - delivering a balance of robustness and scalability across strategy types, timeframes, and market regimes.
RISK ALLOCATION VIA "R" CALCULATIONS
The foundational concept behind STAR is the use of the R unit - a dynamic representation of risk per trade. R is defined by the distance between a trade's entry and its stoploss, making it an intuitive and universally adaptive sizing unit across any token, timeframe, or market.
Example: Suppose the entry price is $100, and the stoploss is $95. A $5 move against the position represents a 1R loss. A 15% price increase to $115 would equal a +3R gain.
This makes R-based systems highly flexible: the user defines the percentage of capital that is put at risk per R and all positions are scaled accordingly - whether the token is volatile, illiquid, or slow-moving.
R is an advantageous method for determine position sizing - instead of being tied to complex value at risk mechanisms with having layered exit criteria, or continuous volatility-based sizing criteria that need to be adjusted while in an open trade, R allows for very straightforward sizing, invalidation and especially risk control – which is the most fundamental.
REALIZED BALANCE, FEES & SLIPPAGE ACCOUNTING
All position sizing, risk metrics, and the base equity curve within STAR are calculated based on realized balance only .
This means:
No sizing adjustments are made based on unrealized profit and loss ✅
No active positions are included in the system's realized equity until fully closed ✅
Every trade is sized precisely according to current locked-in realized portfolio balance ✅
This creates the safest risk profile - especially when multiple trades are open. Unrealized gains are not used to inflate sizing, ensuring margin safety across all assets.
All calculations also incorporate slippage and fees, based on user-defined estimates – which can and should be based upon user-collected data - and updated frequently forwards in time. These are not cosmetic, or simply applied to the final equity curve - they are fully integrated into the dynamic position sizing and equity performance , ensuring:
Stoploss hits result in exactly a −1R loss, even after slippage and fees ✅
Winners are discounted based on realistic execution costs ✅
No trade is oversized due to unaccounted execution costs ✅
Example - Slippage in R Units:
Let R be defined as the distance from entry to stoploss.
Suppose that distance is $1, and the trade is closed at a win of +$2.
If execution slippage leads to a 50 cent worse entry and a 50 cent worse exit, you’ve lost $1 extra - which is an additional 1R in execution slippage. This makes the effective return 1.0R instead of the intended 2.0R.
This is equivalent to a slippage value of 50%.
Thus, slippage in STAR is tracked and modelled on an R-adjusted basis , enabling more accurate long-term performance modelling.
MULTI-ASSET, LONG/SHORT SUPPORT
STAR supports concurrent long and short positions across multiple tokens. This can sometimes result in partially hedged exposure - for example, being long one asset and short another.
This structure has key benefits:
Diversifies idiosyncratic risk by distributing exposure across multiple tokens
Allows simultaneous exploitation of relative strength and weakness
Reduces portfolio volatility via natural hedging during reduced trending periods
Even in a highly correlated market like crypto, short-term momentum behaviour often varies between tokens - making diversified, multi-directional exposure a strategic advantage .
EQUITY CURVE
The STAR framework only updates the underlying realized equity when a position is closed, and the trade outcome is known. This approach ensures:
True representation of actual capital available for trading
No exposure distortion due to unrealized gains
Risk remains tightly linked to realized results
This trade-to-trade basis for realized equity modelling eliminates the common pitfall of overallocation based on unrealized profits.
The visual equity curve represents an accurate visualization of the Total Equity however, which is equivalent to what would be the realized equity if all trades were closed on the prior bar close.
TIMEFRAME CONSIDERATIONS
Lower timeframes typically yield better performance for STAR due to:
Greater data density per day - more observations = better statistical inference
Faster compounding - more trades per week = faster capital rotation
However, lower timeframes also suffer from increased slippage and fees. STAR's execution-aware structure helps mitigate this, but users must still choose timeframes appropriate to their liquidity, costs, and operational availability.
INPUT OPTIONS
Fees (direct trading costs - the percentage of capital removed from the initial position size)
Slippage (execution delay, as a percentage. In practice, the fill price is often worse than the signal price. This directly affects R and hence position sizing)
Risk % ( Please note : this is the risk level if every position is opened at once. 5% risk for 5 assets is 1% risk per position)
System Start date
Float Precision value of displayed numbers
Table visualization - positioning and table sizes
Adjustable color options
VISUAL SIMPLICITY
To avoid usual unnecessary complexity and empower fast at-a-glance action taking, as well as enable mobile compatibility, only the most relevant information is presented.
This includes all information required to open positions in one table.
As well as a quick and straightforward overview for the system stats
Lastly, there is an optional table that can be enabled
displaying more detailed information if desired:
USAGE GUIDELINES
To use STAR effectively:
Input your average slippage and fees %
Input your maximum portfolio risk % (this controls overall leverage and is equivalent to the maximum loss that the allocation to STAR would bring if ALL positions are allocated AND hit their stop loss at the same time)
Wait for signal alerts with entry, stop, and size details
STAR will dynamically calculate sizing, risk exposure, and portfolio allocation on your behalf. Position multipliers, stop placement, and asset-specific risk are all embedded in the system logic.
Note: Leverage must be manually set to ISOLATED on your exchange platform to prevent unwanted position linking.
ABOUT THE BEAR MARKET DEFENDER STRATEGY
The first strategy to launch on the STAR Framework is the BEAR MARKET DEFENDER (BMD) - a fast-acting, trend following system based upon the Trend Titan NEUTRONSTAR. For the details of the logic behind NEUTRONSTAR, please refer to the methodology and trend aggregation section of the following indicator:
The BMD ’s short side exit calculation methodology is slightly improved compared to NEUTRONSTAR, to capture downtrends more consistently and also cut positions faster – which is crucial when considering general jump risk in the Crypto space.
Accordingly, the only focus of the BMD is to capture trends to the short side, providing the benefit of being in a spectrum from no correlation to being negatively correlated in risk and return behavior to classical Crypto long exposure.
More precisely, Crypto behavior showcases that when Bitcoin is in a ranging/mean reverting environment, most tokens that don’t fall into the “Blue-Chip” category tend to find themselves in a trend towards 0.
Typically during this period most Crypto portfolios suffer heavily due to a “Crypto-long” biased exposure.
The Bear Market Defender thrives in these chaotic, high volatility markets where most coins trend towards zero while the traditional Crypto long exposure is either flat or in a drawdown, therefore the BMD adds a source of uncorrelated risk and returns to hedge typical long exposure and bolster portfolio volatility.
Because of the BMD's short-only exposure, it will often suffer small losses during strong uptrends. During these periods, long exposure performs the best and the goal is to outperform the temporary underperformance in the BMD .
To take advantage of the abovementioned behavior of most tokens trending to zero, assets traded in the BMD are systematically updated on a quarterly basis with available liquidity being an important consideration for the tokens to be eligible for selection.
FINAL SUMMARY
The STAR Framework represents a new generation of portfolio grade trading infrastructure, built around disciplined execution, realized equity, and adaptive position sizing. It is designed to support any number of future methodologies - beginning with BMD .
The Bear Market Defender is here to hedge out commonly long biased portfolio allocations in the Crypto market, specializing in bringing uncorrelated returns during periods of sideways price action on Bitcoin, or whole-market downturns.
Together, STAR + BMD deliver a scalable, volatility tuned system that prioritizes capital preservation, signal accuracy, and adaptive risk allocation. Whether deployed standalone or within a broader portfolio, this framework is engineered for high performance, longevity, and adaptability in the ever-evolving crypto landscape.

Rolling Z-Score Trend [QuantAlgo]🟢 Overview
The Rolling Z-Score Trend measures how far the current price deviates from its rolling mean in terms of standard deviations. It transforms price data into standardized scores to identify overbought and oversold conditions while tracking momentum shifts.
The indicator displays a Z-Score line showing price deviation from statistical norms, with background momentum columns showing the rate of change in these deviations. This helps traders and investors identify mean reversion opportunities and momentum shifts across different asset classes and timeframes.
🟢 How It Works
The indicator uses the Z-Score formula: Z = (X - μ) / σ, where X is the current closing price, μ is the rolling mean, and σ is the rolling standard deviation over a user-defined lookback period. This creates a dynamic baseline that adapts to changing market conditions and standardizes price movements for interpretation across different assets and volatility conditions. The raw Z-Score undergoes 3-period EMA smoothing to reduce noise while maintaining responsiveness to market signals.
Beyond the basic Z-Score calculation, the indicator measures the rate of change in Z-Score values between successive bars, displayed as background momentum columns. This momentum component shows acceleration and deceleration of statistical deviations. All calculations are processed through confirmation filters, displaying signals only on confirmed bars to reduce premature signals based on incomplete price action.
🟢 How to Use
1. Z-Score Interpretation and Threshold Zones
Positive Values (Above Zero) : Price trading above statistical mean, suggesting bullish momentum or potential overbought conditions
Negative Values (Below Zero) : Price trading below statistical mean, suggesting bearish momentum or potential oversold conditions
Zero Line Crosses : Signal transitions between statistical regimes and potential trend changes
Upper Threshold Zone : Area above entry threshold (default 1.5) indicating potential overbought conditions
Lower Threshold Zone : Area below negative entry threshold (default -1.5) indicating potential oversold conditions
Extreme Values (±2.0 or higher) : Statistically significant deviations that may indicate reversal opportunities
2. Momentum Background Analysis and Info Table
Green Columns : Accelerating positive momentum in Z-Score values
Red Columns : Accelerating negative momentum in Z-Score values
Column Height : Magnitude of momentum change between bars
Momentum Divergence : When columns contradict primary Z-Score direction, often signals impending reversals
Info Table : Displays real-time numerical values for both Z-Score and momentum, including trend direction indicators and bar-to-bar change calculations for position management
3. Preconfigured Settings
Default : Balanced performance across multiple timeframes and asset classes for general trading and medium-term position management.
Scalping : Responsive setup for ultra-short-term trading on 1-15 minute charts with frequent signals and increased sensitivity to quick price movements.
Swing Trading : Optimized for multi-day positions with noise filtering, focusing on larger price swings. Most effective on 1-4 hour and daily timeframes.
Trend Following : Maximum smoothing that prioritizes established trends over short-term volatility. Generates fewer signals for daily and weekly charts.

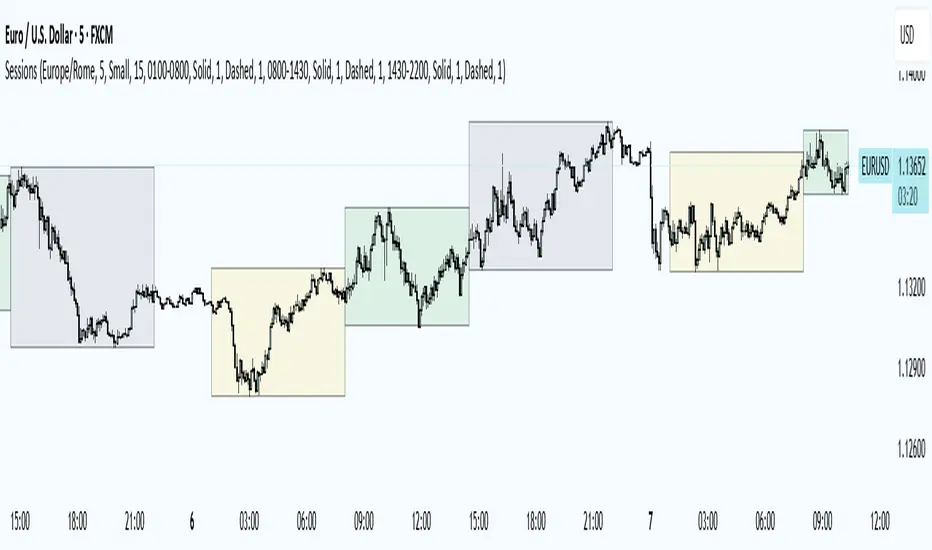
Session Status Table📌 Session Status Table
Session Status Table is an indicator that displays the real-time status of the four major trading sessions:
* 🇯🇵 Asia (Tokyo)
* 🇬🇧 London
* 🇺🇸 New York AM
* 🇺🇸 New York PM
It shows which sessions are currently open, how much time remains until they open or close, and optionally sends alerts in advance.
🧩 Features:
* Real-time session table — shows the status of each session on the chart.
* Color-coded statuses:
* 🟢 Green – Session is open
* 🔴 Red – Session is closed
* ⚪ Gray – Weekend
* Countdown timers until session open or close.
* User alerts — receive a notification a custom number of minutes before a session starts.
⚙️ Customization:
* Table position — fully configurable.
* Session colors — customizable for open, closed, and weekend states.
* Session labels — customizable with icons.
* Notifications:
* Enabled through TradingView's Alerts panel.
* User-defined lead time before session opens.
🕒 Time Zones:
All times are calculated in UTC to ensure consistency across different markets and regions, avoiding discrepancies from time zones and daylight saving time.
🚨 How to enable alerts:
1. Open the "Alerts" panel in TradingView.
2. Click "Create Alert".
3. In the condition dropdown, choose "Session Status Table".
4. Set to any alert() trigger.
5. Save — you'll be notified a set number of minutes before each session begins.
ℹ️ Technical Notes:
* Built with Pine Script version 6.
* Logically divided into clear sections: inputs, session calculations, table rendering, and alerts.
* Optimized for performance and reliability on all timeframes.
Ideal for traders who use session activity in their strategies — especially in Forex, crypto, and futures markets.

Correlation MA – 15 Assets + Average (Optional)This indicator calculates the moving average of the correlation coefficient between your charted asset and up to 15 user-selected symbols. It helps identify uncorrelated or inversely correlated assets for diversification, pair trading, or hedging.
Features:
✅ Compare your current chart against up to 15 assets
✅ Toggle assets on/off individually
✅ Custom correlation and MA lengths
✅ Real-time average correlation line across enabled assets
✅ Horizontal lines at +1, 0, and -1 for easy visual reference
Ideal for:
Portfolio diversification analysis
Finding low-correlation stocks
Mean-reversion & pair trading setups
Crypto, equities, ETFs
To use: set the benchmark chart (e.g. TSLA), choose up to 15 assets, and adjust settings as needed. Look for assets with correlation near 0 or negative values for uncorrelated performance.

Arnaud Legoux Trend Aggregator | Lyro RSArnaud Legoux Trend Aggregator
Introduction
Arnaud Legoux Trend Aggregator is a custom-built trend analysis tool that blends classic market oscillators with advanced normalization, advanced math functions and Arnaud Legoux smoothing. Unlike conventional indicators, 𝓐𝓛𝓣𝓐 aggregates market momentum, volatility and trend strength.
Signal Insight
The 𝓐𝓛𝓣𝓐 line visually reflects the aggregated directional bias. A rise above the middle line threshold signals bullish strength, while a drop below the middle line indicates bearish momentum.
Another way to interpret the 𝓐𝓛𝓣𝓐 is through overbought and oversold conditions. When the 𝓐𝓛𝓣𝓐 rises above the +0.7 threshold, it suggests an overbought market and signals a strong uptrend. Conversely, a drop below the -0.7 level indicates an oversold condition and a strong downtrend.
When the oscillator hovers near the zero line, especially within the neutral ±0.3 band, it suggests that no single directional force is dominating—common during consolidation phases or pre-breakout compression.
Real-World Example
Usually 𝓐𝓛𝓣𝓐 is used by following the bar color for simple signals; however, like most indicators there are unique ways to use an indicator. Let’s dive deep into such ways.
The market begins with a green bar color, raising awareness for a potential long setup—but not a direct entry. In this methodology, bar coloring serves as an alert mechanism rather than a strict entry trigger.
The first long position was initiated when the 𝓐𝓛𝓣𝓐 signal line crossed above the +0.3 threshold, suggesting a shift in directional acceleration. This entry coincided with a rising price movement, validating the trade.
As price advanced, the position was exited into cash—not reversed into a short—because the short criteria for this use case are distinct. The exit was prompted by 𝓐𝓛𝓣𝓐 crossing back below the +0.3 level, signaling the potential weakening of the long trend.
Later, as 𝓐𝓛𝓣𝓐 crossed below 0, attention shifted toward short opportunities. A short entry was confirmed when 𝓐𝓛𝓣𝓐 dipped below -0.3, indicating growing downside momentum. The position was eventually closed when 𝓐𝓛𝓣𝓐 crossed back above the -0.3 boundary—signaling a possible deceleration of the bearish move.
This logic was consistently applied in subsequent setups, emphasizing the role of 𝓐𝓛𝓣𝓐’s thresholds in guiding both entries and exits.
Framework
The Arnaud Legoux Trend Aggregator (ALTA) combines multiple technical indicators into a single smoothed signal. It uses RSI, MACD, Bollinger Bands, Stochastic Momentum Index, and ATR.
Each indicator's output is normalized to a common scale to eliminate bias and ensure consistency. These normalized values are then transformed using a hyperbolic tangent function (Tanh).
The final score is refined with a custom Arnaud Legoux Moving Average (ALMA) function, which offers responsive smoothing that adapts quickly to price changes. This results in a clear signal that reacts efficiently to shifting market conditions.
⚠️ WARNING ⚠️: THIS INDICATOR, OR ANY OTHER WE (LYRO RS) PUBLISH, IS NOT FINANCIAL OR INVESTMENT ADVICE. EVERY INDICATOR SHOULD BE COMBINED WITH PRICE ACTION, FUNDAMENTALS, OTHER TECHNICAL ANALYSIS TOOLS & PROPER RISK. MANAGEMENT.

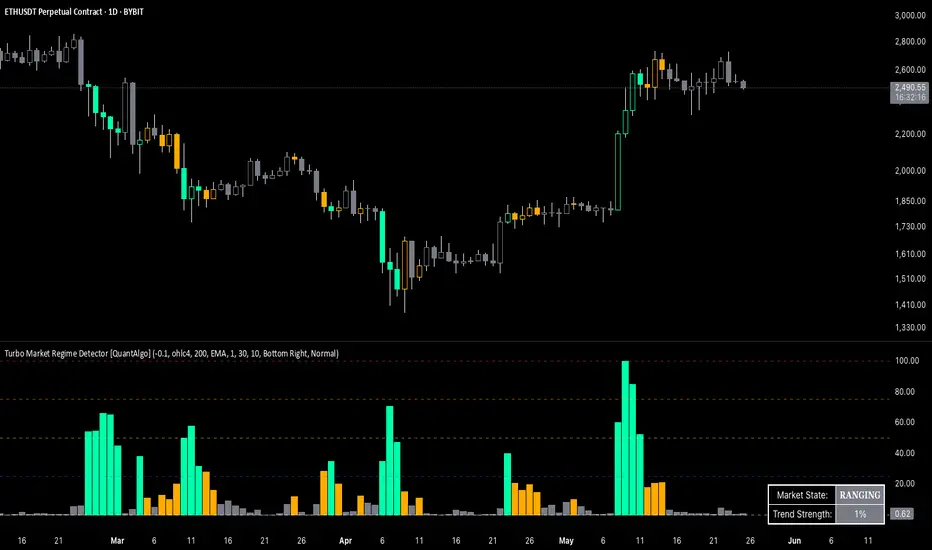
Turbo Market Regime Detector [QuantAlgo]The Turbo Market Regime Detector is a market state classification system that combines volatility-adaptive filtering with slope analysis to identify and categorize market regimes. It helps traders and investors distinguish between trending and ranging market conditions across different timeframes and asset classes.
🟢 Technical Foundation
The Turbo Market Regime Detector employs a multi-layered analytical approach to market regime identification, incorporating:
Volatility-Adaptive Regime Filter (VARF) : Uses dynamic alpha calculation based on price volatility and range to create an adaptive filter that responds to changing market conditions
Slope Analysis : Calculates the absolute slope of the VARF curve and applies customizable moving average smoothing to determine trend strength and market regime classification
Normalized Histogram : Transforms raw slope data into percentage-based metrics (0-100%) for interpretation of market conditions
Multi-Threshold Classification System : Implements user-defined thresholds to categorize markets into Strong Trend, Weak Trend, and Ranging regimes
The indicator processes price data through mathematical operations including volatility adjustment, slope normalization, and statistical range analysis. This creates a regime detection system that adapts to market volatility while maintaining classification consistency across different timeframes and asset classes.
🟢 Key Features & Signals
1. Market Regime Classification
The indicator presents market conditions through a normalized histogram that distinguishes between three distinct market states:
1/ Strong Trend Regime: When the histogram exceeds the strong trend threshold (default 30%), indicating directional market movement with sustained momentum
2/ Weak Trend Regime: When the histogram falls between weak trend (default 10%) and strong trend thresholds, representing transitional market conditions with moderate directional bias
3/ Ranging Regime: When the histogram remains below the weak trend threshold, signaling consolidation periods with limited directional movement
This classification system provides insights into:
→ Current market state with percentage-based quantification
→ Regime transitions and their timing
→ Market momentum strength across different timeframes
2. Visual Feedback System
The indicator features multiple visualization options for market analysis:
Background Coloring: Optional chart background coloring that applies regime-based colors to both the indicator pane and main price chart for visual context
Bar Coloring: Price bar coloring based on current market regime, providing visual feedback on market conditions
Reference Lines: Horizontal reference lines at 25%, 50%, 75%, and 100% levels for percentage assessment and historical comparison
Information Table: Real-time status display showing current market state and trend strength percentage with customizable positioning and sizing options
3. Alert and Notification System
The indicator generates alerts for regime transitions:
State Change Alerts: Notifications triggered when the market transitions between regime states (Strong Trend ↔ Weak Trend ↔ Ranging)
Specific Regime Entry Alerts: Individual alert conditions for entering Strong Trend, Weak Trend, or Ranging regimes for targeted trading strategies
Customizable Alert Messages: Pre-formatted alert messages including exchange and ticker information for context and decision-making
🟢 Practical Usage Guidelines
→ Regime-Based Strategy Selection: Use the indicator to identify potential trading strategies - trend-following during Strong Trend regimes, mean-reversion during Ranging periods, and adjusted position sizing during Weak Trend transitions
→ Multi-Timeframe Analysis: Apply the indicator across different timeframes to understand market regime hierarchy and identify confluence between short-term and long-term market states
→ Threshold Optimization: Adjust regime thresholds based on market volatility and asset characteristics - lower thresholds for more sensitive regime detection, higher thresholds for more definitive regime changes
🟢 Configuration Tips
VARF settings optimization:
→ Lower thresholds (-0.3 to -0.5) for more responsive regime detection in volatile markets
→ Higher thresholds (-0.1 to 0.1) for smoother signals in stable market conditions
→ Enable adaptive VARF for automatic volatility adjustment across different market cycles
Slope analysis parameter tuning:
→ Shorter MA lengths (100-200) for faster regime transition signals
→ Longer MA lengths (300-500) for more stable regime identification
→ Adjust sensitivity multiplier based on desired responsiveness vs. stability balance
Regime interpretation framework:
→ Strong Trend regimes for momentum-based strategies and trend following
→ Ranging regimes for mean-reversion and support/resistance trading
→ Weak Trend periods for reduced position sizing and cautious market approach
Complementary analysis integration:
→ Volume analysis for regime change confirmation
→ Support/resistance levels for entry/exit timing within regime contexts
→ Price action patterns for validation of regime-based trading decisions
→ Economic calendar events that may influence regime transitions
FVG Candle HighlighterThis indicator highlights only the true Fair Value Gap (FVG) creator candle — the middle candle in a 3-bar FVG formation — with zero clutter.
🔹 Bullish FVG: Candle is colored if price gaps above the high two bars back
🔹 Bearish FVG: Candle is colored if price gaps below the low two bars back
✨ No boxes. No zones. Just pure, visual price-action accuracy.
🔧 Powered by Pine Script v6
🧠 Based on institutional-style FVG logic
🎯 Ideal for Smart Money / ICT / Order Block strategies

TLC sessionA Professional Intraday Session Tracker with VWAP and Economic Event Integration
Description
This indicator provides visual tracking of major trading sessions (Asian, London, New York) combined with VWAP calculations and macroeconomic event zones. It's designed for intraday traders who need to monitor session overlaps, liquidity periods, and high-impact news events.
The basic script of trading sessions was taken as a basis and refined for greater convenience.
Key Features:
Customizable Session Tracking: Visualize up to 3 trading sessions with adjustable time zones (supports IANA & GMT formats)
Dynamic VWAP Integration: Built-in Volume-Weighted Average Price calculation
Macro Event Zones: Highlights key economic announcement windows (adjustable for summer/winter time)
Price Action Visualization: Displays open/close prices, session ranges, and average price levels
Automatic DST Adjustment: Uses IANA timezone database for daylight savings awareness
How It Works
1. Trading Session Detection
Three fully configurable sessions (e.g., Asia, London, New York)
Each session displays:
Colored background zone
Opening price (dashed line)
Closing price (dashed line)
Average price (dotted line)
Optional label with session name
2. VWAP Calculation
Standard Volume-Weighted Average Price plotted as circled line
Helps identify fair value within each session
3. Macro Event Zones
Special highlighted period for economic news releases
Automatically adjusts for summer/winter time
Default set to 1000-1200 (summer) or 0900-1100 (winter) GMT-5 (US session open)
Why This Indicator is Unique
Multi-Session Awareness
Unlike simple session indicators, this tool:
Tracks price development within each session
Shows session overlaps (critical for volatility periods)
Maintains separate VWAP calculations across sessions
Professional-Grade Features
IANA timezone support (automatic DST handling)
Customizable visual elements (toggle labels, ranges, averages)
Object-based architecture (clean, efficient rendering)
News event integration (helps avoid trading during high-impact releases)
Usage Recommendations
Best Timeframes
1-minute to 1-hour charts (intraday focus)
Not recommended for daily+ timeframes
Trading Applications
1. Session Breakout Strategy: Trade breakouts when London/New York sessions open
2. VWAP Reversion: Fade moves that deviate too far from VWAP
3. News Avoidance: Reduce position sizing during macro event windows
Visual Example
Asian session (red)
London session (blue)
New York session (purple)
Macro event zone (white)
VWAP line (gold circles)
The basic script of trading sessions was taken as a basis and refined for greater convenience.

Hybrid Momentum Suite [QuantAlgo]The Hybrid Momentum Suite is an advanced momentum-based technical indicator that utilizes a weighted fusion of RSI and CCI, combined with adaptive boundary detection to help traders and investors identify momentum strength and potential reversal zones across different timeframes and asset classes.
🟢 Technical Foundation
The Hybrid Momentum Suite employs a dual-component approach to momentum analysis, incorporating:
Hybrid RSI-CCI Calculation: Uses a customizable ratio for momentum signature creation, allowing traders and investors to balance the characteristics of both indicators
Bi-Directional Component Separation: Automatically separates unified momentum into distinct bullish and bearish forces for independent analysis
Adaptive Impulse Boundary: Uses exponential moving average combined with standard deviation multipliers to detect momentum exhaustion zones
Multi-Level Gradient Visualization: Applies sophisticated layering with varying transparency to show momentum strength and direction changes
The indicator processes price data through multiple filtering stages, applying mathematical principles including weighted averaging, component isolation, and statistical variance analysis. This creates a momentum system that adapts to market volatility while maintaining clarity in directional bias and strength quantification.
🟢 Key Features & Signals
1. Bi-Directional Component Separation
The indicator presents momentum through mathematically isolated histograms that separate bullish and bearish forces for independent analysis.
When bullish momentum is dominant, the bullish component (green) shows greater amplitude than the bearish component.
Similarly, when bearish momentum is dominant, the bearish component (red) shows greater amplitude than the bullish component.
During transitional periods, components may show equal strength, indicating momentum equilibrium.
This visualization provides immediate insights into:
→ Competing market forces simultaneously
→ Momentum exhaustion before reversals
→ Quantified momentum strength across different timeframes
2. Real-Time Status Update
The indicator features a comprehensive analysis dashboard that operates with dynamic strength classification:
The dashboard automatically categorizes momentum from "Very Weak" to "Very Strong" based on component amplitude.
Historical comparison displays previous bar metrics for trend analysis, helping traders and investors understand momentum persistence.
Color-coded visualization matches histogram components for immediate recognition of market bias.
Adaptive positioning offers nine customizable table locations for optimal display across different chart layouts.
Regardless of position, the dashboard displays:
Current momentum direction (BULLISH or BEARISH)
Momentum strength percentage (0-100%)
Previous bar comparison for trend persistence
Active component colors for visual consistency
This comprehensive approach helps traders and investors:
→ Assess current momentum strength quantitatively
→ Identify momentum shifts through historical comparison
→ Make informed decisions based on momentum context
3. Reversal Signal Detection System
The indicator generates trading signals using advanced multi-factor validation:
Exhaustion signals are detected when components cross down after exceeding statistical boundaries, indicating potential momentum reversals.
Trend flip alerts are generated when component dominance changes (bull>bear or bear>bull), signaling directional shifts.
Boundary interaction monitoring tracks crossovers above/below impulse threshold for extreme momentum identification.
Visual markers ( X ) are positioned using mathematical placement algorithms for clear signal identification.
The indicator also features a comprehensive alert system with notifications for:
Bullish potential reversals
Bearish potential reversals
Trend flip signals
Momentum boundary crossings
*Alerts can be customized and delivered through TradingView's notification system, making it easy to stay informed of important momentum developments even when away from the charts.
4. Conditional Bar Coloring
The indicator provides optional price bar coloring based on momentum analysis:
Bars are colored based on dominant momentum component (bullish/bearish).
Reversal conditions are highlighted with specialized coloring (default orange).
Color transparency adjusts based on momentum strength for immediate visual feedback.
Bar coloring can be toggled on/off to suit different chart aesthetics and personal preferences.
🟢 Practical Usage Tips
→ Component Analysis and Interpretation: The indicator visualizes momentum direction and strength through separate components, allowing traders to immediately identify dominant market forces. This helps in assessing potential for continuation or reversal.
→ Signal Generation Strategies: The indicator generates potential trading signals based on component crossovers, boundary violations, and momentum exhaustion. Users can focus on reversal signals at statistical extremes or trend-following signals during component dominance.
→ Multi-Component Assessment: Through its bi-directional approach, the indicator enables users to understand competing forces within the same timeframe. This helps in identifying momentum equilibrium and potential turning points.
🟢 Pro Tips
Adjust RSI/CCI ratio based on market conditions:
→ High ratios (70-100) for mean-reverting markets and longer timeframes
→ Low ratios (0-30) for trending markets and shorter timeframes
→ Default 50/50 for balanced momentum assessment across market types
Fine-tune impulse boundary based on volatility:
→ Lower boundary lengths (20-30) for more frequent reversal signals
→ Higher lengths (40-60) for only major momentum extremes
→ Adjust standard deviation multiplier (2.0-4.0) based on market volatility
Look for confluence between components:
→ Component divergence as early reversal warning
→ Simultaneous extreme readings for high-probability setups
→ Component correlation with price for confirmation
Use for multiple trading approaches:
→ Reversal trading at component extremes near impulse boundary
→ Trend following when components show clear dominance
→ Early momentum shift detection with gradient fading patterns
→ Position sizing based on component strength percentage
Combine with:
→ Support/resistance analysis for strategic entry and exit points
→ Volume indicators for momentum validation
→ Multiple timeframe analysis for broader market context
→ Price action patterns for confirmation of reversal signals

Suvorov Pro SFP+Indicator: Logic-based Swing Failure Pattern (SFP)
What is the logic of my indicator based on and what makes it unique:
1. The indicator can calculate extreme candles that close with huge shadows and a small body and it works on any timeframe.
2. The indicator analyzes the volumes on which the desired bar was closed. This function is customizable. That is, you can build a search for signals according to your trading strategy, based on the number of volumes. What does this mean - you select the number of previous bars where the indicator calculates the average value and based on these numbers, you can set up: how many times the desired candle should be larger than the previous average volume.
3. Since SFP is based on the removal of important liquidity, the search for such situations occurs from swing structures (swing high/low). When these parameters are found on the chart (on history), the indicator draws the situation and shows where important liquidity was removed and why the trading situation appeared right now.
4. The indicator gives recommendations on possible takes and stops.
The structure of takes has a built-in logic for searching for previous swings to remove liquidity, as well as searching for imbalances to cover them (50 and 100%).
5. For TP (Take Profit): there are 3 TPthat can be adjusted to your trading strategy (Risk/Profit). For example: you always trade from 2 to 1 on the 1st Take, 3 to 1 on the second, 5 to 1 on the third: you can set all this in the indicator and all your targets will be detected by the indicator, taking into account the logic of searching for important ranges. If, for example, in your 3 to 1 range there are no important zones for TP, then the indicator writes that NaN (not found).
6. The indicator works on any timeframe.
7. The indicator has a built-in RSI logic, which comes as an additional function to the indicator. If this function is enabled, then trading situations are detected only when there is a divergence (from the swing point to the extreme bar that has formed).

Trading Sessions
Trading Sessions
Highlights the Asia, London, and New York trading sessions with dynamic High-Low boxes.
General
Timezone : select your reference zone (e.g. Exchange, UTC, Europe/Rome, America/New_York).
Extend Session High/Low : extend the High/Low lines to the last candle.
Extend Lines (bars) : number of bars to extend lines beyond the last candle (0–100, default 15).
Show High/Low Labels : display labels for the High/Low levels.
Show Mitigated Levels : also show mitigated (broken) levels.
Show Only Recent Levels : filter levels from the last N days.
Number of Recent Days : sets how many days are considered “recent” (1–30).
Show Debug Info : enable a panel with current time, session status, and active filters.
Sessions
Asia , London , New York : enable or disable each session.
Session Time : set the start/end times with the time picker.
Box Color : choose a semi-transparent highlight color for each session.
Line Style & Width : customize style (Solid, Dotted, Dashed) and width of current and past High/Low lines.
Text Size : select the label text size (Tiny, Small, Normal, Large).
Show Only Recent Levels – filters High/Low lines to show only those from the last Number of Recent Days .
Number of Recent Days – sets how many days are considered “recent” for the filter.
Show Mitigated Levels – enables display of broken levels; otherwise only active levels remain visible.
Show High/Low Labels – toggles text labels at the ends of lines on or off.
Show Debug Info – displays a floating panel showing:
Current time in the selected timezone
On/Off status of Asia, London, NY sessions
Active filters (recent days, mitigated levels)
Line style settings for each session
Key Benefits
Visualize session-specific volatility and potential breakouts.
No historical limit: scroll back through any past sessions.
Filter and extend High/Low levels for precise price context.
Fully customize to fit any chart layout.
Ideal For
Intraday traders who need clear session boundaries and price level context.
Bitcoin Monthly Seasonality [Alpha Extract]The Bitcoin Monthly Seasonality indicator analyzes historical Bitcoin price performance across different months of the year, enabling traders to identify seasonal patterns and potential trading opportunities. This tool helps traders:
Visualize which months historically perform best and worst for Bitcoin.
Track average returns and win rates for each month of the year.
Identify seasonal patterns to enhance trading strategies.
Compare cumulative or individual monthly performance.
🔶 CALCULATION
The indicator processes historical Bitcoin price data to calculate monthly performance metrics
Monthly Return Calculation
Inputs:
Monthly open and close prices.
User-defined lookback period (1-15 years).
Return Types:
Percentage: (monthEndPrice / monthStartPrice - 1) × 100
Price: monthEndPrice - monthStartPrice
Statistical Measures
Monthly Averages: ◦ Average return for each month calculated from historical data.
Win Rate: ◦ Percentage of positive returns for each month.
Best/Worst Detection: ◦ Identifies months with highest and lowest average returns.
Cumulative Option
Standard View: Shows discrete monthly performance.
Cumulative View: Shows compounding effect of consecutive months.
Example Calculation (Pine Script):
monthReturn = returnType == "Percentage" ?
(monthEndPrice / monthStartPrice - 1) * 100 :
monthEndPrice - monthStartPrice
calcWinRate(arr) =>
winCount = 0
totalCount = array.size(arr)
if totalCount > 0
for i = 0 to totalCount - 1
if array.get(arr, i) > 0
winCount += 1
(winCount / totalCount) * 100
else
0.0
🔶 DETAILS
Visual Features
Monthly Performance Bars: ◦ Color-coded bars (teal for positive, red for negative returns). ◦ Special highlighting for best (yellow) and worst (fuchsia) months.
Optional Trend Line: ◦ Shows continuous performance across months.
Monthly Axis Labels: ◦ Clear month names for easy reference.
Statistics Table: ◦ Comprehensive view of monthly performance metrics. ◦ Color-coded rows based on performance.
Interpretation
Strong Positive Months: Historically bullish periods for Bitcoin.
Strong Negative Months: Historically bearish periods for Bitcoin.
Win Rate Analysis: Higher win rates indicate more consistently positive months.
Pattern Recognition: Identify recurring seasonal patterns across years.
Best/Worst Identification: Quickly spot the historically strongest and weakest months.
🔶 EXAMPLES
The indicator helps identify key seasonal patterns
Bullish Seasons: Visualize historically strong months where Bitcoin tends to perform well, allowing traders to align long positions with favorable seasonality.
Bearish Seasons: Identify historically weak months where Bitcoin tends to underperform, helping traders avoid unfavorable periods or consider short positions.
Seasonal Strategy Development: Create trading strategies that capitalize on recurring monthly patterns, such as entering positions in historically strong months and reducing exposure during weak months.
Year-to-Year Comparison: Assess how current year performance compares to historical seasonal patterns to identify anomalies or confirmation of trends.
🔶 SETTINGS
Customization Options
Lookback Period: Adjust the number of years (1-15) used for historical analysis.
Return Type: Choose between percentage returns or absolute price changes.
Cumulative Option: Toggle between discrete monthly performance or cumulative effect.
Visual Style Options: Bar Display: Enable/disable and customize colors for positive/negative bars, Line Display: Enable/disable and customize colors for trend line, Axes Display: Show/hide reference axes.
Visual Enhancement: Best/Worst Month Highlighting: Toggle special highlighting of extreme months, Custom highlight colors for best and worst performing months.
The Bitcoin Monthly Seasonality indicator provides traders with valuable insights into Bitcoin's historical performance patterns throughout the year, helping to identify potentially favorable and unfavorable trading periods based on seasonal tendencies.

Compression Patterns (w/ Trend + Proximity Filter)🧠 Description:
This indicator identifies high-probability price compression patterns within trending environments — a setup prized by experienced swing and day traders alike. It combines the classic NR4, NR7, 2-Bar NR, 3-Bar NR, and Inside Day formations with a powerful trend filter and proximity logic to deliver clear, focused signals.
🔍 What's Inside:
▪️ Compression Patterns
The core of this tool lies in the logic of price compression. These patterns signal the market taking a breath — volatility contracts, volume dries up, and price coils like a spring.
When this happens in the right context, the next move is often explosive.
NR4 / NR7: Narrowest range in 4 or 7 bars — excellent for spotting the quiet before the storm.
2-Bar NR / 3-Bar NR: These identify the tightest consecutive 2 or 3-day ranges over the past 20 days — contextually rare and powerful.
Inside Day: A simple but highly effective consolidation pattern, especially when it clusters around key moving averages.
▪️ Trend Filter (EMA Stack)
You could say this is where most indicators fall apart — no context.
This one doesn’t make that mistake.
Signals only fire when the 10 EMA > 20 EMA > 50 EMA, and price is above the 20 EMA. That’s a strong, established uptrend — the only environment where breakouts are statistically favourable.
Why?
Because trend following works.
It may not give you fixed daily returns, but it’s the only strategy with theoretically infinite profit potential. You risk little, trade less, and position yourself for rare but massive moves. That’s the edge.
▪️ Proximity Filter (1 ATR to EMA)
We’ve added another layer of discipline. Signals only fire when price is:
Within 1 ATR of the 10 EMA (if price is above it), or
Within 1 ATR of the 20 EMA (if price is below the 10 EMA)
This ensures you’re not chasing. You’re waiting for tight, controlled pullbacks into dynamic support — exactly where institutions add size, not exit.
⚙️ Fully Customisable:
Toggle visibility of each pattern
Custom colours and transparency for label & background
Adjustable ATR length and multiplier
Change label text if needed (useful for translations or tweaks)
🎯 Ideal Use Case:
Swing trading off the daily chart
Day trading with VWAP/MACD filters (in alternate versions)
Supplementing price action strategies
🔚 Final Word:
This isn’t an “everything scanner.”
It’s a discerning sniper scope for traders who wait patiently for clean trends, tight consolidations, and perfect proximity — then strike.

Triad Macro Gauge__________________________________________________________________________________
Introduction
__________________________________________________________________________________
The Triad Macro Gauge (TMG) is designed to provide traders with a comprehensive view of the macroeconomic environment impacting financial markets. By synthesizing three critical market signals— VIX (volatility) , Credit Spreads (credit risk) , and the Stocks/Bonds Ratio (SPY/TLT) —this indicator offers a probabilistic assessment of market sentiment, helping traders identify bullish or bearish macro conditions.
Holistic Macro Analysis: Combines three distinct macroeconomic indicators for multi-dimensional insights.
Customization & Flexibility: Adjust weights, thresholds, lookback periods, and visualization styles.
Visual Clarity: Dynamic table, color-coded plots, and anomaly markers for quick interpretation.
Fully Consistent Scores: Identical values across all timeframes (4H, daily, weekly).
Actionable Signals: Clear bull/bear thresholds and volatility spike detection.
Optimized for timeframes ranging from 4 hour to 1 week , the TMG equips swing traders and long-term investors with a robust tool to navigate macroeconomic trends.
__________________________________________________________________________________
Key Indicators
__________________________________________________________________________________
VIX (CBOE:VIX): Measures market volatility (negatively weighted for bearish signals).
Credit Spreads (FRED:BAMLH0A0HYM2EY): Tracks high-yield bond spreads (negatively weighted).
Stocks/Bonds Ratio (SPY/TLT): Evaluates equity sentiment relative to treasuries (positively weighted).
__________________________________________________________________________________
Originality and Purpose
__________________________________________________________________________________
The TMG stands out by combining VIX, Credit Spreads, and SPY/TLT into a single, cohesive indicator. Its unique strength lies in its fully consistent scores across all timeframes, a critical feature for multi-timeframe analysis.
Purpose: To empower traders with a clear, actionable tool to:
Assess macro conditions
Spot market extremes
Anticipate reversals
__________________________________________________________________________________
How It Works
__________________________________________________________________________________
VIX Z-Score: Measures volatility deviations (inverted for bearish signals).
Credit Z-Score: Tracks credit spread deviations (inverted for bearish signals).
Ratio Z-Score: Assesses SPY/TLT strength (positively weighted for bullish signals).
TMG Score: Weighted composite of z-scores (bullish > +0.30, bearish < -0.30).
Anomaly Detection: Identifies extreme volatility spikes (z-score > 3.0).
All calculations are performed using daily data, ensuring that scores remain consistent across all chart timeframes.
__________________________________________________________________________________
Visualization & Interpretation
__________________________________________________________________________________
The script visualizes data through:
A dynamic table displaying TMG Score , VIX Z, Credit Z, Ratio Z, and Anomaly status, with color gradients (green for positive, red for negative, gray for neutral/N/A).
A plotted TMG Score in Area, Histogram, or Line mode , with adaptive opacity for clarity.
Bull/Bear thresholds as horizontal lines (+0.30/-0.30) to signal market conditions.
Anomaly markers (orange circles) for volatility spikes.
Crossover signals (triangles) for bull/bear threshold crossings.
The table provides an immediate snapshot of macro conditions, while the plot offers a visual trend analysis. All values are consistent across timeframes, simplifying multi-timeframe analysis.
__________________________________________________________________________________
Script Parameters
__________________________________________________________________________________
Extensive customization options:
Symbol Selection: Customize VIX, Credit Spreads, SPY, TLT symbols
Core Parameters: Adjust lookback periods, weights, smoothing
Anomaly Detection: Enable/disable with custom thresholds
Visual Style: Choose display modes and colors
__________________________________________________________________________________
Conclusion
__________________________________________________________________________________
The Triad Macro Gauge by Ox_kali is a cutting-edge tool for analyzing macroeconomic trends. By integrating VIX, Credit Spreads, and SPY/TLT, TMG provides traders with a clear, consistent, and actionable gauge of market sentiment.
Recommended for: Swing traders and long-term investors seeking to navigate macro-driven markets.
__________________________________________________________________________________
Credit & Inspiration
__________________________________________________________________________________
Special thanks to Caleb Franzen for his pioneering work on macroeconomic indicator blends – his research directly inspired the core framework of this tool.
__________________________________________________________________________________
Notes & Disclaimer
__________________________________________________________________________________
This is the initial public release (v2.5.9). Future updates may include additional features based on user feedback.
Please note that the Triad Macro Gauge is not a guarantee of future market performance and should be used with proper risk management. Past performance is not indicative of future results.

Aurora Flow Oscillator [QuantAlgo]The Aurora Flow Oscillator is an advanced momentum-based technical indicator designed to identify market direction, momentum shifts, and potential reversal zones using adaptive filtering techniques. It visualizes price momentum through a dynamic oscillator that quantifies trend strength and direction, helping traders and investors recognize momentum shifts and trading opportunities across various timeframes and asset class.
🟢 Technical Foundation
The Aurora Flow Oscillator employs a sophisticated mathematical approach with adaptive momentum filtering to analyze market conditions, including:
Price-Based Momentum Calculation: Calculates logarithmic price changes to measure the rate and magnitude of market movement
Adaptive Momentum Filtering: Applies an advanced filtering algorithm to smooth momentum calculations while preserving important signals
Acceleration Analysis: Incorporates momentum acceleration to identify shifts in market direction before they become obvious
Signal Normalization: Automatically scales the oscillator output to a range between -100 and 100 for consistent interpretation across different market conditions
The indicator processes price data through multiple filtering stages, applying mathematical principles including exponential smoothing with adaptive coefficients. This creates an oscillator that dynamically adjusts to market volatility while maintaining responsiveness to genuine trend changes.
🟢 Key Features & Signals
1. Momentum Flow and Extreme Zone Identification
The oscillator presents market momentum through an intuitive visual display that clearly indicates both direction and strength:
Above Zero: Indicates positive momentum and potential bullish conditions
Below Zero: Indicates negative momentum and potential bearish conditions
Slope Direction: The angle and direction of the oscillator provide immediate insight into momentum strength
Zero Line Crossings: Signal potential trend changes and new directional momentum
The indicator also identifies potential overbought and oversold market conditions through extreme zone markings:
Upper Zone (>50): Indicates strong bullish momentum that may be approaching exhaustion
Lower Zone (<-50): Indicates strong bearish momentum that may be approaching exhaustion
Extreme Boundaries (±95): Mark potentially unsustainable momentum levels where reversals become increasingly likely
These zones are displayed with gradient intensity that increases as the oscillator moves toward extremes, helping traders and investors:
→ Identify potential reversal zones
→ Determine appropriate entry and exit points
→ Gauge overall market sentiment strength
2. Customizable Trading Style Presets
The Aurora Flow Oscillator offers pre-configured settings for different trading approaches:
Default (80,150): Balanced configuration suitable for most trading and investing situations.
Scalping (5,80): Highly responsive settings for ultra-short-term trades. Generates frequent signals and catches quick price movements. Best for 1-15min charts when making many trades per day.
Day Trading (8,120): Optimized for intraday movements with faster response than default settings while maintaining reasonable signal quality. Ideal for 5-60min or 4h-12h timeframes.
Swing Trading (10,200): Designed for multi-day positions with stronger noise filtering. Focuses on capturing larger price swings while avoiding minor fluctuations. Works best on 1-4h and daily charts.
Position Trading (14,250): For longer-term position traders/investors seeking significant market trends. Reduces false signals by heavily filtering market noise. Ideal for daily or even weekly charts.
Trend Following (16,300): Maximum smoothing that prioritizes established directional movements over short-term fluctuations. Best used on daily and weekly charts, but can also be used for lower timeframe trading.
Countertrend (7,100): Tuned to detect potential reversals and exhaustion points in trends. More sensitive to momentum shifts than other presets. Effective on 15min-4h charts, as well as daily and weekly charts.
Each preset automatically adjusts internal parameters for optimal performance in the selected trading context, providing flexibility across different market approaches without requiring complex manual configuration.
🟢 Practical Usage Tips
1/ Trend Analysis and Interpretation
→ Direction Assessment: Evaluate the oscillator's position relative to zero to determine underlying momentum bias
→ Momentum Strength: Measure the oscillator's distance from zero within the -100 to +100 range to quantify momentum magnitude
→ Trend Consistency: Monitor the oscillator's path for sustained directional movement without frequent zero-line crossings
→ Reversal Detection: Watch for oscillator divergence from price and deceleration of movement when approaching extreme zones
2/ Signal Generation Strategies
Depending on your trading approach, multiple signal strategies can be employed:
Trend Following Signals:
Enter long positions when the oscillator crosses above zero
Enter short positions when the oscillator crosses below zero
Add to positions on pullbacks while maintaining the overall trend direction
Countertrend Signals:
Look for potential reversals when the oscillator reaches extreme zones (±95)
Enter contrary positions when momentum shows signs of exhaustion
Use oscillator divergence with price as additional confirmation
Momentum Shift Signals:
Enter positions when oscillator changes direction after establishing a trend
Exit positions when oscillator direction reverses against your position
Scale position size based on oscillator strength percentage
3/ Timeframe Optimization
The indicator can be effectively applied across different timeframes with these considerations:
Lower Timeframes (1-15min):
Use Scalping or Day Trading presets
Focus on quick momentum shifts and zero-line crossings
Be cautious of noise in extreme market conditions
Medium Timeframes (30min-4h):
Use Default or Swing Trading presets
Look for established trends and potential reversal zones
Combine with support/resistance analysis for entry/exit precision
Higher Timeframes (Daily+):
Use Position Trading or Trend Following presets
Focus on major trend identification and long-term positioning
Use extreme zones for position management rather than immediate reversals
🟢 Pro Tips
Price Momentum Period:
→ Lower values (5-7) increase sensitivity to minor price fluctuations but capture more market noise
→ Higher values (10-16) emphasize sustained momentum shifts at the cost of delayed response
→ Adjust based on your timeframe (lower for shorter timeframes, higher for longer timeframes)
Oscillator Filter Period:
→ Lower values (80-120) produce more frequent directional changes and earlier response to momentum shifts
→ Higher values (200-300) filter out shorter-term fluctuations to highlight dominant market cycles
→ Match to your typical holding period (shorter holding time = lower filter values)
Multi-Timeframe Analysis:
→ Compare oscillator readings across different timeframes for confluence
→ Look for alignment between higher and lower timeframe signals
→ Use higher timeframe for trend direction, lower for earlier entries
Volatility-Adaptive Trading:
→ Use oscillator strength to adjust position sizing (stronger = larger)
→ Consider reducing exposure when oscillator reaches extreme zones
→ Implement tighter stops during periods of oscillator acceleration
Combination Strategies:
→ Pair with volume indicators for confirmation of momentum shifts
→ Use with support/resistance levels for strategic entry and exit points
→ Combine with volatility indicators for comprehensive market context

Advanced Momentum Scanner [QuantAlgo]The Advanced Momentum Scanner is a sophisticated technical indicator designed to identify market momentum and trend direction using multiple exponential moving averages (EMAs), momentum metrics, and adaptive visualization techniques. It is particularly valuable for those looking to identify trading and investing opportunities based on trend changes and momentum shifts across any market and timeframe.
🟢 Technical Foundation
The Advanced Momentum Scanner utilizes a multi-layered approach with four different EMA periods to identify market momentum and trend direction:
Ultra-Fast EMA for quick trend changes detection (default: 5)
Fast EMA for short-term trend analysis (default: 10)
Mid EMA for intermediate confirmation (default: 30)
Slow EMA for long-term trend identification (default: 100)
For momentum detection, the indicator implements a Rate of Change (RoC) calculation to measure price momentum over a specified period. It further enhances analysis by incorporating RSI readings for overbought/oversold conditions, volatility measurements through ATR, and optional volume confirmation. When these elements align, the indicator generates trading signals based on the selected sensitivity mode (Conservative, Balanced, or Aggressive).
🟢 Key Features & Signals
1. Multi-Period Trend Identification
The indicator combines multiple EMAs of different lengths to provide comprehensive trend analysis within the same timeframe, displaying the information through color-coded visual elements on the chart.
When an uptrend is detected, chart elements are colored with the bullish theme color (default: green/teal).
Similarly, when a downtrend is detected, chart elements are colored with the bearish theme color (default: red).
During neutral or indecisive periods, chart elements are colored with a neutral gray color, providing clear visual distinction between trending and non-trending market conditions.
This visualization provides immediate insights into underlying trend direction without requiring separate indicators, helping traders and investors quickly identify the market's current state.
2. Trend Strength Information Panel
The trend panel operates in three different sensitivity modes (Conservative, Aggressive, and Balanced), each affecting how the indicator processes and displays market information.
The Conservative mode prioritizes trend sustainability over frequency, showing only strong trend movements with high probability.
The Aggressive mode detects early trend changes, providing more frequent signals but potentially more false positives.
The Balanced mode offers a middle ground with moderate signal frequency and reliability.
Regardless of the selected mode, the panel displays:
Current trend direction (UPTREND, DOWNTREND, or NEUTRAL)
Trend strength percentage (0-100%)
Early detection signals when applicable
The active sensitivity mode
This comprehensive approach helps traders and investors:
→ Assess the strength of current market trends
→ Identify early potential trend changes before full confirmation
→ Make more informed trading and investing decisions based on trend context
3. Customizable Visualization Settings
This indicator offers extensive visual customization options to suit different trading styles and preferences:
Display options:
→ Fully customizable uptrend, downtrend, and neutral colors
→ Color-coded price bars showing trend direction
→ Dynamic gradient bands visualizing potential trend channels
→ Optional background coloring based on trend intensity
→ Adjustable transparency levels for all visual elements
These visualization settings can be fine-tuned through the indicator's interface, allowing traders and investors to create a personalized chart environment that emphasizes the most relevant information for their strategy.
The indicator also features a comprehensive alert system with notifications for:
New trend formations (uptrend, downtrend, neutral)
Early trend change signals
Momentum threshold crossovers
Other significant market conditions
Alerts can be customized and delivered through TradingView's notification system, making it easy to stay informed of important market developments even when you are away from the charts.
🟢 Practical Usage Tips
→ Trend Analysis and Interpretation: The indicator visualizes trend direction and strength directly on the chart through color-coding and the information panel, allowing traders and investors to immediately identify the current market context. This information helps in assessing the potential for continuation or reversal.
→ Signal Generation Strategies: The indicator generates potential trading signals based on trend direction, momentum confirmation, and selected sensitivity mode. Users can choose between Conservative (fewer but more reliable signals), Balanced (moderate approach), or Aggressive (more frequent but potentially less reliable signals).
→ Multi-Period Trend Assessment: Through its layered EMA approach, the indicator enables users to understand trend conditions across different lookback periods within the same timeframe. This helps in identifying the dominant trend and potential turning points.
🟢 Pro Tips
Adjust EMA periods based on your timeframe:
→ Lower values for shorter timeframes and more frequent signals
→ Higher values for higher timeframes and more reliable signals
Fine-tune sensitivity mode based on your trading style:
→ "Conservative" for position trading/long-term investing and fewer false signals
→ "Balanced" for swing trading/medium-term investing with moderate signal frequency
→ "Aggressive" for scalping/day trading and catching early trend changes
Look for confluence between components:
→ Strong trend strength percentage and direction in the information panel
→ Overall market context aligning with the expected direction
Use for multiple trading approaches:
→ Trend following during strong momentum periods
→ Counter-trend trading at band extremes during overextension
→ Early trend change detection with sensitivity adjustments
→ Stop loss placement using dynamic bands
Combine with:
→ Volume indicators for additional confirmation
→ Support/resistance analysis for strategic entry/exit points
→ Multiple timeframe analysis for broader market context

Grid Level Visualizer v1.0Overview
This indicator draws a customizable grid of horizontal price levels directly on your chart. It's designed to help traders visualize potential support and resistance zones, manage grid trading strategies, or simply divide a price range into equal segments. The script offers interactive controls, extensive customization options, and alert functionality.
Key Features:
Customizable Grid: Draws a grid based on user-defined Upper Price Bound and Lower Price Bound.
Interactive Bounds: Easily adjust the Upper and Lower bounds by dragging the corresponding lines directly on the chart (click the line first to select, then drag). Bounds can also be set numerically in the settings.
Adjustable Levels: Specify the total number of horizontal lines in the grid (Number of Grid Levels), including bounds.
Custom Styling: Independently configure the color, width, and style (Solid, Dashed, Dotted) for the boundary lines and the intermediate grid lines.
Price Labels: Optional display of price values for each grid level, positioned on the right side near the current bar.
Labels for boundary levels automatically inherit the boundary line colors.
Adjustable horizontal offset (Price Label Offset (X)) for labels.
Customizable text size (Text Size) and color (Price Text Color (Mid)) for mid-levels.
Grid Start Time: Define a specific date and time (Grid Start Time) from which the grid lines should start appearing on the chart (defaults to the beginning of the current month).
Line Extension: Grid lines automatically extend to the right margin of the chart.
Alert Condition: Provides a "Grid Level Cross" condition for creating custom alerts when price crosses any active grid level.
Alert Toggle: An option (Enable Alert Condition?) in the settings to enable or disable the availability of the "Grid Level Cross" condition when creating alerts.
Real-time Calculation: Uses calc_on_every_tick=true for responsive alert checking against the current price.
How to Use:
Add the "Improved Grid Level Visualizer" indicator to your chart.
Set Bounds: Adjust the Upper Price Bound and Lower Price Bound lines by clicking and dragging them on the chart, or set precise values in the indicator settings.
Set Levels: Define the Number of Grid Levels you need in the settings.
Set Start Time: Use the Grid Start Time input to control when the grid visualization begins.
Customize: Configure colors, line styles, label visibility, etc., in the settings panel.
Set Alerts (Optional): Follow the steps below.
Notes:
The grid levels are calculated purely based on the mathematical division of the specified price range. They do not automatically adapt to market structure unless you manually adjust the bounds.
When changing the Grid Start Time after the indicator has been running, you might need to refresh the chart or remove/re-add the indicator for the visual starting point to update correctly.
