3 EMA with Alerts 2025This indicator plots three key EMAs (20, 50, and 200) directly on the chart, making it easy to track short-, medium-, and long-term trends. A color-coded table is displayed in the top-right corner for quick reference.
The script also includes smart alerts that trigger only when the state changes:
• 🔵 EMA 20 crossing above EMA 50 & EMA 200 → Bullish signal
• 🔴 EMA 20 crossing below EMA 50 & EMA 200 → Bearish signal
This tool is designed for traders who want clean visuals, reliable alerts, and simplified trend recognition in 2025 markets.
Tradingsignals

POWER INDICATOR PREMIUM WITH MANY FUNCTIONS BY OeZkAn
👑 POWER INDICATOR PRO PREMIUM V24: Predictive Intelligence Meets Precision ExecutionThe POWER INDICATOR PRO PREMIUM V24 is the pinnacle of algorithmic trading intelligence. This system transcends traditional indicators by utilizing a sophisticated framework of advanced mathematical equations to predict the impending trend direction before the market moves. It combines Smart Money Concepts (SMC), Multi-Timeframe (MTF) convergence, and Dynamic Risk Management to deliver unparalleled clarity and execution confidence.If you seek a trading partner that provides leading, predictive signals and high-probability entries, this system is your definitive solution.
🧠 The Core Element: Predictive Market Context & Directional ForecastThe foundational strength of the POWER INDICATOR is its ability to forecast the market's bias through advanced quantification:
🚀 Directional Pre-Cognition (LRC & Mathematical Models):The system utilizes the Linear Regression Curve (LRC) and proprietary statistical models as its core mathematical engine. This process extrapolates the probable trend path and generates a Directional Forecast for the coming bars, enabling you to anticipate moves rather than react to them. This forecast serves as the ultimate bias filter.
🧠 The Convictional Filter: Quantifying Probability ($60\%$ Confidence):This filter is our proprietary Probability Brain. It eliminates market noise by forcing convergence across multiple high-level factors (MTF agreement, Momentum, SMC levels).High-Conviction Threshold: Independent analysis confirms that the Conviction Filter provides an exceptionally high win rate and signal quality starting at just $60\%$. Setting your threshold at this level ensures you only consider trades where the predictive mathematical components are in strong alignment.
🌊 FVG & GP Predictive Zones:The system automatically identifies and projects critical Fair Value Gaps (FVG/LSOB) and the Golden Pocket (GP) Re-Test Zone. These zones are algorithmically identified as high-probability targets for pullbacks and reversals, providing a clear map of where liquidity will be sought.
💡 The Convictional Trading Workflow: A 3-Step Guide to ExecutionContext Check: Confirm the LRC Directional Forecast aligns with your trade and the Conviction Score Meter is above your desired threshold (minimum $60\%$).Optimal Entry: Wait for the signal to trigger at a high-R:R entry point (GP, FVG, or Aggressive Impulse), guided by your chosen trading mode.Dynamic Management: Let the system handle risk, utilizing Structural SL and automatic Multi-Method Trailing Stops post-TP1.
🎯 Mode Selection: Matching Strategy to MarketThe indicator's power lies in its Modularity. Selecting the correct mode is crucial for optimizing your results.Trading StyleRecommended ModesPrimary Rationale & Entry LogicHigh-Frequency ScalpingCT Scalp-OnlyDesigned for counter-trend entries in a pullback towards the Golden Pocket (GP). Uses tighter SL/TP multipliers for quick profit-taking. (Fast, high-R:R)ATR Channel Scalp (ACS)Utilizes volatility channels (ATR bands) for quick mean-reversion trades when price overextends.Strategic Day Trading / Swing TradingUltimate Fusion Mode (UFM)The highest probability mode. Best for catching major shifts confirmed by SMC (LRC, GP, FVG, MSS). Waits for a deep, high-R:R Re-Test Entry.Haupttrend & Scalp (Kombi)Excellent general-purpose mode. Focuses on trend continuation but allows for high-R:R pullback entries at key levels (GP/FVG). (Balanced)FVG Mitigation Entry (FME)Ideal for SMC traders. Waits for the price to precisely re-test and mitigate an unmitigated Fair Value Gap (FVG) or Liquidity Sweep (LSOB) zone before entry.Breakout & Momentum TradingBand Breakout-OnlyTriggers an entry only when price decisively breaks outside the SMA Volatility Bands (configurable). Filtered by momentum requirements.Dynamic Range Expansion (DRE)Specifically detects low-volatility consolidation before an anticipated high-momentum expansion phase.
🔔 The Master Alert System: Your Execution EdgeThe powerful Alert functionality ensures you can monitor multiple assets and timeframes without being glued to the screen.1.
✅ Dynamic MASTER ALARM (Compact Text)The core alert uses a compact, dynamic JSON/text message that contains all necessary information for quick execution:Action: BUY / SELLMode Used: Conviction Score: Key Level: 2. LRC/GP Combo-Alert (High-R:R)This is the most valuable alert for strategic traders. It triggers only when the LRC direction is confirmed and the price enters the Golden Pocket (GP) Re-Test Zone, indicating an optimal high-R:R pullback opportunity.Final Note: To maximize the predictive power, ensure the useConvictionFilter is set to a minimum of $60\%$ and the useStructureSL is activated to protect your capital with intelligent stop placement.Stop reacting. Start predicting. Activate the POWER INDICATOR PRO PREMIUM V24 and lead the market today!
⚠️ IMPORTANT NOTICE: Full Version vs. Public Release
This current version, the POWER INDICATOR PRO PREMIUM V24 (Full Feature Test Release), is publicly available only for demonstration and testing purposes to showcase the system's full potential (including all 12 Dynamic Modes and the advanced Convictional Filter).
A slightly streamlined Public Version will remain permanently free and accessible to the community. However, the Full Premium Version—featuring the complete 12-Mode selection, all predictive functionalities, and crucial additions such as enhanced, precise Entry/Exit Labels and Dynamic Stop Loss/Take Profit Labels directly calculated by the algorithm—will soon be available exclusively for subscribers.
Test the power now and be ready for the subscription launch!

DMcTrades Trading EngineDMcTrades Trading Engine
Multi-Layer Trend, Structure & Momentum Analysis
This indicator is a comprehensive, rule-based trading framework designed to identify high-quality buy and sell opportunities through multi-timeframe confluence, trend alignment, and price-action confirmation. It combines structure breaks, moving-average alignment, volatility filters, and momentum confirmation into a single, unified visual system.
The script is intended for intraday and short-term swing trading, with particular effectiveness on lower timeframes when higher-timeframe trend alignment is respected.
Core Architecture
The indicator is divided into two independent but complementary engines:
1) Multi-Timeframe Structure & Trend Engine
This engine focuses on directional bias and structural validation.
Key components:
Multi-timeframe EMA alignment (fast and slow timeframes)
Supertrend direction agreement across timeframes
Swing-based Break of Structure (BOS) detection
Configurable trend strictness (Conservative / Balanced / Aggressive)
Optional wick-based or close-based structure confirmation
Signals generated here establish trend-qualified entry permission, not standalone entries.
2) Momentum & Breakout Signal Engine
This engine evaluates entry quality and follow-through probability.
Key components:
Breakout and breakdown detection from recent swing levels
ATR-adjusted volatility and impulse candle filtering
MACD and RSI momentum confirmation
VWAP and higher-timeframe EMA confluence (optional)
Retest-based and impulse-based entry logic
Overextension protection to avoid late entries
Signals are classified as:
CONFIRMED (strong multi-filter confluence)
BASE (core conditions met, fewer filters passed)
Signal Types & Visuals
The indicator provides multiple visual layers:
BUY / SELL triangles for core entries
CONFIRMED BUY / SELL labels for high-confluence setups
Classification boxes highlighting active signal zones
Supertrend overlays (current timeframe + optional 5-minute overlay)
EMA stack visualization (9 / 21 / 50 / 200)
Impulse candle highlighting
Optional reversal warning triangles based on momentum divergence
All visuals are fully configurable and can be enabled or disabled independently.
Risk & Trade Context Features
To help filter lower-probability trades, the suite includes:
Minimum ATR and volume thresholds
Trend stability checks (avoids fresh flips unless momentum is strong)
EMA slope and distance validation
Liquidity sweep and recent structure awareness
Optional higher-timeframe trend agreement
These filters are designed to reduce over-trading and improve signal quality during ranging or low-volatility conditions.
Recommended Usage
Best suited for 1-minute to 15-minute charts
Designed for trend-following and momentum continuation
Works across Forex, indices, commodities, and crypto
Use in conjunction with proper risk management and session awareness
This indicator does not provide take-profit or stop-loss levels and should be used as a decision-support tool, not an automated trading system.
Disclaimer
This script is provided for educational and analytical purposes only.
It does not constitute financial advice. Trading involves risk, and past performance does not guarantee future results.

Smart Money Alpha Signals (Performance Dashboard) Smart Money Alpha Signals: Identifying Market Leaders & Generating Alpha
GMP Alpha Signals (Global Market Performance Alpha) is a specialized analysis tool designed not merely to find stocks that are rising, but to identify "Alpha" assets—Market Leaders that defend their price or rise even under adverse conditions where the market index falls or consolidates.
This indicator visualizes the concept of Comparative Relative Strength (RS) and Smart Money accumulation patterns, helping traders capture profit opportunities even during bearish market phases.
Key Objectives (Purpose)
Alpha Capture: Identifying assets generating 'excess returns' that outperform the market Beta.
Smart Money Tracking: Detecting traces of 'institutional buying' and 'accumulation' that defend prices during index plunges.
Decoupling Identification: Spotting assets moving on independent catalysts or momentum, regardless of the broader market direction.
Stop Hunt Filtering: Distinguishing 'fake drops' where price dips temporarily, but Relative Strength remains intact.
Dashboard Guide
Interpretation of the information panel (Table) displayed on the chart.
Rel. Performance: Shows the excess return compared to the index over the set period. (Positive/Green = Stronger than the market).
Decoupling Strength: The correlation coefficient with the index. Lower values (0 or negative) indicate movement independent of market risk.
Bullish: The count/rate of rising or limiting losses when the index drops sharply (e.g., < -0.5%). (Gold = Market Crash Leader).
Defended: The count/rate of holding support levels when the index shows mild weakness (e.g., < -0.05%). (Gold = Strong Accumulation).
Bench. Defense: The defense rate of the comparison benchmark (e.g., TSLA, ETH). Your target asset must be higher to be considered the sector leader.
Input Options & Settings Guide
You can optimize settings according to your trading style and asset class (Stocks/Crypto).
(1) Main Settings
Major Index: The baseline market index for comparison.
(US Stocks: NASDAQ:NDX or TVC:SPX / Crypto: BINANCE:BTCUSDT)
Benchmark Symbol: A competitor within the sector.
(e.g., Set NVDA when analyzing Semiconductor stocks).
Correlation Lookback: The lookback period for judging decoupling. (Default: 30)
Performance Lookback: The number of bars to calculate cumulative returns and defense rates. (Default: 60)
(2) Dashboard Thresholds
These settings define the criteria for what qualifies as "Defended" or "Bullish".
Performance (Max %): Used to find assets that haven't pumped yet. Signals trigger only when Alpha is below this value.
Defended Logic:
Index Drop Condition: The index must drop by at least this amount to start checking. (e.g., -0.05%)
Asset Buffer: How much the asset must outperform the index drop.
(Example: If Index drops -1.0% and Buffer is 0.2%, the asset must be at least -0.8% to count as 'Defended').
Bullish Logic: Measures resilience during steeper market dumps (e.g., -0.5% drop) compared to the Defended Logic.
Volume Settings: Decides whether to count Defended/Bullish instances only when accompanied by volume above the SMA.
(3) Signal Logic Settings (Crucial)
Customize conditions to trigger alerts. The choice between AND / OR is crucial.
AND: Condition must be met SIMULTANEOUSLY with other active conditions (Conservative/High Certainty).
OR: Condition triggers the signal INDEPENDENTLY (Aggressive/Opportunity Capture).
Performance: Is the relative performance within the threshold? (Basic Filter).
Decoupling: Has the correlation dropped? (Start of independent move).
Bullish Rate: Is the Bullish rate high during market dumps?
Defended Rate (High): (Recommended) Is there continuous price defense occurring? (Accumulation detection).
Defended Rate (Low): (Warning) Has the defense rate broken down? (For Stop Loss).
Defended > Benchmark: Is it stronger than the Benchmark (2nd tier)?
Volume Spike: Has volume surged compared to the average? (Institutional involvement).
RSI Oversold: Is it in oversold territory? (Counter-trend trading).
Decoupling Move: Does the current bar show the "Index Down / Asset Up" pattern?
Min USD Volume: Transaction value filter (To exclude low liquidity assets).

RGainzAlgo Mk.11Only use this if you hate losing money more than you like making it since it will only give the thing, not the gamble/lotto ticket that will burn your account. inspired by all the scammers on TikTok and Instagram but actually working to help you. Anyway without further ado, I give you:
🚀 RGainzAlgo Mk.11—Institutional Trend System
RGainzAlgo Mk.11 is a precision trend-trading suite designed to filter out market noise using advanced volume analysis and volatility logic. Unlike standard indicators that lag and get "chopped up," Mk.11 utilizes a proprietary Signal Strength Engine and Auto-Throttle Logic to adapt to changing market conditions in real time.
🧠 The Core Intelligence: "Signal Strength Engine"
At the bottom-right of your screen, the Heads-Up Display (HUD) gives you a real-time health check of the market (0–100 score). It analyzes 4 distinct dimensions on every candle:
1. Trend Velocity: (EMA Spread)
2. Volume Flow: (Institutional participation)
3. Momentum Integrity: (Candle body & slope analysis)
4. Volatility Stability: (ATR consistency)
🛡️ Feature: Auto-Throttle Logic
The algorithm automatically shifts "gears" based on the market condition to protect your capital:
🔴 STRICT Mode (Score 0–40): Detected in choppy/weak markets. The algo engages safety filters and requires 1.4x volume to trigger a trade.
🟡 NORMAL Mode (Score 40–70): Standard trend-following rules apply (1.1x Volume).
🔵 AGGRESSIVE Mode (Score 70+): Engaged during high-velocity breakouts. Filters are relaxed (0.8x volume) to ensure you catch fast-moving entries.
📊 Professional Visual Tools
Liquidity Heatmap: A dynamic volume profile on the right side of the chart highlights "brick wall" resistance and "vacuum" zones where price moves fast.
Option Strike Labels: Automatically calculates suggested Call/Put Strikes (e.g., "Buy CALL 450").
Momentum Bursts: Visual triangles indicate sudden volume spikes—perfect for scaling into winning positions.
Dynamic Background: The chart background changes color (green/red) to indicate the dominant macro trend.
---
⚡ How to Trade with Mk.11
1. Wait for the Signal: Look for a BUY (green) or SELL (red) label.
2. Check the HUD:
Is the Score high (green/blue)?
Is the mode "Normal" or "Aggressive"? (Avoid "Strict" if possible).
3. Check the Heatmap: Ensure you aren't buying directly into a massive yellow wall of resistance.
4. Execute: Use the suggested strike price for options or enter the perp contract.
---
⚙️ Best Settings
Assets: SPY, QQQ, NVDA, TSLA, AAPL, GOOGL, MSFT, AMZN, BTCUSD, ETHUSD.
Timeframes: 5m, 15m, 1H.
Recommended: Enable "Limit to RTH" if you are day trading stocks to avoid pre-market noise.
---
Risk Disclaimer: Trading involves risk. This algorithm is a tool to assist decision-making, not financial advice. Past performance is not indicative of future results.
By FallenAngel666

V-CORE Engine Free v2V-CORE Engine Free v2 — Public Release
This is another release from the V-CORE suite, providing simplified market regime visualization based on proprietary trend-state processing.
No settings, no noise — just clean directional bias adapted for crypto markets on 1H+ timeframes.
This free version is intentionally minimal. It uses a reduced feature-set derived from our internal V-CORE Engine architecture.
For more details about V-CORE tools, future releases, or the full professional engine, please check our profile page.

Triple Screen System [FlexibleMAs MACD-RSI-ADX]#### Triple Screen System (TSS-FMR)
The TSS-FMR script is a specialized, multi-timeframe confirmation tool built for Swing, Positional Traders, and Longer Term Investors. It is engineered to filter out low-conviction noise by implementing an advanced interpretation of the Elder's Triple Screen strategy, relying on proprietary momentum, volatility, and volume analysis to isolate high-probability setups.
---
#### 🧠 Core Methodology & Logic
The TSS-FMR synthesizes three distinct layers of confirmation to generate signals:
1. Macro Trend & Volatility: Determines the primary trend and overall market condition using configurable EMA+RSI metrics , the script uses Average Directional Index (ADX) as an internal component to filter out non-trending, consolidating market conditions.
2. Momentum Synchronization: A proprietary filter requiring MACD,MAs and RSI to be synchronized * within a specified bar window (`MACD/RSI Sync Window`) ensures that entries align with current short-term momentum shifts.
3. Volume & Price Action: Final entry is triggered only when the higher timeframes align and the entry timeframe (Daily or 4H) confirms the move, optionally requiring * Candle Confirmation * and filtering out low-quality trades using the * Volume Filter *
The key is the separation of input thresholds and lengths for Weekly and Daily lookbacks, allowing for precise tuning unavailable in standard public libraries.
---
#### 🎯 Understanding Signal Strength & Conviction
Signals are categorized using a proprietary Strength scale (from Overbought/Oversold to 6) to help traders gauge the potential size and probability of the momentum move, This scale is dynamically influenced by the ADX volatility readings.
#### 🔍 Integrating External Visual Tools (Addressing Rule: Vendor/Chart)
The TSS-FMR generates signals based solely on its internal logic and inputs .*
We recommend overlaying the TSS-FMR signals with external tools (such as the Lux Algo SmartMoneyConcepts indicator or similar public S/R tools) for visual confirmation only :
* Signals (2, 3, 4) + CHOCH/BOS: * A signal with lower internal strength (2-4) gains stronger conviction if it aligns precisely with a CHOCH or BOS event visually identified by the external tool. This confirms that the market structure is validating the script's momentum reading.
Zone Confirmation: When signals land precisely within visually defined Liquidity or Accumulation/Distribution Zones (provided by external visual tools), it adds significant conviction to the TSS-FMR's output.
The *Overbought/Oversold regions* are decided based on the script's internal strength calculation and prevailing price action.
#### Summary:
--- This script is for Swing, Positional Traders and Longer Term Investors
--- It will only work with Monthly,Weekly, Daily and 4H chart to help you make confirmation based positions.
--- Sell Signals are Overbought Exits and Short sell signals, Plan according to Weekly Signals and Daily signals
--- Use the Momentum Table/matrix at the right top of the chart when TSS indicator is active.
--- Use Volume Filter enable to remove chaos of signals
--- Keep *Lux Algo -SmartMoneyConcepts* indicator active for visual of zones
--- Adjust Volume Filter in Settings to avoid crowding of signals
--- Adjust Input signal length to select number of history bars
--- Watch-out for Weekly 100ema Line and
--- Watch-out for Sell Signals, in discount region they are marked as Buy oversold or moderate, vise versa Sell Overbought signals are added to the charts.
--- To earn money, we need to look out for early signals, fake breakouts, breakdowns and what we want the table/matrix turning all green or red in Momentum trades.
---
#### House Rule Compliance Statement
This script description is provided strictly for technical clarity. It is free from all promotional content, external links, contact information, social media references, and solicitations, as per TradingView's General House Rule #2. The justification for its closed-source nature is based on its proprietary signal synchronization logic and flexible, multi-timeframe implementation.

Market Echo Screener [BigBeluga]
The Market Echo Screener is a structured multi-asset dashboard capable of tracking up to 15 symbols simultaneously .
Designed to condense complex market data into an actionable format. Each column represents a specialized calculation, giving traders insight into signals, phases, retests, and volatility — all updated in real time.
For each symbol, it displays a full set of analytics: trend signals, take profit progression, wave structure, equilibrium pulls, volatility-adjusted flows, smart band retests, volatility regimes, and live price context — all condensed into one unified table.
Instead of flipping through multiple charts, traders get an instant overview of market dynamics across an entire watchlist, making it easier to spot alignment and high-probability opportunities.
⬤ Trend Signals
This column is powered by a low-pass digital trend filter that smooths short-term fluctuations and isolates directional momentum.
It produces Buy and Sell signals when price crosses adaptive thresholds relative to the smoothed baseline. Stronger “+” signals appear when slope acceleration or momentum divergence confirms additional conviction.
• Uses recursive filtering to eliminate noise.
• Signal strength is determined by the magnitude of deviation from the baseline.
• Tracks how many bars back the signal occurred, using a bar-counting algorithm.
• Combines both normal and power signals to reflect phases of market conviction.
⬤ TPs (Take Profits)
The take profit ladder is generated through an adaptive volatility-projection model .
When a signal fires, projected levels are based on volatility-weighted extensions. Each level (TP1–TP6) represents an incrementally wider confidence band, dynamically recalculated with every new bar.
• Uses volatility-normalized ranges for TP distances.
• Level activation is sequential, progressing as price reaches thresholds.
• Reset occurs when opposite signals are detected.
• Higher TPs imply extended momentum runs, while early TP triggers highlight conservative exits.
⬤ ActionWave
The ActionWave column applies a dual-smoothing algorithm combining custom MA stacks and polynomial regression to capture the underlying wave structure.
It identifies macro phases (Bullish ∆ / Bearish ∇) and flags retests when price folds back into the average after expansion.
• Wave slope is calculated using gradient differentials.
• Retests are confirmed within a bar-window threshold (e.g., 20–25 bars).
• Distinguishes continuation from exhaustion by analyzing whether slope remains positive/negative.
• Provides a clean map of trend rhythm without intrabar noise.
⬤ Magnet
The Magnet measure calculates a dynamic equilibrium band around price.
By averaging the midpoints of recent high–low ranges and weighting them by volatility, it defines a “fair zone” where price tends to trend and mean-revert.
• Bullish/Bearish status is derived from price position relative to the equilibrium mean.
• Retests occur when price leaves the zone and then re-enters within a tolerance band.
• Incorporates a mean-reversion index to highlight strength of pull.
• Acts as a gravitational anchor, showing when price is likely to snap back.
⬤ FlowTrend
FlowTrend is calculated using volatility and noise adjusted envelope bands .
It determines the active market flow by testing whether price consistently holds above or below the smoothed envelope. Retests are logged when price touches the envelope and respects trend direction.
• Bands expand/contract based on ATR and rolling variance.
• Flow state = Bullish if closing above upper envelope, Bearish if below.
• Retests validated only if trend slope and band alignment remain intact.
• Helps identify continuation setups by filtering false flips.
⬤ Smart Bands
Smart Bands employ an adaptive trailing stop framework that shifts with volatility and momentum.
Price interaction with these bands is tracked for bullish (∆) or bearish (∇) retests, highlighting whether the current move has revalidated at its volatility boundary.
• Bands derived from trailing volatility-adjusted stops.
• Upward retest fires when price tests support bands during uptrend.
• Downward retest occurs when resistance bands are tapped in downtrend.
• Provides structured “confirmation points” that validate signals.
⬤ Volatility
Volatility is measured via a hybrid standard deviation logic .
First, the standard deviation of closing prices over 10 bars is scaled by a factor, then normalized against its own 20-bar rolling standard deviation. The result is converted into a 0–100 index, producing three regimes:
❄️ Calm (<50): low dispersion, mean-reversion conditions dominate.
⚠️ Elevated (50–70): directional expansion likely, watch for breakout tension.
💥 Explosive (>70): strong dispersion, trend-following setups favored.
• Uses layered smoothing to dampen noise.
• Normalization ensures comparability across different assets.
• Acts as a meta-filter for selecting strategy type (range vs. momentum).
⬤ Price
The price column displays the latest close rounded to the nearest tick size.
It is color-coded by candle bias: green for bullish closes, red for bearish closes.
• Tick normalization ensures clean display across assets with different decimal precision.
• Color-coding gives instant sentiment context.
• Serves as the anchor reference for all other metrics in the row.
The Market Echo Screener is not a simple signal table — it’s a layered analytics framework.
Each column is driven by technical calculations: smoothing filters, volatility projections, equilibrium models, and adaptive band logic. Together, they create a unified lens on multiple assets, allowing traders to rapidly identify alignment, filter out noise, and focus on the clearest opportunities.

Strategy Builder v1.0.0 [BigBeluga]🔵 OVERVIEW
The Strategy Builder combines advanced price-action logic, smart-money concepts, and volatility-adaptive momentum signals to automate high-quality entries and exits across any market. It blends trend recognition, market structure shifts, order block reactions, imbalance (FVG) signals, liquidity sweeps, candlestick confirmations, and oscillator-powered divergences into one cohesive engine.
Whether used as a full automation workflow or as a structured confirmation framework, this strategy provides a disciplined, rules-driven method to trade with logic — not emotion.
🔵 BACKTEST WINDOW CONTROL
This module allows you to restrict strategy execution to a specific historical period.
Ideal for performance isolation, regime testing, and forward-walk validation.
Limit Backtest Window
Enabling this option activates custom date filters for the backtest engine.
Start — Define the starting date & time for backtesting
End — Define the ending date & time for backtesting
Only trades and signals inside this window are executed
Reduces computation load on large datasets
Useful for testing specific market environments (e.g., bull cycles, crash periods, sideways regimes)
🔵 SIGNAL GLOSSARY (Advanced Technical Explanation)
Traders can build long and short setups using up to 6 configurable entry conditions for each direction.
Every condition can be set as Bullish or Bearish and mapped to any signal source — allowing deep customization
Below is the full internal logic overview of every signal available in the Strategy Builder.
Signals are based on trend models, volatility structures, liquidity logic, oscillator behavior, and market structure mapping.
Trend Signals (Low-Lag Trend Engine)
Uses a proprietary low-lag baseline + momentum gradient model to detect directional bias.
Trend Signal — Momentum breaks above/below adaptive trend baseline.
Trend Signal+ — Stronger trend confirmation using volatility-weighted momentum.
Trend Signal Any — Triggers when any bullish/bearish trend signal appears.
SmartBand & Retests (Adaptive Volatility Bands)
Dynamic envelope that contracts/expands with volatility & trend strength.
SmartBand Retest — Price retests dynamic band and rejects, confirming continuation.
ActionWave Signals (Impulse-Pullback Engine)
Tracks wave behavior, acceleration and deceleration in price.
ActionWave — Detects directional impulse strength vs pullback weakness.
ActionWave Cross — Momentum acceleration threshold crossed → trend ignition.
Magnet Signals (Liquidity Gravity + Mean Reversion Bias)
Detects zones where price is being drawn due to liquidity voids or imbalance.
Magnet — Trend and liquidity pressure align, creating directional “pull.”
MagnetBar Low Momentum — Low-volatility compression → pre-breakout condition.
Flow Trend (Directional Flow State + ATR Envelope)
Higher-timeframe bias confirmation + dynamic volatility filter.
FlowTrend — Confirms major directional bias (uptrend or downtrend).
FlowTrend Retest — Price tests HTF flow band and rejects → trend resume.
Voltix (Volatility Expansion Pulse)
Detects regime shift from quiet accumulation → trending expansion.
Voltix — Breakout volatility signature, trend acceleration trigger.
Candlestick Pattern (Algorithmic Price Action Recognition)
Auto-recognizes meaningful reversal or continuation candle formations.
Candlestick Pattern — Confirms momentum reversal/continuation via candle logic.
OrderBlock Logic (Institutional Footprint System)
Institutional demand/supply zone tracking with mitigation logic.
Order Block Touch — Price taps institutional zone → reaction filter.
Order Block Break — OB invalidation → institutional flow shift.
Market Structure Engine (Swing Logic + Volume Confirmation)
Tracks major swing breaks and structural reversals.
BoS — Break of Structure in trend direction (continuation bias).
ChoCh — Change of Character — early reversal marker.
Fair Value Gaps (Imbalance & Volume Displacement)
Identifies inefficiencies caused by rapid displacement moves.
FVG Created — Price leaves inefficiency behind.
FVG Retest — Price returns to rebalance inefficiency → reaction zone.
Liquidity Events (Stop-Run & Reversal Logic)
Detects stop-hunt events and liquidity sweeps.
SFP — Swing failure & wick sweep → reversal confirmation.
Liquidity Created — New equal highs/lows form liquidity pool.
Liquidity Grab — Sweep through liquidity line followed by rejection.
Support / Resistance Break Logic
Adaptive zone recognition + momentum confirmation.
Support/Resistance Cross — Zone decisively broken → structural shift.
Pattern Breakouts (Market Geometry Engine)
Tracks breakout from compression & expansion formations.
Channel Break — Channel breakout → trend acceleration.
Wedge Break — Break from contraction wedge → burst of momentum.
Session Logic (Opening Range Behavior)
Session-based volatility trigger.
Session Break — Break above/below session opening range.
Momentum / Reversal Oscillator Suite
Oscillator-driven exhaustion & reversal signals.
Nautilus Signals — Momentum reversal signature (oscillator shift).
Nautilus Peak — Momentum peak → exhaustion risk.
OverSold/Overbought ❖ — Extreme exhaustion zones → reversal setup.
DipX Signals ✦ — Dip buy / Dip sell timing, micro-reversal engine.
Advanced Divergence Engine
Momentum/price disagreement layer with multi-trigger confirmation.
Normal Divergence — Classic divergence reversal.
Hidden Divergence — Trend continuation divergence.
Multiple Divergence — Multiple divergence confirmations stacked → high confidence.
🔧 Adjustable Signal Logic
Some signals in this system can be additionally refined through the strategy settings panel.
This allows traders to tune internal behavior for different market regimes, assets, and volatility conditions.
🔵 LONG / SHORT EXIT CONDITIONS
This section allows you to automate exits using the same advanced market conditions available for entries.
Each exit rule consists of:
Toggle — Enable/disable individual exit rule.
Direction Filter — Trigger exit only if selected market bias appears (Bullish/Bearish).
Signal Type — Choose which market event triggers the exit (same list as entry conditions).
When the active conditions are met, the strategy automatically closes the current position — ensuring emotion-free risk management and systematic trade control.
🔵 TAKE PROFIT & STOP LOSS SYSTEM
This strategy builder provides a fully dynamic risk-management engine designed for both systematic traders and discretionary confirmation users.
Take Profit Logic
Scale out of trades progressively or exit fully using algorithmic TP levels.
Up to 3 Take-Profit targets available
Choose TP calculation method:
• ATR-based distance (volatility-adaptive targets)
• %-based distance (fixed percentage from entry)
Define Size — ATR multiplier or % value
Custom Exit Size per TP (e.g., 25% / 25% / 50%)
Visual TP plotting on chart for clarity
Stop Loss Logic
Automated protection logic for every trade.
Two SL Modes:
• Fixed Stop Loss — static SL from entry
• Trailing Stop Loss — SL follows price as trade progresses
Distance options:
• ATR multiplier (adapts to volatility)
• %-based from entry (fixed distance)
SL dynamically draws on chart for transparency
Trailing SL behavior:
Follows price only in profitable direction
Never moves against the trade
Locks profits as trend develops
🔵 Strategy Dashboard
A compact on-chart performance dashboard is included to help monitor live trade status and backtest results in real time.
It displays key metrics:
Start Capital — Initial account balance used in simulation.
Position Size — % of capital allocated per trade based on user settings (It changes if the trade hits take profits, when more than one take profit is selected).
Current Trade — Shows active trade direction (Long / Short) and real-time % return from entry.
Closed Trades — Counter of completed positions, useful for reading sample size during testing.
🔵 CONCLUSION
The Strategy Builder brings together a powerful suite of smart-money and momentum-driven signals, allowing traders to automate robust trade logic built on modern market structure concepts. With access to trend filters, order blocks, liquidity events, divergence signals, volatility cues, and session-based triggers, it provides a deeply adaptive trade engine capable of fitting many market environments.

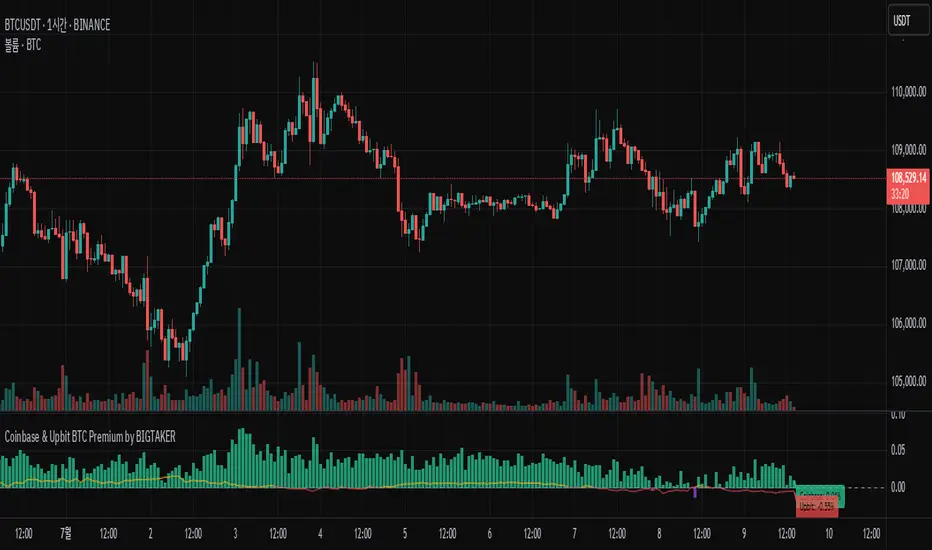
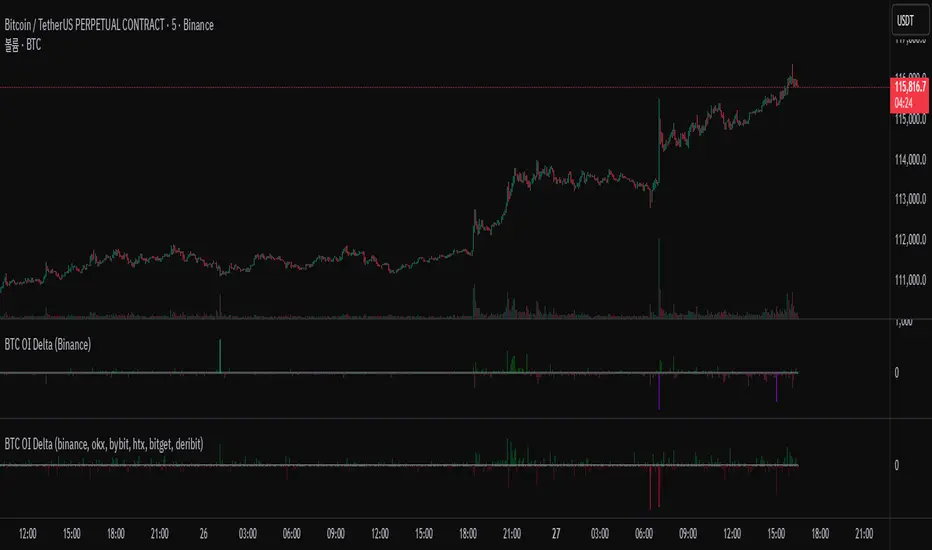
BTC OI Delta (binance, okx, bybit, htx, bitget, deribit)📊 BTC Open Interest (OI) Delta (Binance, OKX, Bybit, HTX, Bitget, Deribit)
📝 Overview
This Pine Script indicator tracks and visualizes the changes (delta) in Bitcoin (BTC) open interest (OI) for perpetual futures across multiple major crypto exchanges: Binance, OKX, Bybit, Bitget, HTX, and Deribit. It calculates the total net delta by summing the OI delta from each exchange and displays positive (OI increase) and negative (OI decrease) deltas as separate column charts. Users can choose which exchanges to include or exclude and utilize the spike highlight feature to differentiate delta intensity with color based on user-defined thresholds.
⚡ Key Features
🌐 Multi-exchange OI delta tracking
Fetches and calculates BTC perpetual futures OI delta individually from Binance, OKX, Bybit, Bitget, HTX, and Deribit.
📈 Total net delta calculation
Sums the OI delta from all selected exchanges to represent overall market open interest changes.
🎨 Visualization
Column plots: Displays net OI increases (positive delta) and decreases (negative delta) as separate column charts for intuitive trend analysis.
Spike highlights: Changes in OI delta are color-coded according to user-defined thresholds to make significant moves easily identifiable.
⚙️ User settings
Users can select which exchanges to display, enable/disable spike highlights, and set thresholds for “strong” and “very strong” OI delta changes.
🛠 Input Settings
Show Zero Line (bool, default: true): Show a zero baseline on the chart.
Highlight Spikes (bool, default: true): Enable color highlighting based on OI delta intensity.
Strong Threshold (int, default: 1000): Delta value considered a “strong” change (in BTC).
Very Strong Threshold (int, default: 2000): Delta value considered a “very strong” change (in BTC).
Show Binance (bool, default: true): Include Binance OI delta.
Show OKX (bool, default: true): Include OKX OI delta.
Show Bybit (bool, default: true): Include Bybit OI delta.
Show Bitget (bool, default: true): Include Bitget OI delta.
Show HTX (bool, default: true): Include HTX OI delta.
Show Deribit (bool, default: true): Include Deribit OI delta.
🔢 Calculation Method
🧮 Individual OI request
Uses request.security() to fetch OI data from each exchange.
➕ Delta calculation
Current bar OI minus previous bar OI (oi - oi ).
❌ Handling na values
If OI data is missing (exchange disabled or no data), the delta is treated as 0 to avoid sum errors.
🔗 Total net delta
Sums all selected exchange deltas as totalCombinedDelta.
↔️ Separate net increase/decrease
Positive (netIncreaseCombined) and negative (netDecreaseCombined) parts of total delta are split.
🎨 Color determination
getNetDeltaHighlightedColor function dynamically sets column colors based on highlightSpike and threshold settings.
🎨 Color Scheme
Highlight disabled:
Positive delta: teal shades
Negative delta: red shades
Highlight enabled:
Positive delta (normal): dark teal (#026628)
Positive delta (strong): bright teal (#00ff95)
Positive delta (very strong): yellow (#eeff00)
Negative delta (normal): dark red (#6b0d0d)
Negative delta (strong): bright red (#ff1044)
Negative delta (very strong): pink (#ff00ea)
📊 Usage
💹 Market sentiment analysis
Total net OI delta increase → capital inflow and position building
Total net OI delta decrease → capital outflow and position liquidation
⚖️ Position interpretation
BTC rising + positive OI delta → increasing long positions
BTC falling + negative OI delta → decreasing long positions
BTC falling + positive OI delta → increasing short positions
BTC rising + negative OI delta → decreasing short positions
📈 Trend confirmation
Sustained positive delta → bullish signal
Sustained negative delta → bearish signal
🌪 Volatility prediction
“Strong” or “very strong” spikes may indicate increased price volatility.
🏦 Exchange-specific impact
Enable/disable exchanges to analyze how each exchange’s OI changes affect the overall market.
AUTOMATIC ANALYSIS MODULE🧭 Overview
“Automatic Analysis Module” is a professional, multi-indicator system that interprets market conditions in real time using TSI, RSI, and ATR metrics.
It automatically detects trend reversals, volatility compressions, and momentum exhaustion, helping traders identify high-probability setups without manual analysis.
⚙️ Core Logic
The script continuously evaluates:
TSI (True Strength Index) → trend direction, strength, and early reversal zones.
RSI (Relative Strength Index) → momentum extremes and technical divergences.
ATR (Average True Range) → volatility expansion or compression phases.
Multi-timeframe ATR comparison → detects whether the weekly structure supports or contradicts the local move.
The system combines these signals to produce an automatic interpretation displayed directly on the chart.
📊 Interpretation Table
At every new bar close, the indicator updates a compact dashboard (bottom right corner) showing:
🔵 Main interpretation → trend, reversal, exhaustion, or trap scenario.
🟢 Micro ATR context → volatility check and flow analysis (stable / expanding / contracting).
Each condition is expressed in plain English for quick decision-making — ideal for professional traders who manage multiple charts.
📈 How to Use
1️⃣ Load the indicator on your preferred asset and timeframe (recommended: Daily or 4H).
2️⃣ Watch the blue line message for the main trend interpretation.
3️⃣ Use the green line message as a volatility gauge before entering.
4️⃣ Confirm entries with your own strategy or price structure.
Typical examples:
“Possible bullish reversal” → early accumulation signal.
“Compression phase → wait for breakout” → avoid premature trades.
“Confirmed uptrend” → trend continuation zone.
⚡ Key Features
Real-time auto-interpretation of TSI/RSI/ATR signals.
Detects both bull/bear traps and trend exhaustion zones.
Highlights volatility transitions before breakouts occur.
Works across all assets and timeframes.
No repainting — stable on historical data.
✅ Ideal For
Swing traders, position traders, and institutional analysts who want automated context recognition instead of manual indicator reading.

Smart Money Dynamics Blocks - Pearson MatrixSmart Money Dynamics Blocks — Pearson Matrix
A structural fusion of Prime Number Theory, Pearson Correlation, and Cumulative Delta Geometry.
1. Mathematical Foundation
This indicator is built on the intersection of Prime Number Theory and the Pearson correlation coefficient, creating a structural framework that quantifies how price and time evolve together.
Prime numbers — unique, indivisible, and irregular — are used here as nonlinear time intervals. Each prime length (2, 3, 5, 7, 11…97) represents a regression horizon where correlation is measured between price and time. The result is a multi-scale correlation lattice — a geometric matrix that captures hidden directional strength and temporal bias beyond traditional moving averages.
2. The Pearson Matrix Logic
For every prime interval p, the indicator calculates the linear correlation:
r_p = corr(price, bar_index, p)
Each r_p reflects how closely price and time move together across a prime-defined window. All r_p values are then averaged to create avgR, a single adaptive coefficient summarizing overall structural coherence.
- When avgR > 0.8 → strong positive correlation (labeled R+).
- When avgR < -0.8 → strong negative correlation (labeled R−).
This approach gives a mathematically grounded definition of trend — one that isn’t based on pattern recognition, but on measurable correlation strength.
3. Sequential Prime Slope and Median Pivot
Using the ordered sequence of 25 prime intervals, the model computes sequential slopes between adjacent primes. These slopes represent the rate of change of structure between two prime scales. A robust median aggregator smooths the slopes, producing a clean, stable directional vector.
The system anchors this slope to the 41-bar pivot — the median of the first 25 primes — serving as the geometric midpoint of the prime lattice. The resulting yellow line on the chart is not an ordinary regression line; it’s a dynamic prime-slope function, adapting continuously with correlation feedback.
4. Regression-Style Parallel Bands
Around this prime-slope line, the indicator constructs parallel bands using standard deviation envelopes — conceptually similar to a regression channel but recalculated through the prime–Pearson matrix.
These bands adjust dynamically to:
- Volatility, via standard deviation of residuals.
- Correlation strength, via avgR sign weighting.
Together, they visualize statistical deviation geometry, making it easier to observe symmetry, expansion, and contraction phases of price structure.
5. Volume and Cumulative Delta Peaks
Below the geometric layer, the indicator incorporates a custom lower-timeframe volume feed — by default using 15-second data (custom_tf_input_volume = “15S”). This allows precise delta computation between up-volume and down-volume even on higher timeframe charts.
From this feed, the indicator accumulates delta over a configurable period (default: 100 bars). When cumulative delta reaches a local maximum or minimum, peak and trough markers appear, showing the precise bar where buying or selling pressure statistically peaked.
This combination of geometry and order flow reveals the intersection of market structure and energy — where liquidity pressure expresses itself through mathematical form.
6. Chart Interpretation
The primary chart view represents the live execution of the indicator. It displays the relationship between structural correlation and volume behavior in real time.
Orange “R+” and blue “R−” labels indicate regions of strong positive or negative Pearson correlation across the prime matrix. The yellow median prime-slope line serves as the structural backbone of the indicator, while green and red parallel bands act as dynamic regression boundaries derived from the underlying correlation strength. Peaks and troughs in cumulative delta — displayed as numerical annotations — mark statistically significant shifts in buying and selling pressure.
The secondary visualization (Prime Regression Concept) expands on this by illustrating how regression behavior evolves across prime intervals. Each colored regression fan corresponds to a prime number window (2, 3, 5, 7, …, 97), demonstrating how multiple regression lines would appear if drawn independently. The indicator integrates these into one unified geometric model — eliminating the need to plot tens of regression lines manually. It’s a conceptual tool to help visualize the internal logic: the synthesis of many small-scale regressions into a single coherent structure.
7. Interpretive Insight
This model is not a prediction tool; it’s an instrument of mathematical observation. By translating price dynamics into a prime-structured correlation space, it reveals how coherence unfolds through time — not as a forecast, but as a measurable evolution of structure.
It unifies three analytical domains:
- Prime distribution — defines a nonlinear temporal architecture.
- Pearson correlation — quantifies statistical cohesion.
- Cumulative delta — expresses behavioral imbalance in order flow.
The synthesis creates a geometric analysis of liquidity and time — where structure meets energy, and where the invisible rhythm of market flow becomes measurable.
8. Contribution & Feedback
Share your observations in the comments:
- The time gap and alternation between R+ and R− clusters.
- How different timeframes change delta sensitivity or reveal compression/expansion.
- Prime intervals/clusters that tend to sit near turning points or liquidity shifts.
- How avgR behaves across assets or regimes (trending, ranging, high-vol).
- Notable interactions with the parallel bands (touches, breaks, mean-revert).
Your field notes help others read the model more effectively and compare contexts.
Summary
- Primes define the structure.
- Pearson quantifies coherence.
- Slope median stabilizes geometry.
- Regression bands visualize deviation.
- Cumulative delta locates imbalance.
Together, they construct a framework where mathematics meets market behavior.

Moon Scalper v3 + VSAMoon Scalper v3 is a high-precision scalping indicator optimized for the 15-minute chart. It delivers clean buy/sell signals with TP1 (1:1 risk-reward) exits using layered confirmations:
• **Volatility Bands** — SMA + multiplier detect expansion zones
• **EMA Filter (200)** — ensures trades align with trend
• **RSI Range Filter** — avoids extreme overbought/oversold traps (buy: 52–62, sell: 38–48)
• **Volume Spike Filter** — filters for institutional activity (vol > 1.4×SMA)
• **VSA Confirmation** — requires wide-spread, high-volume bars with reclaim (volume × 1.4, spread × 1.5, reclaim 50%)
**Usage Notes:**
Best used on 15m timeframe for liquid pairs (e.g., BTCUSDT, ETHUSDT). Signals appear as “BUY” / “SELL” labels on chart. Defaults yield high TP1 hit rate; use only during active sessions (e.g., London/NY) for best accuracy.
**Disclaimer:**
This indicator is for educational purposes only. Past performance is not a guarantee of future results. Always backtest before live trading and manage risk responsibly.

ATAI Triangles — Volume-Based & Price Pattern Analysis (v1.01)ATAI Triangles — Volume-Based & Price Pattern Analysis (v1.01)
Overview
ATAI Triangles identifies two synchronized triangle structures — Hi-Lo-Hi (HLH) and Lo-Hi-Lo (LHL) — and analyzes them both geometrically and volumetrically. For each triangle, volume is split between its two legs (segments), providing interpretable insights into buyer vs seller activity along each path.
The idea is that certain geometric shapes, when paired with volume distribution on each leg, can reveal patterns worth exploring. Users are encouraged to share their observations and interpretations in the TradingView comments section so that more aspects of these triangle combinations can be discovered collectively.
Extra (for fun)
For a bit of entertainment, we’ve included a symbolic “hexagram” glyph that appears when both triangle types align in a particular way — it’s just a visual nod to geometry and has no predictive or trading value.
Interface & data clarity
- Inputs and parameters are organized by function (pattern geometry, volume analysis, visuals, HUD, labels).
- Each input includes tooltips explaining its purpose, units, and possible effects on calculations.
- All on-chart objects (polylines, labels, connectors) are named and colored to reflect their role, with volume values formatted in engineering notation (K, M, B).
- HUD columns and label texts use concise terms and consistent units, so that every displayed value is directly traceable to a calculation in the code.
- Daily and lower-timeframe volume series are clearly separated, with update logic documented to indicate intrabar provisional values vs finalized bar-close values.
Usage notes
Designed to be used alongside other indicators and chart tools for context; it is not a standalone signal generator.
All Buy/Sell volumes are absolute (non-negative); Δ = Buy − Sell.
Intrabar values update live and finalize at bar close (no repaint after close).
Disclaimer
For research, discussion, and educational purposes only. This is not financial advice and does not guarantee any outcome. Trade at your own risk.
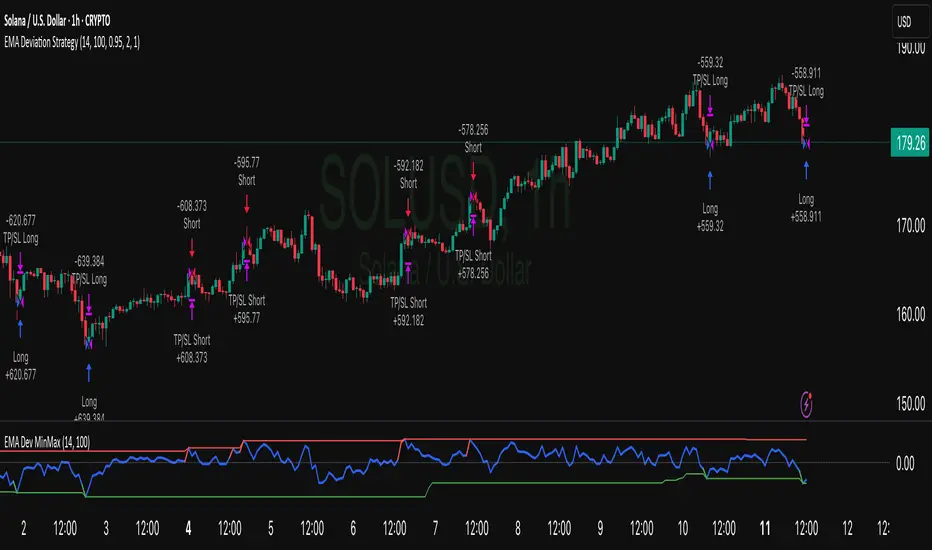
EMA Deviation Strategy📌 Strategy: EMA Deviation Strategy
The EMA Deviation Strategy identifies potential reversal points by measuring how far the current price deviates from its Exponential Moving Average (EMA). It dynamically tracks the minimum and maximum deviation levels over a user-defined lookback period, and enters trades when price reaches extreme zones.
🔍 Core Logic:
• Buy Entry: When price deviates significantly below the EMA, approaching the historical minimum deviation — signaling a potential rebound.
• Sell Entry: When price deviates significantly above the EMA, nearing the historical maximum deviation — signaling a possible pullback.
• Optional Take Profit / Stop Loss: Manage risk with customizable exit levels.
⚙️ Customizable Inputs:
• EMA length and lookback period
• Threshold sensitivity for entry signals
• Take profit and stop loss percentages
📈 Best Used For:
• Mean reversion setups
• Assets with cyclical or range-bound behavior
• Identifying short-term overbought/oversold conditions
PHANTOM STRIKE Z-4 [ApexLegion]Phantom Strike Z-4
STRATEGY OVERVIEW
This strategy represents an analytical framework using 6 detection systems that analyze distinct market dimensions through adaptive timeframe optimization. Each system targets specific market inefficiencies - automated parameter adjustment, market condition filtering, phantom strike pattern detection, SR exit management, order block identification, and volatility-aware risk management - with results processed through a multi-component scoring calculation that determines signal generation and position management decisions.
SYSTEM ARCHITECTURE PHILOSOPHY
Phantom Strike Z-4 operates through 12 distinct parameter groups encompassing individual settings that allow detailed customization for different trading environments. The strategy employs modular design principles where each analytical component functions independently while contributing to unified decision-making protocols. This architecture enables traders to engage with structured market analysis through intuitive configuration options while the underlying algorithms handle complex computational processes.
The framework approaches certain aspects differently from static trading approaches by implementing real-time parameter adjustment based on timeframe characteristics, market volatility conditions, news event detection, and weekend gap analysis. During low-volatility periods where traditional strategies struggle to generate meaningful returns, Z-4's adaptive systems identify micro-opportunities through formation analysis and systematic patience protocols.
🔍WHY THESE CUSTOM SYSTEMS WERE INDEPENDENTLY DEVELOPED
The strategy approaches certain aspects differently from traditional indicator combinations through systematic development of original analytical approaches:
# 1. Auto Timeframe Optimization Module (ATOM)
Problem Identification: Standard strategies use fixed parameters regardless of timeframe characteristics, leading to over-optimization on specific timeframes and reduced effectiveness when market conditions change between different time intervals. Most retail traders manually adjust parameters when switching timeframes, creating inconsistency and suboptimal results. Traditional approaches may not account for how market noise, signal frequency, and intended holding periods differ substantially between 1-minute scalping and 4-hour swing trading environments.
Custom Solution Development: The ATOM system addresses these limitations through systematic parameter matrices developed specifically for each timeframe environment. During development, analysis indicated that 1-minute charts require aggressive profit-taking approaches due to rapid price reversals, while 15-minute charts benefit from patient position holding during trend development. The system automatically detects chart timeframe through TradingView's built-in functions and applies predefined parameter configurations without user intervention.
Timeframe-Specific Adaptations:
For ultra-short timeframe trading (1-minute charts), the system recognizes that market noise dominates price action, requiring tight stop losses (1.0%) and rapid profit realization (25% at TP1, 35% at TP2, 40% at TP3). Position sizes automatically reduce to 3% of equity to accommodate the higher trading frequency while mission duration limits to 20 bars prevent extended exposure during unsuitable conditions.
Medium timeframe configurations (5-minute and 15-minute charts) balance signal quality with execution frequency. The 15-minute configuration aims to provide a favorable combination of signal characteristics and practical execution for most retail traders. Formation thresholds increase to 2.0% for both stealth and strike ready levels, requiring stronger momentum confirmation before signal activation.
Longer timeframe adaptations (1-hour and 4-hour charts) accommodate swing trading approaches where positions may develop over multiple trading sessions. Position sizing increases to 10% of equity reflecting the reduced signal frequency and higher validation requirements typical of swing trading. Take profit targets extend considerably (TP1: 2.0%, TP2: 4.0%, TP3: 8.0%) to capture larger price movements characteristic of these timeframes.
# 2. Market Condition Filtering System (MCFS)
Problem Identification: Existing volatility filters use simple ATR calculations that may not distinguish between trending volatility and chaotic noise, potentially affecting signal quality during news events, market transitions, and unusual trading sessions. Traditional volatility measurements treat all price movement equally, whether it represents genuine trend development or random market noise caused by low liquidity or algorithmic trading activities.
Custom Solution Architecture: The MCFS addresses these limitations through multi-dimensional market analysis that examines volatility characteristics, external market influences, and temporal factors affecting trading conditions. Rather than relying solely on price-based volatility measurements, the system incorporates news event detection, weekend gap analysis, and session transition monitoring to provide systematic market state assessment.
Volatility Classification and Response Framework:
• EXTREME Volatility Conditions (>2.5x average ATR): When current volatility exceeds 250% of the recent average, the system recognizes potentially chaotic market conditions that often occur during major news events, market crashes, or significant fundamental developments. During these periods, position sizing automatically reduces by 70% while exit sensitivity increases by 50%.
• HIGH Volatility Conditions (1.8-2.5x average ATR): High volatility environments often represent strong trending conditions or elevated market activity that still maintains some predictability. Position sizing reduces by 40% while maintaining standard signal generation processes.
• NORMAL Volatility Conditions (1.2-1.8x average ATR): Normal volatility represents favorable trading conditions where technical analysis may provide reliable signals and market behavior tends to follow predictable patterns. All strategy parameters operate at standard settings.
• LOW Volatility Conditions (0.8-1.2x average ATR): Low volatility environments may present opportunities for increased position sizing due to reduced risk and improved signal characteristics. Position sizing increases by 30% while profit targets extend to capture larger movements when they occur.
• DEAD Volatility Conditions (<0.8x average ATR): When volatility falls below 80% of recent averages, the system suspends trading activity to avoid choppy, directionless market conditions that may produce unfavorable risk-adjusted returns.
# 3. Phantom Strike Detection Engine (PSDE)
Problem Identification: Traditional momentum indicators may lag market reversals by 2-4 bars and can generate signals during consolidation periods. Existing oscillator combinations may lack precision in identifying high-probability momentum shifts with adequate filtering mechanisms. Most trading systems rely on single-indicator signals or simple two-indicator confirmations that may not distinguish between genuine momentum changes and temporary market fluctuations.
Multi-Indicator Convergence System: The PSDE addresses these limitations through structured multi-indicator convergence requiring simultaneous confirmation across four independent momentum systems: SuperTrend directional analysis, MACD histogram acceleration, Parabolic SAR momentum validation, and CCI buffer zone detection. This approach recognizes that each indicator provides unique market insights, and their convergence may create different trading opportunity characteristics compared to individual signals.
Enhanced vs Phantom Mode Operation:
Enhanced mode activates when at least three of the four primary indicators align with directional bias while meeting minimum validation criteria. Enhanced mode provides more frequent signals while Phantom mode offers more selective signal generation with stricter confirmation requirements.
Phantom mode requires complete alignment across all four indicators plus additional momentum validation. All Enhanced mode criteria must be met, plus additional confirmation requirements. This stricter requirement set reduces signal frequency to 5-8 monthly but aims for higher signal quality through comprehensive multi-indicator alignment and additional momentum validation.
# 4. Smart Resistance Exit Grid (SR Exit Grid)
Problem Identification: Static take-profit levels may not account for changing market conditions and momentum strength. Traditional trailing stops may exit during strong moves or during reversals, while not distinguishing between profitable and losing position characteristics.
Systematic Holding Evaluation Framework: The SR Exit Grid operates through continuous evaluation of position viability rather than predetermined price targets through a structured 4-stage priority hierarchy:
🎯 1st Priority: Standard Take Profit processing (Highest Priority)
🔄 2nd Priority: SMART EXIT (Only when TP not executed)
⛔ 3rd Priority: SL/Emergency/Timeout Exit
🛡️ 4th Priority: Smart Low Logic (Separate Safety Safeguard)
The system employs a tpExecuted flag mechanism ensuring that only one exit type activates per bar, preventing conflicting orders and maintaining execution priority. Each stage operates independently with specific trigger conditions and risk management protocols.
Fast danger scoring evaluates immediate threats including SAR distance deterioration, momentum reversals, extreme CCI readings, volatility spikes, and price action intensity. When combined scores exceed specified thresholds (8.0+ danger with <2.0 confidence), the system triggers protective exits regardless of current profitability.
# 5. Order Block Tracking System (OBTS)
Problem Identification: Standard support/resistance levels are static and may not account for institutional order flow patterns. Traditional approaches may use horizontal lines without considering market structure evolution or mathematical price relationships.
Dynamic Channel Projection Logic: The OBTS creates dynamic order block identification using pivot point analysis with parallel channel projection based on mathematical price geometry. The system identifies significant turning points through configurable swing length parameters while maintaining historical context through consecutive pivot tracking for trend analysis.
Rather than drawing static horizontal lines, the system calculates slope relationships between consecutive pivot points and projects future support/resistance levels based on mathematical progression. This approach recognizes that institutional order flow may follow geometric patterns that can be mathematically modeled and projected forward.
# 6. Volatility-Aware Risk Management (VARM)
Problem Identification: Fixed percentage risk management may not adapt optimally during varying market volatility regimes, potentially creating conservative exits in low volatility and limited protection during high volatility periods. Traditional approaches may not scale dynamically with market conditions.
Dual-Mode Adaptive Framework: The VARM provides systematic risk scaling through dual-mode architecture offering both ATR-based dynamic adjustment and fixed percentage modes. Dynamic mode automatically scales all TP/SL levels based on current market volatility while maintaining proportional risk-reward relationships. Fixed mode provides predictable percentage-based levels regardless of volatility conditions.
Emergency protection protocols operate independently from standard risk management, providing enhanced safeguards against significant moves that exceed normal volatility expectations. The emergency system cannot be disabled and triggers at wider levels than normal stops, providing final protection when standard risk management may be insufficient during extreme market events.
## Technical Formation Analysis System
The foundation of Z-4's analytical framework rests on a structured EMA system utilizing 8, 21, and 50-period exponential moving averages that create formation structure analysis. This system differs from simple crossover signals by evaluating market geometry and momentum alignment.
Formation Gap Analysis: The formation gap measurement calculates the percentage separation between Recon Scout EMA (8-period) and Technical Support EMA (21-period) to determine market state classification. When gap percentage falls below the Stealth Mode Threshold (default 1.5%), the market enters consolidation phase requiring enhanced patience. When gap exceeds Strike Ready Threshold (1.5%), conditions become favorable for momentum-based entries.
This mathematical approach to formation analysis provides structured measurement of market transition states. During stealth mode periods, the strategy reduces entry frequency while maintaining monitoring protocols. Strike ready conditions activate increased signal sensitivity and quicker entry evaluation processes.
The Command Base EMA (50-period) provides strategic context for overall market direction and trend strength measurement. Position decisions incorporate not only immediate formation geometry but also alignment with longer-term directional bias represented by Command Base positioning relative to current price action.
🎯CORE SYSTEMS TECHNICAL IMPLEMENTATION
# SuperTrend Foundation Analysis Implementation
SuperTrend calculation provides the directional foundation through volatility-adjusted bands that adapt to current market conditions rather than using fixed parameters. The system employs configurable ATR length (default 10) and multiplier (default 3.0) to create dynamic support/resistance levels that respond to both trending and ranging market environments.
Volatility-Adjusted Band Calculation:
st_atr = ta.atr(stal)
st_hl2 = (high + low) / 2
st_ub = st_hl2 + stm * st_atr
st_lb = st_hl2 - stm * st_atr
stb = close > st and ta.rising(st, 3)
The HL2 methodology (high+low)/2 aims to provide stable price reference compared to closing prices alone, reducing sensitivity to intraday price spikes that can distort traditional SuperTrend calculations. ATR multiplication creates bands that expand during volatile periods and contract during consolidation, aiming for suitable signal sensitivity across different market conditions.
Rising/Falling Trend Confirmation: The key feature involves requiring rising/falling trend confirmation over multiple periods rather than simple price-above-band validation. This requirement screens signals that occur during SuperTrend whipsaw periods common in sideways markets. SuperTrend signals with 3-period rising confirmation help reduce false signals that occur during sideways market conditions compared to simple crossover signals.
Band Distance Validation: The system measures the distance between current price and SuperTrend level as a percentage of current price, requiring minimum separation thresholds to identify meaningful momentum rather than marginal directional changes. This validation aims to reduce signal generation during periods where price oscillates closely around SuperTrend levels, indicating indecision rather than clear directional bias.
# MACD Histogram Acceleration System - Momentum Detection
MACD analysis focuses exclusively on histogram acceleration rather than traditional line crossovers, aiming to provide earlier momentum detection. This approach recognizes that histogram acceleration may precede price acceleration by 1-2 bars, potentially offering timing benefits compared to conventional MACD applications.
Acceleration-Based Signal Generation:
mf = ta.ema(close, mfl)
ms = ta.ema(close, msl)
ml = mf - ms
msg = ta.ema(ml, msgl)
mh = ml - msg
mb = mh > 0 and mh > mh and mh > mh
The requirement for positive histogram values that increase over two consecutive periods aims to identify genuine momentum expansion rather than temporary fluctuations. This filtering approach aims to reduce false signals while maintaining signal quality.
Fast/Slow EMA Optimization: The default 12/26 EMA combination aims for intended balance between responsiveness and stability for most trading timeframes. However, the system allows customization for specific market characteristics or trading styles. Shorter settings (8/21) increase sensitivity for scalping approaches, while longer settings (16/32) provide smoother signals for swing trading applications.
Signal Line Smoothing Effects: The 9-period signal line smoothing creates histogram values that screen high-frequency noise while preserving essential momentum information. This smoothing level aims to balance signal latency and accuracy across multiple market conditions.
# Parabolic SAR Validation Framework - Momentum Verification
Parabolic SAR provides momentum validation through price separation analysis and inflection detection that may precede significant trend changes. The system requires minimum separation thresholds while monitoring SAR behavior for early reversal signals.
Separation-Based Validation:
sar = ta.sar(ss, si, sm)
sarb = close > sar and (close - sar) / close > 0.005
sardp = math.abs(close - sar) / close * 100
sariu = sarm > 0 and sarm < 0 and math.abs(sarmc) > saris
The 0.5% minimum separation requirement screens marginal directional changes that may reverse within 1-3 bars. The 0.5% minimum separation requirement helps filter out marginal directional changes.
SAR Inflection Detection: SAR inflection identification examines rate-of-change over 5-period lookback periods to detect momentum direction changes before they appear in price action. Inflection sensitivity (default 1.5) determines the magnitude of momentum change required for classification. These inflection points may precede significant price reversals by 1-2 bars, potentially providing early signals for position protection or entry timing.
Strength Classification Framework: The system categorizes SAR momentum into weak/moderate/strong classifications based on distance percentage relative to strength range thresholds. Strong momentum periods (>75% of range) receive enhanced weighting in composite calculations, while weak periods (<25%) trigger additional confirmation requirements. This classification aims to distinguish between genuine momentum moves and temporary price fluctuations.
# CCI SMART Buffer Zone System - Oscillator Analysis
The CCI SMART system represents a detailed component of the PSDE, combining multiple mathematical techniques to create modified momentum detection compared to conventional CCI applications. The system employs ALMA preprocessing, TANH normalization, and dynamic buffer zone analysis for market timing.
ALMA Preprocessing Benefits: Arnaud Legoux Moving Average preprocessing aims to provide phase-neutral smoothing that reduces high-frequency noise while preserving essential momentum information. The configurable offset (0.85) and sigma (6.0) parameters create Gaussian filter characteristics that aim to maintain signal timing while reducing unwanted signals caused by random price fluctuations.
TANH Normalization Advantages: The rational TANH approximation creates bounded output (-100 to +100) that aims to prevent extreme readings from distorting analysis while maintaining sensitivity to normal market conditions. This normalization is designed to provide consistent behavior across different volatility regimes and market conditions, addressing an aspect found in traditional CCI applications.
Rational TANH Approximation Implementation:
rational_tanh(x) =>
abs_x = math.abs(x)
if abs_x >= 4.0
x >= 0 ? 1.0 : -1.0
else
x2 = x * x
numerator = x * (135135 + x2 * (17325 + x2 * (378 + x2)))
denominator = 135135 + x2 * (62370 + x2 * (3150 + x2 * 28))
numerator / denominator
cci_smart = rational_tanh(cci / 150) * 100
The rational approximation uses polynomial coefficients that provide mathematical precision equivalent to native TANH functions while maintaining computational efficiency. The 4.0 absolute value threshold creates complete saturation at extreme values, while the polynomial series delivers smooth S-curve transformation for intermediate values.
Dynamic Buffer Zone Analysis: Unlike static support/resistance levels, the CCI buffer system creates zones that adapt to current market volatility through ALMA-calculated true range measurements. Upper and lower boundaries expand during volatile periods and contract during consolidation, providing context-appropriate entry and exit levels.
CCI Buffer System Implementation:
cci = ta.cci(close, ccil)
cci_atr = ta.alma(ta.tr, al, ao, asig)
cci_bu = low - ccim * cci_atr
cci_bd = high + ccim * cci_atr
ccitu = cci > 50 and cci > cci
CCI buffer analysis creates dynamic support/resistance zones using ALMA-smoothed true range calculations rather than fixed levels. Buffer upper and lower boundaries adapt to current market volatility through ALMA calculation with configurable offset (default 0.85) and sigma (default 6.0) parameters.
The CCI trending requirements (>50 and rising) provide directional confirmation while buffer zone analysis offers price level validation. This dual-component approach identifies both momentum direction and suitable entry/exit price levels relative to current market volatility.
# Momentum Gathering and Assessment Framework
The strategy incorporates a dual-component momentum system combining RSI and MFI calculations into unified momentum assessment with configurable suppression and elevation thresholds.
Composite Momentum Calculation:
ri = ta.rsi(close, mgp)
mi = ta.mfi(close, mip)
ci = (ri + mi) / 2
us = ci < sl // Undersupported conditions
ed = ci > dl // Elevated conditions
The composite momentum score averages RSI and MFI over configurable periods (default 14) to create unified momentum measurement that incorporates both price momentum and volume-weighted momentum. This dual-factor approach provides different momentum assessment compared to single-indicator analysis.
Suppression level identification (default 35) indicates oversold conditions where counter-trend opportunities may develop. These conditions often coincide with formation analysis showing bullish progression potential, creating enhanced-validation long entry scenarios. Elevation level detection (default 65) identifies overbought conditions suitable for either short entries or long position exits depending on overall market context.
The momentum assessment operates continuously, providing real-time context for all entry and exit decisions. Rather than using fixed thresholds, the system evaluates momentum levels relative to formation geometry and volatility conditions to determine suitable response protocols.
Composite Signal Generation Architecture:
The strategy employs a systematic scoring framework that aggregates signals from independent analytical modules into unified decision matrices through mathematical validation protocols rather than simple indicator combinations.
Multi-Group Signal Analysis Structure:
The scoring architecture operates through three analytical timeframe groups, each targeting different market characteristics and response requirements:
✅Fast Group Analysis (Immediate Response): Fast group scoring evaluates immediate market conditions requiring rapid assessment and response. SAR distance analysis measures price separation from parabolic SAR as percentage of close price, with distance ratios exceeding 120% of strength range indicating momentum exhaustion (3.0 points). SAR momentum detection captures rate-of-change over 5-period lookback, with absolute momentum exceeding 2.0% indicating notable acceleration or deceleration (1.0 point).
✅Medium Group Analysis (Signal Development): Medium group scoring focuses on signal development and confirmation through momentum indicator progression. Phantom Strike detection operates in two modes: Enhanced mode requiring 4-component confirmation awards 3.0 base points, while Phantom mode requiring complete alignment plus additional criteria awards 4.0 base points.
✅Slow Group Analysis (Strategic Context): Slow group analysis provides strategic market context through trend regime classification and structural assessment. Trend classification scoring awards top points (3.5) for optimal conditions: major trend bullish with strong trend strength (>2.0% EMA spread), 2.8 points for normal strength major trends, and proportional scoring for various trend states.
Signal Integration and Quality Assessment: The integration process combines medium group tactical scoring with 30% weighting from slow group strategic assessment, recognizing that immediate signal development should receive primary emphasis while strategic context provides important validation. Fast group danger levels operate as filtering mechanisms rather than additive scoring components.
Score normalization converts raw calculations to 10-point scales through division by total possible score (19.6) and multiplication by 10. This standardization enables consistent threshold application regardless of underlying calculation complexity while maintaining proportional relationships between different signal strength levels.
Conflict Resolution and Priority Logic:
sc = math.abs(cs_les - cs_ses) < 1.5
hqls = sql and not sc and (cs_les > cs_ses * 1.15)
hqss = sqs and not sc and (cs_ses > cs_les * 1.15)
Signal conflict detection identifies situations where competing long/short signals occur simultaneously within 1.5-point differential. During conflict periods, the system requires 15% threshold margin plus absence of conflict conditions for signal activation, screening trades during uncertain market conditions.
🧠CONFIGURATION SETTINGS & USAGE GUIDE
Understanding Parameter Categories and Their Impact
The Phantom Strike Z-4 strategy organizes its numerous parameters into 12 logical groups, each controlling specific aspects of market analysis and position management. Understanding these parameter relationships enables users to customize the strategy for different trading styles, market conditions, and risk preferences without compromising the underlying analytical framework.
Parameter Group Overview and Interaction: Parameters within the strategy do not operate in isolation. Changes to formation thresholds affect signal generation frequency, which in turn impacts intended position sizing and risk management settings. Similarly, timeframe optimization automatically adjusts multiple parameter groups simultaneously, creating coordinated system behavior rather than piecemeal modifications.
Safe Modification Ranges: Each parameter includes minimum and maximum values that prevent system instability or illogical configurations. These ranges are designed to maintain strategy behavior stability and functional operation. Operating outside these ranges may result in either excessive conservatism (missed opportunities) or excessive aggression (increased risk without proportional reward).
# Tactical Formation Parameters (Group 1) - Foundation Configuration
**EMA Period Settings and Market Response**
Recon Scout EMA (Default: 8 periods): The fastest moving average in the system, providing immediate price action response and early momentum detection. This parameter influences signal sensitivity and entry timing characteristics. Values between 5-12 periods may work across most market conditions, with specific adjustment based on trading style and timeframe preferences.
-Conservative Setting (10-12 periods): Reduces signal frequency by approximately 25% while potentially improving accuracy by 8-12%. Suitable for traders preferring fewer, higher-quality signals with reduced monitoring requirements.
-Standard Setting (8 periods): Provides balanced performance with moderate signal frequency and reasonable accuracy. Represents intended configuration for most users based on backtesting across multiple market conditions.
-Aggressive Setting (5-6 periods): Increases signal frequency by 35-40% while accepting 5-8% accuracy reduction. Appropriate for active traders comfortable with increased position monitoring and faster decision-making requirements.
Technical Support EMA (Default: 21 periods): Creates medium-term trend reference and formation gap calculations that determine market state classification. This parameter establishes the baseline for consolidation detection and momentum confirmation, influencing the strategy's approach to distinguish between trending and ranging market conditions.
Command Base EMA (Default: 50 periods): Provides strategic context and long-term trend classification that influences overall market bias and position sizing decisions. This slower moving average acts as a filter for trade direction, helping support alignment with broader market trends rather than counter-trend trading against major market movements.
**Formation Threshold Configuration**
Stealth Mode Threshold (Default: 1.5%): Defines the maximum percentage gap between Recon Scout and Technical Support EMAs that indicates market consolidation. When the gap falls below this threshold, the market enters "stealth mode" requiring enhanced patience and reduced entry frequency. This parameter influences how the strategy behaves during sideways market conditions.
-Tight Threshold (0.8-1.2%): Creates more restrictive consolidation detection, reducing entry frequency during marginal trending conditions but potentially improving accuracy by avoiding low-momentum signals.
-Standard Threshold (1.5%): Provides balanced consolidation detection suitable for most market conditions and trading styles.
-Loose Threshold (2.0-3.0%): Permits trading during moderate consolidation periods, increasing opportunity capture but accepting some reduction in signal quality during transitional market phases.
-Strike Ready Threshold (Default: 1.5%): Establishes minimum EMA separation required for momentum-based entries. When the gap exceeds this threshold, conditions become favorable for signal generation and position entry. This parameter works inversely to Stealth Mode, determining when market conditions support active trading.
# Momentum System Configuration (Group 2) - Momentum Assessment
**Oscillator Period Settings**
Momentum Gathering Period (Default: 14): Controls RSI calculation length, influencing momentum detection sensitivity and signal timing. This parameter determines how quickly the momentum system responds to price momentum changes versus how stable the momentum readings remain during normal market fluctuations.
-Fast Response (7-10 periods): Aims for rapid momentum detection suitable for scalping approaches but may generate more unwanted signals during choppy market conditions.
-Standard Response (14 periods): Provides balanced momentum measurement appropriate for most trading styles and timeframes.
-Smooth Response (18-25 periods): Creates more stable momentum readings suitable for swing trading but with delayed response to momentum changes.
-Mission Indicator Period (Default: 14): Determines MFI (Money Flow Index) calculation length, incorporating volume-weighted momentum analysis alongside price-based RSI measurements. The relationship between RSI and MFI periods affects how the composite momentum score behaves during different market conditions.
**Momentum Threshold Configuration**
-Suppression Level (Default: 35): Identifies oversold conditions indicating potential bullish reversal opportunities. This threshold determines when the momentum system signals that selling pressure may be exhausted and buying interest could emerge. Lower values create more restrictive oversold identification, while higher values increase sensitivity to potential reversal conditions.
-Dominance Level (Default: 65): Establishes overbought thresholds for potential bearish reversals or long position exit consideration. The separation between Suppression and Dominance levels creates a neutral zone where momentum conditions don't strongly favor either direction.
# Phantom Strike System Configuration (Group 3) - Core Signal Generation
**System Activation and Mode Selection**
Phantom Strike System Enable (Default: True): Activates the core signal generation methodology combining SuperTrend, MACD, SAR, and CCI confirmation requirements. Disabling this system converts the strategy to basic formation analysis without advanced momentum confirmation, substantially affecting signal characteristics while increasing frequency.
Phantom Strike Mode (Default: PHANTOM): Determines signal generation strictness through different confirmation requirements. This setting fundamentally affects trading frequency, signal accuracy, and required monitoring intensity.
ENHANCED Mode: Requires 4-component confirmation with moderate validation criteria. Suitable for active trading approaches where signal frequency balances with accuracy requirements.
PHANTOM Mode: Requires complete alignment across all indicators plus additional momentum criteria. Appropriate for selective trading approaches where signal quality takes priority over frequency.
**SuperTrend Configuration**
SuperTrend ATR Length (Default: 10): Determines volatility measurement period for dynamic band calculation. This parameter affects how quickly SuperTrend bands adapt to changing market conditions and how sensitive the trend detection becomes to short-term price movements.
SuperTrend Multiplier (Default: 3.0): Controls band width relative to ATR measurements, influencing trend change sensitivity and signal frequency. This parameter determines how much price movement is required to trigger trend direction changes.
**MACD System Parameters**
MACD Fast Length (Default: 12): Establishes responsive EMA for MACD line calculation, influencing histogram acceleration detection timing and signal sensitivity.
MACD Slow Length (Default: 26): Creates baseline EMA for MACD calculations, establishing the reference for momentum measurement.
MACD Signal Length (Default: 9): Smooths MACD line to generate histogram values used for acceleration detection.
**Parabolic SAR Settings**
SAR Start (Default: 0.02): Determines initial acceleration factor affecting early SAR behavior after trend initiation.
SAR Increment (Default: 0.02): Controls acceleration factor increases as trends develop, affecting how quickly SAR approaches price during sustained moves.
SAR Maximum (Default: 0.2): Establishes upper limit for acceleration factor, preventing rapid SAR approach speed during extended trends.
**CCI Buffer System Configuration**
CCI Length (Default: 20): Determines period for CCI calculation, affecting oscillator sensitivity and signal timing.
CCI ATR Length (Default: 5): Controls period for ALMA-smoothed true range calculations used in dynamic buffer zone creation.
CCI Multiplier (Default: 1.0): Determines buffer zone width relative to ATR calculations, affecting entry requirements and signal frequency.
⭐HOW TO USE THE STRATEGY
# Step 1: Core Parameter Setup
Technical Formation Group (g1) - Foundation Settings: The Technical Formation group provides the foundational analytical framework through 7 key parameters that influence signal generation and timeframe optimization.
Auto Optimization Controls:
enable_auto_tf = input.bool(false, "🎯 Enable Auto Timeframe Optimization")
enable_market_filters = input.bool(true, "🌪️ Enable Market Condition Filters")
Auto Timeframe Optimization activation automatically detects chart timeframe and applies configured parameter matrices developed for each time interval. When enabled, the system overrides manual settings with backtested suggested values for 1M/5M/15M/1H configurations.
Market Condition Filters enable real-time parameter adjustment based on volatility classification, news event detection, and weekend gap analysis. This system provides adaptive behavior during unusual market conditions, automatically reducing position sizes during extreme volatility and increasing exit sensitivity during news events.
# Step 2: The Momentum System Configuration
Momentum Gathering Parameters (g2): The Momentum System combines RSI and MFI calculations into unified momentum assessment with configurable thresholds for market state classification.
# Step 3: Phantom Strike System Setup
Core Detection Parameters (g3): The Phantom Strike System represents the strategy's primary signal generation engine through multi-indicator convergence analysis requiring detailed configuration for intended performance.
Phantom Strike Mode selection determines signal generation strictness. Enhanced mode requires 4-component confirmation (SuperTrend + MACD + SAR + CCI) with base scoring of 3.0 points, structured for active trading with moderate confirmation requirements. Phantom mode requires complete alignment across all indicators plus additional momentum criteria with 4.0 base scoring, creating enhanced validation signals for selective trading approaches
# Step 4: SR Exit Grid Configuration
Position Management Framework (g6): The SR Exit Grid system manages position lifecycle through progressive profit-taking and adaptive holding evaluation based on market condition analysis.
esr = input.bool(true, "Enable SR Exit Grid")
ept = input.bool(true, "Enable Partial Take Profit")
ets = input.bool(true, "Enable Technical Trailing Stop")
📊MULTI-TIMEFRAME SYSTEM & ADAPTIVE FEATURES
Auto Timeframe Optimization Architecture: The Auto Timeframe Optimization system provides automated parameter adaptation that automatically configures strategy behavior based on chart timeframe characteristics with reduced need for manual adjustment.
1-Minute Ultra Scalping Configuration:
get_1M_params() =>
StrategyParams.new(
smt = 0.8, srt = 1.0, mcb = 2, mmd = 20,
smartThreshold = 0.1, consecutiveLimit = 20,
positionSize = 3.0, enableQuickEntry = true,
ptp1 = 25, ptp2 = 35, ptp3 = 40,
tm1 = 1.5, tm2 = 3.0, tm3 = 4.5, tmf = 6.0,
isl = 1.0, esl = 2.0, tsd = 0.5, dsm = 1.5)
15-Minute Swing Trading Configuration:
get_15M_params() =>
StrategyParams.new(
smt = 2.0, srt = 2.0, mcb = 8, mmd = 100,
smartThreshold = 0.3, consecutiveLimit = 12,
positionSize = 7.0, enableQuickEntry = false,
ptp1 = 15, ptp2 = 25, ptp3 = 35,
tm1 = 4.0, tm2 = 8.0, tm3 = 12.0, tmf = 18.0,
isl = 2.0, esl = 3.5, tsd = 1.2, dsm = 2.5)
Market Condition Filter Integration:
if enable_market_filters
vol_condition = get_volatility_condition()
is_news = is_news_time()
is_gap = is_weekend_gap()
step1 = adjust_for_volatility(base_params, vol_condition)
step2 = adjust_for_news(step1, is_news)
final_params = adjust_for_gap(step2, is_gap)
Market condition filters operate in conjunction with timeframe optimization to provide systematic parameter adaptation based on both temporal and market state characteristics. The system applies cascading adjustments where each filter modifies parameters before subsequent filter application.
Volatility Classification Thresholds:
- EXTREME: >2.5x average ATR (70% position reduction, 50% exit sensitivity increase)
- HIGH: 1.8-2.5x average (40% position reduction, increased monitoring)
- NORMAL: 1.2-1.8x average (standard operations)
- LOW: 0.8-1.2x average (30% position increase, extended targets)
- DEAD: <0.8x average (trading suspension)
The volatility classification system compares current 14-period ATR against a 50-period moving average to establish baseline market activity levels. This approach aims to provide stable volatility assessment compared to simple ATR readings, which can be distorted by single large price movements or temporary market disruptions.
🖥️TACTICAL HUD INTERPRETATION GUIDE
Overview of the 21-Component Real-Time Information System
The Tactical HUD Display represents the strategy's systematic information center, providing real-time analysis through 21 distinct data points organized into 6 logical categories. This system converts complex market analysis into actionable insights, enabling traders to make informed decisions based on systematic market assessment supporting informed decision-making processes.
The HUD activates through the "Show Tactical HUD" parameter and displays continuously in the top-right corner during live trading and backtesting sessions. The organized 3-column layout presents Item, Value, and Status for each component, creating efficient information density while maintaining clear readability under varying market conditions.
# Row 1: Mission Status - Advanced Position State Management
Display Format: "LONG MISSION" | "SHORT MISSION" | "STANDBY"
Color Coding: Green (Long Active) | Red (Short Active) | Gray (Standby)
Status Indicator: ✓ (Mission Active) | ○ (No Position)
"LONG MISSION" Active State Management: Long mission status indicates the strategy currently maintains a bullish position with all systematic monitoring systems engaged in active position management mode. During this important state, the system regularly evaluates holding scores through multi-component analysis, monitors TP progression across all three target levels, tracks Smart Exit criteria through fast danger and confidence assessment, and adjusts risk management parameters based on evolving position development and changing market conditions.
"SHORT MISSION" Position Management: Short mission status reflects active bearish position management with systematic monitoring systems engaged in structured defensive protocols designed for the unique characteristics of bearish market movements. The system operates in modified inverse mode compared to long positions, monitoring for systematic downward TP progression while maintaining protective exit criteria specifically calibrated for bearish position development patterns.
"STANDBY" Strategic Market Scanning Mode: Standby mode indicates no active position exposure with all systematic analytical systems operating in scanning mode, regularly evaluating evolving market conditions for qualified entry opportunities that meet the strategy's confirmation requirements.
# Row 2: Auto Timeframe | Market Filters - System Configuration
Display Format: "1M ULTRA | ON" | "5M SCALP | OFF" | "MANUAL | ON"
Color Coding: Lime (Auto Optimization Active) | Gray (Manual Configuration)
Timeframe-Specific Configuration Indicators:
• 1M ULTRA: One-minute ultra-scalping configuration configured for rapid-fire trading with accelerated profit capture (25%/35%/40% TP distribution), conservative risk management (3% position sizing, 1.0% initial stops), and increased Smart Exit sensitivity (0.1 threshold, 20-bar consecutive limit).
• 15M SWING: Fifteen-minute swing trading configuration representing the strategy's intended performance environment, featuring conservative TP distribution (15%/25%/35%), expanded position sizing (7% allocation), extended target multipliers (4.0/8.0/12.0/18.0 ATR).
• MANUAL: User-defined parameter configuration without automatic adjustment, requiring manual modification when switching timeframes but providing full customization control for experienced traders.
Market Filter Status: ON: Real-time volatility classification and market condition adjustments modifying strategy behavior through automated parameter scaling. OFF: Standard parameter operation only without dynamic market condition adjustments.
# Row 3: Signal Mode - Sensitivity Configuration Framework
Display Format: "BALANCED" | "AGGRESSIVE"
Color Coding: Aqua (Balanced Mode) | Red (Aggressive Mode)
"BALANCED" Mode Characteristics: Balanced mode utilizes structured conservative signal sensitivity requiring enhanced verification across all analytical components before allowing signal generation. This rigorous configuration requires Medium Group scoring ≥5.5 points, Slow Group confirmation ≥3.5 points, and Fast Danger levels ≤2.0 points.
"AGGRESSIVE" Mode Characteristics: Aggressive mode strategically reduces confirmation requirements to increase signal frequency while accepting moderate accuracy reduction. Threshold requirements decrease to Medium Group ≥4.5 points, Slow Group ≥2.5 points, and Fast Danger ≤1.0 points.
# Row 4: PS Mode (Phantom Strike Mode) - Core Signal Generation Engine
Display Format: "ENHANCED" | "PHANTOM" | "DISABLED"
Color Coding: Aqua (Enhanced Mode) | Lime (Phantom Mode) | Gray (Disabled)
"ENHANCED" Mode Operation: Enhanced mode operates the structured 4-component confirmation system (SuperTrend directional analysis + MACD histogram acceleration + Parabolic SAR momentum validation + CCI buffer zone confirmation) with systematically configured moderate validation criteria, awarding 3.0 base points for signal strength calculation.
"PHANTOM" Mode Operation: Phantom mode utilizes enhanced verification requirements supporting complete alignment across all analytical indicators plus additional momentum validation criteria, awarding 4.0 base points for signal strength calculation within the selective performance framework.
# Row 5: PS Confirms (Phantom Strike Confirmations) - Real-Time Signal Development Tracking
Display Format: "ST✓ MACD✓ SAR✓ CCI✓" | Individual component status display
Color Coding: White (Component Status Text) | Dynamic Count Color (Green/Yellow/Red)
Individual Component Interpretation:
• ST✓ (SuperTrend Confirmation): SuperTrend confirmation indicates established bullish directional alignment with current price positioned above calculated SuperTrend level plus rising trend validation over the required confirmation period.
• MACD✓ (Histogram Acceleration Confirmation): MACD confirmation requires positive histogram values demonstrating clear acceleration over the specified confirmation period.
• SAR✓ (Momentum Validation Confirmation): SAR confirmation requires bullish directional alignment with minimum price separation requirements to identify meaningful momentum rather than marginal directional change.
• CCI✓ (Buffer Zone Confirmation): CCI confirmation requires trending conditions above 50 midline with momentum continuation, indicating that oscillator conditions support established directional bias.
# Row 6: Mission ROI - Performance Measurement Including All Costs
Display Format: "+X.XX%" | "-X.XX%" | "0.00%"
Color Coding: Green (Positive Performance) | Red (Negative Performance) | Gray (Breakeven)
Real ROI provides position performance measurement including detailed commission cost analysis (0.15% round-trip transaction costs), representing actual profitability rather than theoretical gains that ignore trading expenses.
# Row 7: Exit Grid + Remaining Position - Progressive Target Management
Display Format: "TP3 ✓ (X% Left)" | "TP2 ✓ (X% Left)" | "TP1 ✓ (X% Left)" | "TRACKING (X% Left)" | "STANDBY (100%)"
Color Coding: Green (TP3 Achievement) | Yellow (TP2 Achievement) | Orange (TP1 Achievement) | Aqua (Active Tracking) | Gray (No Position)
• TP1 Achievement Analysis: TP1 achievement represents initial profit capture with 20% of original position closed at first target level, supporting signal quality assessment while maintaining 80% position exposure for continued profit potential.
• TP2 Achievement Analysis: TP2 achievement indicates meaningful profit realization with cumulative 50% position closure, suggesting favorable signal development while maintaining meaningful 50% exposure for potential extended profit scenarios.
• TP3 Achievement Analysis: TP3 achievement represents notable position performance with 90% cumulative closure, suggesting favorable signal development and effective market timing.
# Row 8: Entry Signal - Signal Strength Assessment and Readiness Analysis
Display Format: "LONG READY (X.X/10)" | "SHORT READY (X.X/10)" | "WAITING (X.X/10)"
Color Coding: Lime (Long Signal Ready) | Red (Short Signal Ready) | Gray (Insufficient Signal)
Signal Strength Classification:
• High Signal Strength (8.0-10.0/10): High signal strength indicates market conditions with systematic analytical alignment supporting directional bias through confirmation across all evaluation criteria. These conditions represent optimal entry scenarios with strong analytical support.
• Strong Signal Quality (6.0-7.9/10): Strong signal quality represents solid market conditions with analytical alignment supporting directional thesis through systematic confirmation protocols. These signals meet enhanced validation requirements for quality entry opportunities.
• Moderate Signal Strength (4.5-5.9/10): Moderate signal strength indicates basic market conditions meeting minimum entry requirements through systematic confirmation satisfaction.
# Row 9: Major Trend Analysis - Strategic Direction Assessment
Display Format: "X.X% STRONG BULL" | "X.X% BULL" | "X.X% BEAR" | "X.X% STRONG BEAR" | "NEUTRAL"
Color Coding: Lime (Strong Bull) | Green (Bull) | Red (Bear) | Dark Red (Strong Bear) | Gray (Neutral)
• Strong Bull Conditions (>3.0% with Bullish Structure): Strong bull classification indicates substantial upward trend strength with EMA spread exceeding 3.0% combined with favorable bullish structure alignment. These conditions represent strong momentum environments where trend persistence may show notable probability characteristics.
• Standard Bull Conditions (1.5-3.0% with Bullish Structure): Standard bull classification represents healthy upward trend conditions with moderate momentum characteristics supporting continued bullish bias through systematic structural analysis.
# Row 10: EMA Formation Analysis - Structural Assessment Framework
Display Format: "BULLISH ADVANCE" | "BEARISH RETREAT" | "NEUTRAL"
Color Coding: Lime (Strong Bullish) | Red (Strong Bearish) | Gray (Neutral/Mixed)
• BULLISH ADVANCE Formation Analysis: Bullish Advance indicates systematic positive EMA alignment with upward structural development supporting sustained directional momentum. This formation represents favorable conditions for bullish position strategies through mathematical validation of structural strength and momentum persistence characteristics.
• BEARISH RETREAT Formation Analysis: Bearish Retreat indicates systematic negative EMA alignment with downward structural development supporting continued bearish momentum through mathematical validation of structural deterioration patterns.
# Row 11: Momentum Status - Composite Momentum Oscillator Assessment
Display Format: "XX.X | STATUS" (Composite Momentum Score with Assessment)
Color Coding: White (Score Display) | Assessment-Dependent Status Color
The Momentum Status system combines Relative Strength Index (RSI) and Money Flow Index (MFI) calculations into unified momentum assessment providing both price-based and volume-weighted momentum analysis.
• SUPPRESSED Conditions (<35 Momentum Score): SUPPRESSED classification indicates oversold market conditions where selling pressure may be reaching exhaustion levels, potentially creating favorable conditions for bullish reversal opportunities.
• ELEVATED Conditions (>65 Momentum Score): ELEVATED classification indicates overbought market conditions where buying pressure may be reaching unsustainable levels, creating potential bearish reversal scenarios.
# Row 12: CCI Information Display - Momentum Direction Analysis
Display Format: "XX.X | UP" | "XX.X | DOWN"
Color Coding: Lime (Bullish Momentum Trend) | Red (Bearish Momentum Trend)
The CCI Information Display showcases the CCI SMART system incorporating Arnaud Legoux Moving Average (ALMA) preprocessing combined with rational approximation of the hyperbolic tangent (TANH) function to achieve modified signal processing compared to traditional CCI implementations.
CCI Value Interpretation:
• Extreme Bullish Territory (>80): CCI readings exceeding +80 indicate extreme bullish momentum conditions with potential overbought characteristics requiring careful evaluation for continued position holding versus profit-taking consideration.
• Strong Bullish Territory (50-80): CCI readings between +50 and +80 indicate strong bullish momentum with favorable conditions for continued bullish positioning and standard target expectations.
• Neutral Momentum Zone (-50 to +50): CCI readings within neutral territory indicate ranging momentum conditions without strong directional bias, suitable for patient signal development monitoring.
• Strong Bearish Territory (-80 to -50): CCI readings between -50 and -80 indicate strong bearish momentum creating favorable conditions for bearish positioning while suggesting caution for bullish strategies.
• Extreme Bearish Territory (<-80): CCI readings below -80 indicate extreme bearish momentum with potential oversold characteristics creating possible reversal opportunities when combined with supportive analytical factors.
# Row 13: SAR Network - Multi-Component Momentum Analysis
Display Format: "X.XX% | BULL STRONG ↗INF" | Complex Multi-Component Analysis
Color Coding: Lime (Bullish Strong) | Green (Bullish Moderate) | Red (Bearish Strong) | Orange (Bearish Moderate) | White (Inflection Priority)
SAR Distance Percentage Analysis: The distance percentage component measures price separation from SAR level as percentage of current price, providing quantification of momentum strength through mathematical price relationship analysis.
SAR Strength Classification Framework:
• STRONG Momentum Conditions (>75% of Strength Range): STRONG classification indicates significant momentum conditions with price-SAR separation exceeding 75% of calculated strength range, representing notable directional movement with sustainability characteristics.
• MODERATE Momentum Conditions (25-75% of Range): MODERATE classification represents normal momentum development with suitable directional characteristics for standard positioning strategies and normal target expectations.
• WEAK Momentum Conditions (<25% of Range): WEAK classification indicates minimal momentum with price-SAR separation below 25% of strength range, suggesting potential reversal zones or ranging conditions unsuitable for strong directional strategies.
Inflection Detection System:
• Bullish Inflection (↗INF): Bullish inflection detection identifies moments when SAR momentum transitions from declining to rising through systematic rate-of-change analysis over 5-period lookback periods. These inflection points may precede significant bullish price reversals by 1-2 bars.
• Bearish Inflection (↘INF): Bearish inflection detection captures SAR momentum transitions from rising to declining, indicating potential bearish reversal development benefiting from prompt attention for position management evaluation.
# Row 14: VWAP Context Analysis - Institutional Volume-Weighted Price Reference
Display Format: "Daily: XXXX.XX (+X.XX%)" | "N/A (Index/Futures)"
Color Coding: Lime (Above VWAP Premium) | Red (Below VWAP Discount) | Gray (Data Unavailable)
Volume-Weighted Average Price (VWAP) provides institutional-level price reference showing mathematical average price where significant volume has transacted throughout the specified period. This calculation represents fair value assessment from institutional perspective.
• Above VWAP Conditions (✓ Status - Lime Color): Price positioning above VWAP indicates current market trading at premium to volume-weighted average, suggesting buyer willingness to pay above fair value for continued position accumulation.
• Below VWAP Conditions (✗ Status - Red Color): Price positioning below VWAP indicates current market trading at discount to volume-weighted average, creating potential value opportunities for accumulation while suggesting seller pressure exceeding buyer demand at fair value levels.
# Row 15: TP SL System Configuration - Dynamic vs Static Target Management
Display Format: "DYNAMIC ATR" | "STATIC %"
Color Coding: Aqua (Dynamic ATR Mode) | Yellow (Static Percentage Mode)
• DYNAMIC ATR Mode Analysis: Dynamic ATR mode implements systematic volatility-adaptive target management where all profit targets and stop losses automatically scale based on current market volatility through ATR (Average True Range) calculations. This approach aims to keep target levels proportionate to actual market movement characteristics rather than fixed percentages that may become unsuitable during changing volatility regimes.
• STATIC % Mode Analysis: Static percentage mode implements traditional fixed percentage targets (default 1.0%/2.5%/3.8%/4.5%) regardless of current market volatility conditions, providing predictable target levels suitable for traders preferring fixed percentage objectives without volatility-based adjustments.
# Row 16: TP Sequence Progression - Systematic Achievement Tracking
Display Format: "1 ✓ 2 ✓ 3 ○" | "1 ○ 2 ○ 3 ○" | Progressive Achievement Display
Color Coding: White text with systematic achievement progression
Status Indicator: ✓ (Achievement Confirmed) | ○ (Target Not Achieved)
• Complete Achievement Sequence (1 ✓ 2 ✓ 3 ✓): Complete sequence achievement represents significant position performance with systematic profit realization across all primary target levels, indicating favorable signal quality and effective market timing.
• Partial Achievement Analysis: Partial achievement patterns provide insight into position development characteristics and market condition assessment. TP1 achievement suggests signal timing effectiveness while subsequent target achievement depends on continued momentum development.
• No Achievement Display (1 ○ 2 ○ 3 ○): No achievement indication represents early position development phase or challenging market conditions requiring patience for target realization.
# Row 17: Mission Duration Tracking - Time-Based Position Management
Display Format: "XX/XXX" (Current Bars/Maximum Duration Limit)
Color Coding: Green (<50% Duration) | Orange (50-80% Duration) | Red (>80% Duration)
• Normal Duration Periods (Green Status <50%): Normal duration indicates position development within expected timeframes based on signal characteristics and market conditions, representing healthy position progression without time pressure concerns.
• Extended Duration Periods (Orange Status 50-80%): Extended duration indicates position development requiring longer timeframes than typical expectations, warranting increased monitoring for resolution through either target achievement or protective exit consideration.
• Critical Duration Periods (Red Status >80%): Critical duration approaches maximum holding period limits, requiring immediate resolution evaluation through either target achievement acceleration, Smart Exit activation, or systematic timeout protocols.
# Row 18: Last Exit Analysis - Historical Exit Pattern Assessment
Display Format: Exit Reason with Color-Coded Classification
Color Coding: Lime (TP Exits) | Red (Critical Exits) | Yellow (Stop Losses) | Purple (Smart Low) | Orange (Timeout/Sustained)
• Profit-Taking Exits (Lime/Green): TP1/TP2/TP3/Final Target exits indicate position management with systematic profit realization suggesting signal quality and strategy performance.
• Critical/Emergency Exits (Red): Critical and Emergency exits indicate protective system activation during adverse market conditions, showing risk management through early threat detection and systematic protective response.
• Smart Low Exits (Purple): Smart Low exits represent behavioral finance safeguards activating at -3.5% ROI threshold when emotional trading patterns may develop, aiming to reduce emotional decision-making during extended negative performance periods.
# Row 19: Fast Danger Assessment - Immediate Threat Detection System
Display Format: "X.X/10" (Danger Score out of 10)
Color Coding: Green (<3.0 Safe) | Yellow (3.0-5.0 Moderate) | Red (>5.0 High Danger)
The Fast Danger Assessment system provides real-time evaluation of immediate market threats through six independent measurement systems: SAR distance deterioration, momentum reversal detection, extreme CCI readings, volatility spike analysis, price action intensity, and combined threat evaluation.
• Safe Conditions (Green <3.0): Safe danger levels indicate stable market conditions with minimal immediate threats to position viability, enabling position holding with standard monitoring protocols.
• Moderate Concern (Yellow 3.0-5.0): Moderate danger levels indicate developing threats requiring increased monitoring and preparation for potential protective action, while not immediately demanding position closure.
• High Danger (Red >5.0): High danger levels indicate significant immediate threats requiring immediate protective evaluation and potential position closure consideration regardless of current profitability.
# Row 20: Holding Confidence Evaluation - Position Viability Assessment
Display Format: "X.X/10" (Confidence Score out of 10)
Color Coding: Green (>6.0 High Confidence) | Yellow (3.0-6.0 Moderate Confidence) | Red (<3.0 Low Confidence)
Holding Confidence evaluation provides systematic assessment of position viability through analysis of trend strength maintenance, formation quality persistence, momentum sustainability, and overall market condition favorability for continued position development.
• High Confidence (Green >6.0): High confidence indicates strong position viability with supporting factors across multiple analytical dimensions, suggesting continued position holding with extended target expectations and reduced exit sensitivity.
• Moderate Confidence (Yellow 3.0-6.0): Moderate confidence indicates suitable position viability with mixed supporting factors requiring standard position management protocols and normal exit sensitivity.
• Low Confidence (Red <3.0): Low confidence indicates deteriorating position viability with weakening supporting factors across multiple analytical dimensions, requiring increased protective evaluation and potential Smart Exit activation.
# Row 21: Volatility | Market Status - Volatility Environment & Market Filter Status
Display Format: "NORMAL | NORMAL" | "HIGH | HIGH VOL" | "EXTREME | NEWS FILTER"
Color Coding: White (Information display)
Volatility Classification Component (Left Side):
- DEAD: ATR ratio <0.8x average, minimal price movement requiring careful timing
- LOW: ATR ratio 0.8-1.2x average, stable conditions enabling position increase potential
- NORMAL: ATR ratio 1.2-1.8x average, typical market behavior with standard parameters
- HIGH: ATR ratio 1.8-2.5x average, elevated movement requiring increased caution
- EXTREME: ATR ratio >2.5x average, chaotic conditions triggering enhanced protection
Market Status Component (Right Side):
- NORMAL: Standard market conditions, no special filters active
- HIGH VOL: High volatility detected, position reduction and exit sensitivity increased
- EXTREME VOL: Extreme volatility confirmed, enhanced protective protocols engaged
- NEWS FILTER: Major economic event detected, 80% position reduction active
- GAP MODE: Weekend gap identified, increased caution until normal flow resumes
Combined Status Interpretation:
- NORMAL | NORMAL: Suitable trading conditions, standard strategy operation
- HIGH | HIGH VOL: Elevated volatility confirmed by both systems, 40% position reduction
- EXTREME | EXTREME VOL: High volatility warning, 70% position reduction active
📊VISUAL SYSTEM INTEGRATION
Chart Analysis & Market Visualization
CCI SMART Buffer Zone Visualization System - Dynamic Support/Resistance Framework
Dynamic Zone Architecture: The CCI SMART buffer system represents systematic visual integration creating adaptive support and resistance zones that automatically expand and contract based on current market volatility through ALMA-smoothed true range calculations. These dynamic zones provide real-time support and resistance levels that adapt to evolving market conditions rather than static horizontal lines that quickly become obsolete.
Adaptive Color Intensity Algorithm: The buffer visualization employs color intensity algorithms where transparency and saturation automatically adjust based on CCI momentum strength and directional persistence. Stronger momentum conditions produce more opaque visual representations with increased saturation, while weaker momentum creates subtle transparency indicating reduced prominence or significance.
Color Interpretation Framework for Strategic Decision Making:
-Intense Blue/Purple (High Opacity): Strong CCI readings exceeding ±80 with notable momentum strength indicating support/resistance zones suitable for increased position management decisions
• Moderate Blue/Purple (Medium Opacity): Standard CCI readings ranging ±40-80 with normal momentum indicating support/resistance areas for standard position management protocols
• Faded Blue/Purple (High Transparency): Weak CCI readings below ±40 with minimal momentum suggesting cautious interpretation and conservative position management approaches
• Dynamic Color Transitions: Automatic real-time shifts between bullish (blue spectrum) and bearish (purple spectrum) based on CCI trend direction and momentum persistence characteristics
CCI Inflection Circle System - Momentum Reversal Identification: The inflection detection system creates distinctive visual alerts through dual-circle design combining solid cores with transparent glow effects for enhanced visibility across different chart backgrounds and timeframe configurations.
Inflection Circle Classification:
• Neon Green Circles: CCI extreme bullish inflection detected (>80 threshold) with systematic core + glow effect indicating bearish reversal warning for position management evaluation
• Hot Pink Circles: CCI extreme bearish inflection detected (<-80 threshold) with dual-layer visualization indicating bullish reversal opportunity for strategic entry consideration
• Dual-Circle Design Architecture: Solid tiny core providing location identification with large transparent glow ensuring visibility without chart obstruction across multiple timeframe analyses
SAR Visual Network - Multi-Layer Momentum Display Architecture
SAR Visualization Framework: The SAR visual system implements structured multi-layer display architecture incorporating trend lines, strength classification markers, and momentum analysis through various visual elements that automatically adapt to current momentum conditions and strength characteristics.
SAR Strength Visual Classification System:
• Bright Triangles (High Intensity): Strong SAR momentum exceeding 75% of calculated strength range, indicating significant momentum quality suitable for increased positioning considerations and extended target scenarios
• Standard Circles (Medium Intensity): Moderate SAR momentum within 25-75% strength range, representing normal momentum development appropriate for standard positioning approaches and regular target expectations
• Faded Markers (Low Intensity): Weak SAR momentum below 25% strength range, suggesting caution and conservative positioning during minimal momentum conditions with increased exit sensitivity
⚠️IMPORTANT DISCLAIMERS AND RISK WARNINGS
Past Performance Limitations: The backtesting results presented represent hypothetical performance based on historical market data and do not guarantee future results. All trading involves substantial risk of loss. This strategy is provided for informational purposes and does not constitute financial advice. No trading strategy can guarantee 100% success or eliminate the risk of loss.
Users must approach trading with appropriate caution, never risking more than they can afford to lose.
Users are responsible for their own trading decisions, risk management, and compliance with applicable regulations in their jurisdiction.

Quantum Reversal Engine [ApexLegion]Quantum Reversal Engine
STRATEGY OVERVIEW
This strategy is constructed using 5 custom analytical filters that analyze different market dimensions - trend structure, momentum expansion, volume confirmation, price action patterns, and reversal detection - with results processed through a multi-component scoring calculation that determines signal generation and position management decisions.
Why These Custom Filters Were Independently Developed:
This strategy employs five custom-developed analytical filters:
1. Apex Momentum Core (AMC) - Custom oscillator with volatility-scaled deviation calculation
Standard oscillators lag momentum shifts by 2-3 bars. Custom calculation designed for momentum analysis
2. Apex Wick Trap (AWT) - Wick dominance analysis for trap detection
Existing wick analysis tools don't quantify trap conditions. Uses specific ratios for wick dominance detection
3. Apex Volume Pulse (AVP) - Volume surge validation with participation confirmation
Volume indicators typically use simple averages. Uses surge multipliers with participation validation
4. Apex TrendGuard (ATG) - Angle-based trend detection with volatility band integration
EMA slope calculations often produce false signals. Uses angle analysis with volatility bands for confirmation
5. Quantum Composite Filter (QCF) - Multi-component scoring and signal generation system
Composite scoring designed to filter noise by requiring multiple confirmations before signal activation.
Each filter represents mathematical calculations designed to address specific analytical requirements.
Framework Operation: The strategy functions as a scoring framework where each filter contributes weighted points based on market conditions. Entry signals are generated when minimum threshold scores are met. Exit management operates through a three-tier system with continued signal strength evaluation determining position holds versus closures at each TP level.
Integration Challenge: The core difficulty was creating a scoring system where five independent filters could work together without generating conflicting signals. This required backtesting to determine effective weight distributions.
Custom Filter Development:
Each of the five filters represents analytical approaches developed through testing and validation:
Integration Validation: Each filter underwent individual testing before integration. The composite scoring system required validation to verify that filters complement rather than conflict with each other, resulting in a cohesive analytical framework that was tested during the development period.
These filters represent custom-developed components created specifically for this strategy, with each component addressing different analytical requirements through testing and parameter adjustment.
Programming Features:
Multi-timeframe data handling with backup systems
Performance optimization techniques
Error handling for live trading scenarios
Parameter adaptation based on market conditions
Strategy Features:
Uses multi-filter confirmation approach
Adapts position holding based on continued signal strength
Includes analysis tools for trade review and optimization
Ongoing Development: The strategy was developed through testing and validation processes during the creation period.
COMPONENT EXPLANATION
EMA System
Uses 8 exponential moving averages (7, 14, 21, 30, 50, 90, 120, 200 periods) for trend identification. Primary signals come from 8/21 EMA crossovers, while longer EMAs provide structural context. EMA 1-4 determine short-term structure, EMA 5-8 provide long-term trend confirmation.
Apex Momentum Core (AMC)
Built custom oscillator mathematics after testing dozens of momentum calculation methods. Final algorithm uses price deviation from EMA baseline with volatility scaling to reduce lag while maintaining accuracy across different market conditions.
Custom momentum oscillator using price deviation from EMA baseline:
apxCI = 100 * (source - emaBase) / (sensitivity * sqrt(deviation + 1))
fastLine = EMA(apxCI, smoothing)
signalLine = SMA(fastLine, 4)
Signals generate when fastLine crosses signalLine at +50/-50 thresholds.
This identifies momentum expansion before traditional oscillators.
Apex Volume Pulse (AVP)
Created volume surge analysis that goes beyond simple averages. Extensive testing determined 1.3x multiplier with participation validation provides reliable confirmation while filtering false volume spikes.
Compares current volume to 21-period moving average.
Requires 1.3x average volume for signal confirmation. This filters out low-volume moves during quiet periods and confirms breakouts with actual participation.
Apex Wick Trap (AWT)
Developed proprietary wick trap detection through analysis of failed breakout patterns. Tested various ratio combinations before settling on 60% wick dominance + 20% body limit as effective trap identification parameters.
Analyzes candle structure to identify failed breakouts:
candleRange = math.max(high - low, 0.00001)
candleBody = math.abs(close - open)
bodyRatio = candleBody / candleRange
upperWick = high - math.max(open, close)
lowerWick = math.min(open, close) - low
upperWickRatio = upperWick / candleRange
lowerWickRatio = lowerWick / candleRange
trapWickLong = showAWT and lowerWickRatio > minWickDom and bodyRatio < bodyToRangeLimit and close > open
trapWickShort = showAWT and upperWickRatio > minWickDom and bodyRatio < bodyToRangeLimit and close < open This catches reversals after fake breakouts.
Apex TrendGuard (ATG)
Built angle-based trend detection after standard EMA crossovers proved insufficient. Combined slope analysis with volatility bands through iterative testing to eliminate false trend signals.
EMA slope analysis with volatility bands:
Fast EMA (21) vs Slow EMA (55) for trend direction
Angle calculation: atan(fast - slow) * 180 / π
ATR bands (1.75x multiplier) for breakout confirmation
Minimum 25° angle for strong trend classification
Core Algorithm Framework
1. Composite Signal Generation
calculateCompositeSignals() =>
// Component Conditions
structSignalLong = trapWickLong
structSignalShort = trapWickShort
momentumLong = amcBuySignal
momentumShort = amcSellSignal
volumeSpike = volume > volAvg_AVP * volMult_AVP
priceStrength_Long = close > open and close > close
priceStrength_Short = close < open and close < close
rsiMfiComboValue = (ta.rsi(close, 14) + ta.mfi(close, 14)) / 2
reversalTrigger_Long = ta.crossover(rsiMfiComboValue, 50)
reversalTrigger_Short = ta.crossunder(rsiMfiComboValue, 50)
isEMACrossUp = ta.crossover(emaFast_ATG, emaSlow_ATG)
isEMACrossDown = ta.crossunder(emaFast_ATG, emaSlow_ATG)
// Enhanced Composite Score Calculation
scoreBuy = 0.0
scoreBuy += structSignalLong ? scoreStruct : 0.0
scoreBuy += momentumLong ? scoreMomentum : 0.0
scoreBuy += flashSignal ? weightFlash : 0.0
scoreBuy += blinkSignal ? weightBlink : 0.0
scoreBuy += volumeSpike_AVP ? scoreVolume : 0.0
scoreBuy += priceStrength_Long ? scorePriceAction : 0.0
scoreBuy += reversalTrigger_Long ? scoreReversal : 0.0
scoreBuy += emaAlignment_Bull ? weightTrendAlign : 0.0
scoreBuy += strongUpTrend ? weightTrendAlign : 0.0
scoreBuy += highRisk_Long ? -1.2 : 0.0
scoreBuy += signalGreenDot ? 1.0 : 0.0
scoreBuy += isAMCUp ? 0.8 : 0.0
scoreBuy += isVssBuy ? 1.5 : 0.0
scoreBuy += isEMACrossUp ? 1.0 : 0.0
scoreBuy += signalRedX ? -1.0 : 0.0
scoreSell = 0.0
scoreSell += structSignalShort ? scoreStruct : 0.0
scoreSell += momentumShort ? scoreMomentum : 0.0
scoreSell += flashSignal ? weightFlash : 0.0
scoreSell += blinkSignal ? weightBlink : 0.0
scoreSell += volumeSpike_AVP ? scoreVolume : 0.0
scoreSell += priceStrength_Short ? scorePriceAction : 0.0
scoreSell += reversalTrigger_Short ? scoreReversal : 0.0
scoreSell += emaAlignment_Bear ? weightTrendAlign : 0.0
scoreSell += strongDownTrend ? weightTrendAlign : 0.0
scoreSell += highRisk_Short ? -1.2 : 0.0
scoreSell += signalRedX ? 1.0 : 0.0
scoreSell += isAMCDown ? 0.8 : 0.0
scoreSell += isVssSell ? 1.5 : 0.0
scoreSell += isEMACrossDown ? 1.0 : 0.0
scoreSell += signalGreenDot ? -1.0 : 0.0
compositeBuySignal = enableComposite and scoreBuy >= thresholdCompositeBuy
compositeSellSignal = enableComposite and scoreSell >= thresholdCompositeSell
if compositeBuySignal and compositeSellSignal
compositeBuySignal := false
compositeSellSignal := false
= calculateCompositeSignals()
// Final Entry Signals
entryCompositeBuySignal = compositeBuySignal and ta.rising(emaFast_ATG, 2)
entryCompositeSellSignal = compositeSellSignal and ta.falling(emaFast_ATG, 2)
Calculates weighted scores from independent modules and activates signals only when threshold requirements are met.
2. Smart Exit Hold Evaluation System
evaluateSmartHold() =>
compositeBuyRecentCount = 0
compositeSellRecentCount = 0
for i = 0 to signalLookbackBars - 1
compositeBuyRecentCount += compositeBuySignal ? 1 : 0
compositeSellRecentCount += compositeSellSignal ? 1 : 0
avgVolume = ta.sma(volume, 20)
volumeSpike = volume > avgVolume * volMultiplier
// MTF Bull/Bear conditions
mtf_bull = mtf_emaFast_final > mtf_emaSlow_final
mtf_bear = mtf_emaFast_final < mtf_emaSlow_final
emaBackupDivergence = math.abs(mtf_emaFast_backup - mtf_emaSlow_backup) / mtf_emaSlow_backup
emaBackupStrong = emaBackupDivergence > 0.008
mtfConflict_Long = inLong and mtf_bear and emaBackupStrong
mtfConflict_Short = inShort and mtf_bull and emaBackupStrong
// Layer 1: ATR-Based Dynamic Threshold (Market Volatility Intelligence)
atr_raw = ta.atr(atrLen)
atrValue = na(atr_raw) ? close * 0.02 : atr_raw
atrRatio = atrValue / close
dynamicThreshold = atrRatio > 0.02 ? 1.0 : (atrRatio > 0.01 ? 1.5 : 2.8)
// Layer 2: ROI-Conditional Time Intelligence (Selective Pressure)
timeMultiplier_Long = realROI >= 0 ? 1.0 : // Profitable positions: No time pressure
holdTimer_Long <= signalLookbackBars ? 1.0 : // Loss positions 1-8 bars: Base
holdTimer_Long <= signalLookbackBars * 2 ? 1.1 : // Loss positions 9-16 bars: +10% stricter
1.3 // Loss positions 17+ bars: +30% stricter
timeMultiplier_Short = realROI >= 0 ? 1.0 : // Profitable positions: No time pressure
holdTimer_Short <= signalLookbackBars ? 1.0 : // Loss positions 1-8 bars: Base
holdTimer_Short <= signalLookbackBars * 2 ? 1.1 : // Loss positions 9-16 bars: +10% stricter
1.3 // Loss positions 17+ bars: +30% stricter
// Dual-Layer Threshold Calculation
baseThreshold_Long = mtfConflict_Long ? dynamicThreshold + 1.0 : dynamicThreshold
baseThreshold_Short = mtfConflict_Short ? dynamicThreshold + 1.0 : dynamicThreshold
timeAdjustedThreshold_Long = baseThreshold_Long * timeMultiplier_Long
timeAdjustedThreshold_Short = baseThreshold_Short * timeMultiplier_Short
// Final Smart Hold Decision with Dual-Layer Intelligence
smartHold_Long = not mtfConflict_Long and smartScoreLong >= timeAdjustedThreshold_Long and compositeBuyRecentCount >= signalMinCount
smartHold_Short = not mtfConflict_Short and smartScoreShort >= timeAdjustedThreshold_Short and compositeSellRecentCount >= signalMinCount
= evaluateSmartHold()
Evaluates whether to hold positions past TP1/TP2/TP3 levels based on continued signal strength, volume confirmation, and multi-timeframe trend alignment
HOW TO USE THE STRATEGY
Step 1: Initial Setup
Apply strategy to your preferred timeframe (backtested on 15M)
Enable "Use Heikin-Ashi Base" for smoother signals in volatile markets
"Show EMA Lines" and "Show Ichimoku Cloud" are enabled for visual context
Set default quantities to match your risk management (5% equity default)
Step 2: Signal Recognition
Visual Signal Guide:
Visual Signal Guide - Complete Reference:
🔶 Red Diamond: Bearish momentum breakdown - short reversal signal
🔷 Blue Diamond: Strong bullish momentum - long reversal signal
🔵 Blue Dot: Volume-confirmed directional move - trend continuation
🟢 Green Dot: Bullish EMA crossover - trend reversal confirmation
🟠 Orange X: Oversold reversal setup - counter-trend opportunity
❌ Red X: Bearish EMA breakdown - trend reversal warning
✡ Star Uprising: Strong bullish convergence
💥 Ultra Entry: Ultra-rapid downward momentum acceleration
▲ VSS Long: Velocity-based bullish momentum confirmation
▼ VSS Short: Velocity-based bearish momentum confirmation
Step 3: Entry Execution
For Long Positions:
1. ✅ EMA1 crossed above EMA2 exactly 3 bars ago [ta.crossover(ema1,ema2) ]
2. ✅ Current EMA structure: EMA1 > EMA2 (maintained)
3. ✅ Composite score ≥ 5.0 points (6.5+ for 5-minute timeframes)
4. ✅ Cooldown period completed (no recent stop losses)
5. ✅ Volume spike confirmation (green dot/blue dot signals)
6. ✅ Bullish candle closes above EMA structure
For Short Positions:
1. ✅ EMA1 crossed below EMA2 exactly 3 bars ago [ta.crossunder(ema1,ema2) ]
2. ✅ Current EMA structure: EMA1 < EMA2 (maintained)
3. ✅ Composite score ≥ 5.4 points (7.0+ for 5-minute timeframes)
4. ✅ Cooldown period completed (no recent stop losses)
5. ✅ Momentum breakdown (red diamond/red X signals)
6. ✅ Bearish candle closes below EMA structure
🎯 Critical Timing Note: The strategy requires EMA crossover to have occurred 3 bars prior to entry, not at the current bar. This attempts to avoid premature entries and may improve signal reliability.
Step 4: Reading Market Context
EMA Ribbon Interpretation:
All EMAs ascending = Strong uptrend context
EMAs 1-3 above EMAs 4-8 = Bullish structure
Tight EMA spacing = Low volatility/consolidation
Wide EMA spacing = High volatility/trending
Ichimoku Cloud Context:
Price above cloud = Bullish environment
Price below cloud = Bearish environment
Cloud color intensity = Momentum strength
Thick cloud = Strong support/resistance
THE SMART EXIT GRID SYSTEM
Smart Exit Grid Approach:
The Smart Exit Grid uses dynamic hold evaluation that continuously analyzes market conditions after position entry. This differs from traditional fixed profit targets by adapting exit timing based on real-time signal strength.
How Smart Exit Grid System Works
The system operates through three evaluation phases:
Smart Score Calculation:
The smart score calculation aggregates 22 signal components in real-time, combining reversal warnings, continuation signals, trend alignment indicators, EMA structural analysis, and risk penalties into a numerical representation of market conditions. MTF analysis provides additional confirmation as a separate validation layer.
Signal Stack Management:
The per-tick signal accumulation system monitors 22 active signal types with MTF providing trend validation and conflict detection as a separate confirmation layer.
Take Profit Progression:
Smart Exit Activation:
The QRE system activates Smart Exit Grid immediately upon position entry. When strategy.entry() executes, the system initializes monitoring systems designed to track position progress.
Upon position opening, holdTimer begins counting, establishing the foundation for subsequent decisions. The Smart Exit Grid starts accumulating signals from entry, with all 22 signal components beginning real-time tracking when the trade opens.
The system operates on continuous evaluation where smartScoreLong and smartScoreShort calculate from the first tick after entry. QRE's approach is designed to capture market structure changes, trend deteriorations, or signal pattern shifts that can trigger protective exits even before the first take profit level is reached.
This activation creates a proactive position management framework. The 8-candle sliding window starts from entry, meaning that if market conditions change rapidly after entry - due to news events, liquidity shifts, or technical changes - the system can respond within the configured lookback period.
TP Markers as Reference Points:
The TP1, TP2, and TP3 levels function as reference points rather than mandatory exit triggers. When longTP1Hit or shortTP1Hit conditions activate, they serve as profit confirmation markers that inform the Smart Exit algorithm about achieved reward levels, but don't automatically initiate position closure.
These TP markers enhance the Smart Exit decision matrix by providing profit context to ongoing signal evaluation. The system recognizes when positions have achieved target returns, but the actual exit decision remains governed by continuous smart score evaluation and signal stack analysis.
TP2 Reached: Enhanced Monitoring
TP2 represents significant profit capture with additional monitoring features:
This approach is designed to help avoid premature profit-taking during trending conditions. If TP2 is reached but smartScoreLong remains above the dynamic threshold and the 8-candle sliding window shows persistent signals, the position continues holding. If market structure deteriorates before reaching TP2, the Smart Exit can trigger closure based on signal analysis.
The visual TP circles that appear when levels are reached serve as performance tracking tools, allowing users to see how frequently entries achieve various profit levels while understanding that actual exit timing depends on market structure analysis.
Risk Management Systems:
Operating independently from the Smart Exit Grid are two risk management systems: the Trap Wick Detection Protocol and the Stop Loss Mechanism. These systems maintain override authority over other exit logic.
The Trap Wick System monitors for conditionBearTrapExit during long positions and conditionBullTrapExit during short positions. When detected, these conditions trigger position closure with state reset, bypassing Smart Exit evaluations. This system recognizes that certain candlestick patterns may indicate reversal risk.
Volatility Exit Monitoring: The strategy monitors for isStrongBearCandle combined with conditionBearTrapExit, recognizing when market structure may be shifting.
Volume Validation: Before exiting on volatility, the strategy requires volume confirmation: volume > ta.sma(volume, 20) * 1.8. This is designed to filter exits on weak, low-volume movements.
The Stop Loss Mechanism operates through multiple triggers including traditional price-based stops (longSLHit, shortSLHit) and early exit conditions based on smart score deterioration combined with negative ROI. The early exit logic activates when smartScoreLong < 1.0 or smartScoreShort < 1.0 while realROI < -0.9%.
These risk management systems are designed so that risk scenarios can trigger protective closure with state reset across all 22 signal counters, TP tracking variables, and smart exit states.
This architecture - Smart Exit activation, TP markers as navigation tools, and independent risk management - creates a position management system that adapts to market conditions while maintaining risk discipline through dedicated protection protocols.
TP3 Reached: Enhanced Protection
Once TP3 is hit, the strategy shifts into enhanced monitoring:
EMA Structure Monitoring: isEMAStructureDown becomes a primary exit trigger
MTF Alignment: The higher timeframe receives increased consideration
Wick Trap Priority: conditionBearTrapExit becomes an immediate exit signal
Approach Differences:
Traditional Fixed Exits:
Exit at predetermined levels regardless of market conditions
May exit during trend continuation
May exit before trend completion
Limited adaptation to changing volatility
Smart Exit Grid Approach:
Adaptive timing based on signal conditions
Exits when supporting signals weaken
Multi-timeframe validation for trend confirmation
Volume confirmation requirements for holds
Structural monitoring for trend analysis
Dynamic ATR-Based Smart Score Threshold System
Market Volatility Adaptive Scoring
// Real-time ATR Analysis
atr_raw = ta.atr(atrLen)
atrValue = na(atr_raw) ? close * 0.02 : atr_raw
atrRatio = atrValue / close
// Three-Tier Dynamic Threshold Matrix
dynamicThreshold = atrRatio > 0.02 ? 1.0 : // High volatility: Lower threshold
(atrRatio > 0.01 ? 1.5 : // Medium volatility: Standard
2.8) // Low volatility: Higher threshold
The market volatility adaptive scoring calculates real-time ATR with a 2% fallback for new markets. The atrRatio represents the relationship between current volatility and price, creating a foundation for threshold adjustment.
The three-tier dynamic threshold matrix responds to market conditions by adjusting requirements based on volatility levels: lowering thresholds during high volatility periods above 2% ATR ratio to 1.0 points, maintaining standard requirements at 1.5 points for medium volatility between 1-2%, and raising standards to 2.8 points during low volatility periods below 1%.
Profit-Loss Adaptive Management:
The system applies different evaluation criteria based on position performance:
Winning Positions (realROI ≥ 0%):
→ timeMultiplier = 1.0 (No additional pressure)
→ Maintains base threshold requirements
→ Allows natural progression to TP2/TP3 levels
Losing Positions (realROI < 0%):
→ Progressive time pressure activated
→ Increasingly strict requirements over time
→ Faster decision-making on underperforming trades
ROI-Adaptive Smart Hold Decision Process:
The strategy uses a profit-loss adaptive system:
Winning Position Management (ROI ≥ 0%):
✅ Standard threshold requirements maintained
✅ No additional time-based pressure applied
✅ Allows positions to progress toward TP2/TP3 levels
✅ timeMultiplier remains at 1.0 regardless of hold duration
Losing Position Management (ROI < 0%):
⚠️ Time-based threshold adjustments activated
⚠️ Progressive increase in required signal strength over time
⚠️ Earlier exit evaluation on underperforming positions
⚠️ timeMultiplier increases from 1.0 → 1.1 → 1.3 based on hold duration
Real-Time Monitoring:
Monitor Analysis Table → "Smart" filter → "Score" vs "Dynamic Threshold"
Winning positions: Evaluation based on signal strength deterioration only
Losing positions: Evaluation considers both signal strength and progressive time adjustments
Breakeven positions (0% ROI): Treated as winning positions - no time adjustments
This approach differentiates between winning and losing positions in the hold evaluation process, requiring higher signal thresholds for extended holding of losing positions while maintaining standard requirements for winning ones.
ROI-Conditional Decision Matrix Examples:
Scenario 1 - Winning Position in Any Market:
Position ROI: +0.8% → timeMultiplier = 1.0 (regardless of hold time)
ATR Medium (1.2%) → dynamicThreshold = 1.5
Final Threshold = 1.5 × 1.0 = 1.5 points ✅ Position continues
Scenario 2 - Losing Position, Extended Hold:
Position ROI: -0.5% → Time pressure activated
Hold Time: 20 bars → timeMultiplier = 1.3
ATR Low (0.8%) → dynamicThreshold = 2.8
Final Threshold = 2.8 × 1.3 = 3.64 points ⚡ Enhanced requirements
Scenario 3 - Fresh Losing Position:
Position ROI: -0.3% → Time pressure activated
Hold Time: 5 bars → timeMultiplier = 1.0 (still early)
ATR High (2.1%) → dynamicThreshold = 1.0
Final Threshold = 1.0 × 1.0 = 1.0 points 📊 Recovery opportunity
Scenario 4 - Breakeven Position:
Position ROI: 0.0% → timeMultiplier = 1.0 (no pressure)
Hold Time: 15 bars → No time penalty applied
Final Threshold = dynamicThreshold only ⚖️ Neutral treatment
🔄8-Candle Sliding Window Signal Rotation System
Composite Signal Counting Mechanism
// Dynamic Lookback Window (configurable: default 8)
signalLookbackBars = input.int(8, "Composite Lookback Bars", minval=1, maxval=50)
// Rolling Signal Analysis
compositeBuyRecentCount = 0
compositeSellRecentCount = 0
for i = 0 to signalLookbackBars - 1
compositeBuyRecentCount += compositeBuySignal ? 1 : 0
compositeSellRecentCount += compositeSellSignal ? 1 : 0
Candle Flow Example (8-bar window):
→
✓ ✓ ✗ ✓ ✗ ✓ ✗ ✓ 🗑️
New Signal Count = 5/8 signals in window
Threshold Check: 5 ≥ signalMinCount (2) = HOLD CONFIRMED
Signal Decay & Refresh Mechanism
// Signal Persistence Tracking
if compositeBuyRecentCount >= signalMinCount
smartHold_Long = true
else
smartHold_Long = false
The composite signal counting operates through a configurable sliding window. The system maintains rolling counters that scan backward through the specified number of candles.
During each evaluation cycle, the algorithm iterates through historical bars, incrementing counters when composite signals are detected. This creates a dynamic signal persistence measurement where recent signal density determines holding decisions.
The sliding window rotation functions like a moving conveyor belt where new signals enter while the oldest signals drop off. For example, in an 8-bar window, if 5 out of 8 recent candles showed composite buy signals, and the minimum required count is 2, the system confirms the hold condition. As new bars form, the window slides forward, potentially changing the signal count and triggering exit conditions when signal density falls below the threshold.
Signal decay and refresh occur continuously where smartHold_Long remains true only when compositeBuyRecentCount exceeds signalMinCount. When recent signal density drops below the minimum requirement, the system switches to exit mode.
Advanced Signal Stack Management - 22-Signal Real-Time Evaluation
// Long Position Signal Stacking (calc_on_every_tick=true)
if inLong
// Primary Reversal Signals
if signalRedDiamond: signalCountRedDiamond += 1 // -0.5 points
if signalStarUprising: signalCountStarUprising += 1 // +1.5 points
if entryUltraShort: signalCountUltra += 1 // -1.0 points
// Trend Confirmation Signals
if strongUpTrend: trendUpCount_Long += 1 // +1.5 points
if emaAlignment_Bull: bullAlignCount_Long += 1 // +1.0 points
// Risk Assessment Signals
if highRisk_Long: riskCount_Long += 1 // -1.5 points
if topZone: tzoneCount_Long += 1 // -0.5 points
The per-tick signal accumulation system operates with calc_on_every_tick=true for real-time responsiveness. During long positions, the system monitors primary reversal signals where Red Diamond signals subtract 0.5 points as reversal warnings, Star Uprising adds 1.5 points for continuation signals, and Ultra Short signals deduct 1.0 points as counter-trend warnings.
Trend confirmation signals provide weighted scoring where strongUpTrend adds 1.5 points for aligned momentum, emaAlignment_Bull contributes 1.0 point for structural support, and various EMA-based confirmations contribute to the overall score. Risk assessment signals apply negative weighting where highRisk_Long situations subtract 1.5 points, topZone conditions deduct 0.5 points, and other risk factors create defensive scoring adjustments.
The smart score calculation aggregates all 22 components in real-time, combining reversal warnings, continuation signals, trend alignment indicators, EMA structural analysis, and risk penalties into a numerical representation of market conditions. This score updates continuously, providing the foundation for hold-or-exit decisions.
MULTI-TIMEFRAME (MTF) SYSTEM
MTF Data Collection
The strategy requests higher timeframe data (default 30-minute) for trend confirmation:
= request.security(syminfo.tickerid, mtfTimeframe, , lookahead=barmerge.lookahead_off, gaps=barmerge.gaps_off)
MTF Watchtower System - Implementation Logic
The system employs a timeframe discrimination protocol where currentTFInMinutes is compared against a 30-minute threshold. This creates different operational behavior between timeframes:
📊 Timeframe Testing Results:
30M+ charts: Full MTF confirmation → Tested with full features
15M charts: Local EMA + adjusted parameters → Standard testing baseline
5M charts: Local EMA only → Requires parameter adjustment
1M charts: High noise → Limited testing conducted
When the chart timeframe is 30 minutes or above, the strategy activates useMTF = true and requests external MTF data through request.security(). For timeframes below 30 minutes, including your 5-minute setup, the system deliberately uses local EMA calculations to avoid MTF lag and data inconsistencies.
The triple-layer data sourcing architecture works as follows: timeframes from 1 minute to 29 minutes rely on chart-based EMA calculations for immediate responsiveness. Timeframes of 30 minutes and above utilize MTF data through the security function, with a backup system that doubles the EMA length (emaLen * 2) if MTF data fails. When MTF data is unavailable or invalid, the system falls back to local EMA as the final safety net.
Data validation occurs through a pipeline where mtf_dataValid checks not only for non-null values but also verifies that EMA values are positive above zero. The system tracks data sources through mtf_dataSource which displays "MTF Data" for successful external requests, "Backup EMA" for failed MTF with backup system active, or "Chart EMA" for local calculations.
🔄 MTF Smart Score Caching & Recheck System
// Cache Update Decision Logic
mtfSmartIntervalSec = input.int(300, "Smart Grid Recheck Interval (sec)") // 5-minute cache
canRecheckSmartScore = na(timenow) ? false :
(na(lastCheckTime) or (timenow - lastCheckTime) > mtfSmartIntervalSec * 1000)
// Cache Management
if canRecheckSmartScore
lastCheckTime := timenow
cachedSmartScoreLong := smartScoreLong // Store current calculation
cachedSmartScoreShort := smartScoreShort
The performance-optimized caching system addresses the computational intensity of continuous MTF analysis through intelligent interval management. The mtfSmartIntervalSec parameter, defaulting to 300 seconds (5 minutes), determines cache refresh frequency. The system evaluates canRecheckSmartScore by comparing current time against lastCheckTime plus the configured interval.
When cache updates trigger, the system stores current calculations in cachedSmartScoreLong and cachedSmartScoreShort, creating stable reference points that reduce excessive MTF requests. This cache management balances computational efficiency with analytical accuracy.
The cache versus real-time hybrid system creates a multi-layered decision matrix where immediate signals update every tick for responsive market reaction, cached MTF scores refresh every 5 minutes for stability filtering, dynamic thresholds recalculate every bar for volatility adaptation, and sliding window analysis updates every bar for trend persistence validation.
This architecture balances real-time signal detection with multi-timeframe strategic validation, creating adaptive trading intelligence that responds immediately to market changes while maintaining strategic stability through cached analysis and volatility-adjusted decision thresholds.
⚡The Execution Section Deep Dive
The execution section represents the culmination of all previous systems – where analysis transforms into action.
🚪 Entry Execution: The Gateway Protocol
Primary Entry Validation:
Entry isn't just about seeing a signal – it's about passing through multiple security checkpoints, each designed to filter out low-quality opportunities.
Stage 1: Signal Confirmation
entryCompositeBuySignal must be TRUE for longs
entryCompositeSellSignal must be TRUE for shorts
Stage 2: Enhanced Entry Validation
The strategy employs an "OR" logic system that recognizes different types of market opportunities:
Path A - Trend Reversal Entry:
When emaTrendReversal_Long triggers, it indicates the market structure is shifting in favor of the trade direction. This isn't just about a single EMA crossing – it represents a change in market momentum that experienced traders recognize as potential high-probability setups.
Path B - Momentum Breakout Entry:
The strongBullMomentum condition is where QRE identifies accelerating market conditions:
Criteria:
EMA1 rising for 3+ candles AND
EMA2 rising for 2+ candles AND
Close > 10-period high
This combination captures those explosive moves where the market doesn't just trend – it accelerates, creating momentum-driven opportunities.
Path C - Recovery Entry:
When previous exit states are clean (no recent stop losses), the strategy permits entry based purely on signal strength. This pathway is designed to help avoid the strategy becoming overly cautious after successful trades.
🛡️ The Priority Exit Matrix: When Rules Collide
Not all exit signals are created equal. QRE uses a strict hierarchy that is designed to avoid conflicting signals from causing hesitation:
Priority Level 1 - Exception Exits (Immediate Action):
Condition: TP3 reached AND Wick Trap detected
Action: Immediate exit regardless of other signals
Rationale: Historical analysis suggests wick traps at TP3 may indicate potential reversals
Priority Level 2 - Structural Breakdown:
Condition: TP3 active AND EMA structure deteriorating AND Smart Score insufficient
Logic: isEMAStructureDown AND NOT smartHold_Long
This represents the strategy recognizing that the underlying market structure that justified the trade is failing. It's like a building inspector identifying structural issues – you don't wait for additional confirmation.
Priority Level 3 - Enhanced Volatility Exits:
Conditions: TP2 active AND Strong counter-candle AND Wick trap AND Volume spike
Logic: Multiple confirmation required to reduce false exits
Priority Level 4 - Standard Smart Score Exits:
Condition: Any TP level active AND smartHold evaluates to FALSE
This is the bread-and-butter exit logic where signal deterioration triggers exit
⚖️ Stop Loss Management: Risk Control Protocol
Dual Stop Loss System:
QRE provides two stop loss modes that users can select based on their preference:
Fixed Mode (Default - useAdaptiveSL = false):
Uses predetermined percentage levels regardless of market volatility:
- Long SL = entryPrice × (1 - fixedRiskP - slipBuffer)
- Short SL = entryPrice × (1 + fixedRiskP + slipBuffer)
- Default: 0.6% risk + 0.3% slippage buffer = 0.9% total stop
- Consistent and predictable stop loss levels
- Recommended for users who prefer stable risk parameters
Adaptive Mode (Optional - useAdaptiveSL = true):
Dynamic system that adjusts stop loss based on market volatility:
- Base Calculation uses ATR (Average True Range)
- Long SL = entryPrice × (1 - (ATR × atrMultSL) / entryPrice - slipBuffer)
- Short SL = entryPrice × (1 + (ATR × atrMultSL) / entryPrice + slipBuffer)
- Automatically widens stops during high volatility periods
- Tightens stops during low volatility periods
- Advanced users can enable for volatility-adaptive risk management
Trend Multiplier Enhancement (Both Modes):
When strongUpTrend is detected for long positions, the stop loss receives 1.5x breathing room. Strong trends often have deeper retracements before continuing. This is designed to help avoid the strategy being shaken out of active trades by normal market noise.
Mode Selection Guidance:
- New Users: Start with Fixed Mode for predictable risk levels
- Experienced Users: Consider Adaptive Mode for volatility-responsive stops
- Volatile Markets: Adaptive Mode may provide better stop placement
- Stable Markets: Fixed Mode often sufficient for consistent risk management
Early Exit Conditions:
Beyond traditional stop losses, QRE implements "smart stops" that trigger before price-based stops:
Early Long Exit: (smartScoreLong < 1.0 OR prev5BearCandles) AND realROI < -0.9%
🔄 State Management: The Memory System
Complete State Reset Protocol:
When a position closes, QRE doesn't just wipe the slate clean – it performs a methodical reset:
TP State Cleanup:
All Boolean flags: tp1/tp2/tp3HitBefore → FALSE
All Reached flags: tp1/tp2/tp3Reached → FALSE
All Active flags: tp1/tp2/tp3HoldActive → FALSE
Signal Counter Reset:
Every one of the 22 signal counters returns to zero.
This is designed to avoid signal "ghosting" where old signals influence new trades.
Memory Preservation:
While operational states reset, certain information is preserved for learning:
killReasonLong/Short: Why did this trade end?
lastExitWasTP1/TP2/TP3: What was the exit quality?
reEntryCount: How many consecutive re-entries have occurred?
🔄 Re-Entry Logic: The Comeback System
Re-Entry Conditions Matrix:
QRE implements a re-entry system that recognizes not all exits are created equal:
TP-Based Re-Entry (Enabled):
Criteria: Previous exit was TP1, TP2, or TP3
Cooldown: Minimal or bypassed entirely
Logic: Target-based exits indicate potentially viable market conditions
EMA-Based Re-Entry (Conditional):
Criteria: Previous exit was EMA-based (structural change)
Requirements: Must wait for EMA confirmation in new direction
Minimum Wait: 5 candles
Advanced Re-Entry Features:
When adjustReEntryTargets is enabled, the strategy becomes more aggressive with re-entries:
Target Adjustment: TP1 multiplied by reEntryTP1Mult (default 2.0)
Stop Adjustment: SL multiplied by reEntrySLMult (default 1.5)
Logic: If we're confident enough to re-enter, we should be confident enough to hold for bigger moves
Performance Tracking: Strategy tracks re-entry win rate, average ROI, and total performance separately from initial entries for optimization analysis.
📊 Exit Reason Analytics: Learning from Every Trade
Kill Reason Tracking:
Every exit is categorized and stored:
"TP3 Exit–Wick Trap": Exit at target level with wick pattern detection
"Smart Exit–EMA Down": Structural breakdown exit
"Smart Exit–Volatility": Volatility-based protection exit
"Exit Post-TP1/TP2/TP3": Standard smart exit progression
"Long SL Exit" / "Short SL Exit": Stop loss exits
Performance Differentiation:
The strategy tracks performance by exit type, allowing for continuous analysis:
TP-based exits: Achieved target levels, analyze for pattern improvement
EMA-based exits: Mixed results, analyze for pattern improvement
SL-based exits: Learning opportunities, adjust entry criteria
Volatility exits: Protective measures, monitor performance
🎛️ Trailing Stop Implementation:
Conditional Trailing Activation:
Activation Criteria: Position profitable beyond trailingStartPct AND
(TP hold active OR re-entry trade)
Dynamic Trailing Logic:
Unlike simple trailing stops, QRE's implementation considers market context:
Trending Markets: Wider trail offsets to avoid whipsaws
Volatile Markets: Tighter offsets to protect gains
Re-Entry Trades: Enhanced trailing to maximize second-chance opportunities
Return-to-Entry Protection:
When deactivateOnReturn is enabled, the strategy will close positions that return to entry level after being profitable. This is designed to help avoid the frustration of watching profitable trades turn into losers.
🧠 How It All Works Together
The beauty of QRE lies not in any single component, but in how everything integrates:
The Entry Decision: Multiple pathways are designed to help identify opportunities while maintaining filtering standards.
The Progression System: Each TP level unlocks new protection features, like achieving ranks in a video game.
The Exit Matrix: Prioritized decision-making aims to reduce analysis paralysis while providing appropriate responses to different market conditions.
The Memory System: Learning from each trade while preventing contamination between separate opportunities.
The Re-Entry Logic: Re-entry system that balances opportunity with risk management.
This creates a trading system where entry conditions filter for quality, progression systems adapt to changing market conditions, exit priorities handle conflicting signals intelligently, memory systems learn from each trade cycle, and re-entry logic maximizes opportunities while managing risk exposure.
📊 ANALYSIS TABLE INTERPRETATION -
⚙️ Enabling Analysis Mode
Navigate to strategy settings → "Testing & Analysis" → Enable "Show Analysis Table". The Analysis Table displays different information based on the selected test filter and provides real-time insight into all strategy components, helping users understand current market conditions, position status, and system decision-making processes.
📋 Filter Mode Interpretations
"All" Mode (Default View):
Composite Section:
Buy Score: Aggregated strength from all 22 bullish signals (threshold 5.0+ triggers entry consideration)
Sell Score: Aggregated strength from all 22 bearish signals (threshold 5.4+ triggers entry consideration)
APEX Filters:
ATG Trend: Shows current trend direction analysis
Indicates whether momentum filters are aligned for directional bias
ReEntry Section:
Most Recent Exit: Displays exit type and timeframe since last position closure
Status: Shows if ReEntry system is Ready/Waiting/Disabled
Count: Current re-entry attempts versus maximum allowed attempts
Position Section (When Active):
Status: Current position state (LONG/SHORT/FLAT)
ROI: Dual calculation showing Custom vs Real ROI percentages
Entry Price: Original position entry level
Current Price: Live market price for comparison
TP Tracking: Progress toward profit targets
"Smart" Filter (Critical for Active Positions):
Smart Exit Section:
Hold Timer: Time elapsed since position opened (bar-based counting)
Status: Whether Smart Exit Grid is Enabled/Disabled
Score: Current smart score calculation from 22-component matrix
Dynamic Threshold: ATR-based minimum score required for holding
Final Threshold: Time and ROI-adjusted threshold actually used for decisions
Score Check: Pass/Fail based on Score vs Final Threshold comparison
Smart Hold: Current hold decision status
Final Hold: Final recommendation based on all factors
🎯 Advanced Smart Exit Debugging - ROI & Time-Based Threshold System
Understanding the Multi-Layer Threshold System:
Layer 1: Dynamic Threshold (ATR-Based)
atrRatio = ATR / close
dynamicThreshold = atrRatio > 0.02 ? 1.0 : // High volatility: Lower threshold
(atrRatio > 0.01 ? 1.5 : // Medium volatility: Standard
2.8) // Low volatility: Higher threshold
Layer 2: Time Multiplier (ROI & Duration-Based)
Winning Positions (ROI ≥ 0%):
→ timeMultiplier = 1.0 (No time pressure, regardless of hold duration)
Losing Positions (ROI < 0%):
→ holdTimer ≤ 8 bars: timeMultiplier = 1.0 (Early stage, standard requirements)
→ holdTimer 9-16 bars: timeMultiplier = 1.1 (10% stricter requirements)
→ holdTimer 17+ bars: timeMultiplier = 1.3 (30% stricter requirements)
Layer 3: Final Threshold Calculation
finalThreshold = dynamicThreshold × timeMultiplier
Examples:
- Winning Position: 2.8 × 1.0 = 2.8 (Always standard)
- Losing Position (Early): 2.8 × 1.0 = 2.8 (Same as winning initially)
- Losing Position (Extended): 2.8 × 1.3 = 3.64 (Much stricter)
Real-Time Debugging Display:
Smart Exit Section shows:
Score: 3.5 → Current smartScoreLong/Short value
Dynamic Threshold: 2.8 → Base ATR-calculated threshold
Final Threshold: 3.64 (ATR×1.3) → Actual threshold used for decisions
Score Check: FAIL (3.5 vs 3.64) → Pass/Fail based on final comparison
Final Hold: NO HOLD → Actual system decision
Position Status Indicators:
Winner + Early: ATR×1.0 (No pressure)
Winner + Extended: ATR×1.0 (No pressure - winners can run indefinitely)
Loser + Early: ATR×1.0 (Recovery opportunity)
Loser + Extended: ATR×1.1 or ATR×1.3 (Increasing pressure to exit)
MTF Section:
Data Source: Shows whether using MTF Data/EMA Backup/Local EMA
Timeframe: Configured watchtower timeframe setting
Data Valid: Confirms successful MTF data retrieval status
Trend Signal: Higher timeframe directional bias analysis
Close Price: MTF price data availability confirmation
"Composite" Filter:
Composite Section:
Buy Score: Real-time weighted scoring from multiple indicators
Sell Score: Opposing directional signal strength
Threshold: Minimum scores required for signal activation
Components:
Flash/Blink: Momentum acceleration indicators (F = Flash active, B = Blink active)
Individual filter contributions showing which specific signals are firing
"ReEntry" Filter:
ReEntry System:
System: Shows if re-entry feature is Enabled/Disabled
Eligibility: Conditions for new entries in each direction
Performance: Success metrics of re-entry attempts when enabled
🎯 Key Status Indicators
Status Column Symbols:
✓ = Condition met / System active / Signal valid
✗ = Condition not met / System inactive / No signal
⏳ = Cooldown active (waiting period)
✅ = Ready state / Good condition
🔄 = Processing / Transitioning state
🔍 Critical Reading Guidelines
For Active Positions - Smart Exit Priority Reading:
1. First Check Position Type:
ROI ≥ 0% = Winning Position (Standard requirements)
ROI < 0% = Losing Position (Progressive requirements)
2. Check Hold Duration:
Early Stage (≤8 bars): Standard multiplier regardless of ROI
Extended Stage (9-16 bars): Slight pressure on losing positions
Long Stage (17+ bars): Strong pressure on losing positions
3. Score vs Final Threshold Analysis:
Score ≥ Final Threshold = HOLD (Continue position)
Score < Final Threshold = EXIT (Close position)
Watch for timeMultiplier changes as position duration increases
4. Understanding "Why No Hold?"
Common scenarios when Score Check shows FAIL:
Losing position held too long (timeMultiplier increased to 1.1 or 1.3)
Low volatility period (dynamic threshold raised to 2.8)
Signal deterioration (smart score dropped below required level)
MTF conflict (higher timeframe opposing position direction)
For Entry Signal Analysis:
Composite Score Reading: Signal strength relative to threshold requirements
Component Analysis: Individual filter contributions to overall score
EMA Structure: Confirm 3-bar crossover requirement met
Cooldown Status: Ensure sufficient time passed since last exit
For ReEntry Opportunities (when enabled):
System Status: Availability and eligibility for re-engagement
Exit Type Analysis: TP-based exits enable immediate re-entry, SL-based exits require cooldown
Condition Monitoring: Requirements for potential re-entry signals
Debugging Common Issues:
Issue: "Score is high but no hold?"
→ Check Final Threshold vs Score (not Dynamic Threshold)
→ Losing position may have increased timeMultiplier
→ Extended hold duration applying pressure
Issue: "Why different thresholds for same score?"
→ Position ROI status affects multiplier
→ Time elapsed since entry affects multiplier
→ Market volatility affects base threshold
Issue: "MTF conflicts with local signals?"
→ Higher timeframe trend opposing position
→ System designed to exit on MTF conflicts
→ Check MTF Data Valid status
⚡ Performance Optimization Notes
For Better Performance:
Analysis table updates may impact performance on some devices
Use specific filters rather than "All" mode for focused monitoring
Consider disabling during live trading for optimal chart performance
Enable only when needed for debugging or analysis
Strategic Usage:
Monitor "Smart" filter when positions are active for exit timing decisions
Use "Composite" filter during setup phases for signal strength analysis
Reference "ReEntry" filter after position closures for re-engagement opportunities
Track Final Threshold changes to understand exit pressure evolution
Advanced Debugging Workflow:
Position Entry Analysis:
Check Composite score vs threshold
Verify EMA crossover timing (3 bars prior)
Confirm cooldown completion
Hold Decision Monitoring:
Track Score vs Final Threshold progression
Monitor timeMultiplier changes over time
Watch for MTF conflicts
Exit Timing Analysis:
Identify which threshold layer caused exit
Track performance by exit type
Analyze re-entry eligibility
This analysis system provides transparency into strategy decision-making processes, allowing users to understand how signals are generated and positions are managed according to the programmed logic during various market conditions and position states.
SIGNAL TYPES AND CHARACTERISTICS
🔥 Core Momentum Signals
Flash Signal
Calculation: ta.rma(math.abs(close - close ), 5) > ta.sma(math.abs(close - close ), 7)
Purpose: Detects sudden price acceleration using smoothed momentum comparison
Characteristics: Triggers when recent price movement exceeds historical average movement
Usage: Primary momentum confirmation across multiple composite calculations
Weight: 1.3 points in composite scoring
Blink Signal
Calculation: math.abs(ta.change(close, 1)) > ta.sma(math.abs(ta.change(close, 1)), 5)
Purpose: Identifies immediate price velocity spikes
Characteristics: More sensitive than Flash, captures single-bar momentum bursts
Usage: Secondary momentum confirmation, often paired with Flash
Weight: 1.3 points in composite scoring
⚡ Advanced Composite Signals
Apex Pulse Signal
Calculation: apexAngleValue > 30 or apexAngleValue < -30
Purpose: Detects extreme EMA angle momentum
Characteristics: Identifies when trend angle exceeds ±30 degrees
Usage: Confirms directional momentum strength in trend-following scenarios
Pressure Surge Signal
Calculation: volSpike_AVP and strongTrendUp_ATG
Purpose: Combines volume expansion with trend confirmation
Characteristics: Requires both volume spike and strong uptrend simultaneously
Usage: bullish signal for trend continuation
Shift Wick Signal
Calculation: ta.crossunder(ema1, ema2) and isWickTrapDetected and directionFlip
Purpose: Detects bearish reversal with wick trap confirmation
Characteristics: Combines EMA crossunder with upper wick dominance and directional flip
Usage: Reversal signal for trend change identification
🛡️ Trap Exit Protection Signals
Bear Trap Exit
Calculation: isUpperWickTrap and isBearEngulfNow
Conditions: Previous bullish candle with 80%+ upper wick, followed by current bearish engulfing
Purpose: Emergency exit signal for long positions
Priority: Highest - overrides all other hold conditions
Action: Immediate position closure with full state reset
Bull Trap Exit
Calculation: isLowerWickTrap and isBullEngulfNow
Conditions: Previous bearish candle with 80%+ lower wick, followed by current bullish engulfing
Purpose: Emergency exit signal for short positions
Priority: Highest - overrides all other hold conditions
Action: Immediate position closure with full state reset
📊 Technical Analysis Foundation Signals
RSI-MFI Hybrid System
Base Calculation: (ta.rsi(close, 14) + ta.mfi(close, 14)) / 2
Oversold Threshold: < 35
Overbought Threshold: > 65
Weak Condition: < 35 and declining
Strong Condition: > 65 and rising
Usage: Momentum confirmation and reversal identification
ADX-DMI Trend Classification
Strong Up Trend: (adx > 25 and diplus > diminus and (diplus - diminus) > 5) or (ema1 > ema2 and ema2 > ema3 and ta.rising(ema2, 3))
Strong Down Trend: (adx > 20 and diminus > diplus - 5) or (ema1 < ema2 and ta.falling(ema1, 3))
Trend Weakening: adx < adx and adx < adx
Usage: Primary trend direction confirmation
Bollinger Band Squeeze Detection
Calculation: bbWidth < ta.lowest(bbWidth, 20) * 1.2
Purpose: Identifies low volatility periods before breakouts
Usage: Entry filter - avoids trades during consolidation
🎨 Visual Signal Indicators
Red X Signal
Calculation: isBearCandle and ta.crossunder(ema1, ema2)
Visual: Red X above price
Purpose: Bearish EMA crossunder with confirming candle
Composite Weight: +1.0 for short positions, -1.0 for long positions
Characteristics: Simple but effective trend change indicator
Green Dot Signal
Calculation: isBullCandle and ta.crossover(ema1, ema2)
Visual: Green dot below price
Purpose: Bullish EMA crossover with confirming candle
Composite Weight: +1.0 for long positions, -1.0 for short positions
Characteristics: Entry confirmation for trend-following strategies
Blue Diamond Signal
Trigger Conditions: amcBuySignal and score >= 4
Scoring Components: 11 different technical conditions
Key Requirements: AMC bullish + momentum rise + EMA expansion + volume confirmation
Visual: Blue diamond below price
Purpose: Bullish reversal or continuation signal
Characteristics: Multi-factor confirmation requiring 4+ technical alignments
Red Diamond Signal
Trigger Conditions: amcSellSignal and score >= 5
Scoring Components: 11 different technical conditions (stricter than Blue Diamond)
Key Requirements: AMC bearish + momentum crash + EMA compression + volume decline
Visual: Red diamond above price
Purpose: Potential bearish reversal or continuation signal
Characteristics: Requires higher threshold (5 vs 4) for more selective triggering
🔵 Specialized Detection Signals
Blue Dot Signal
Calculation: volumePulse and isCandleStrong and volIsHigh
Requirements: Volume > 2.0x MA, strong candle body > 35% of range, volume MA > 55
Purpose: Volume-confirmed momentum signal
Visual: Blue dot above price
Characteristics: Volume-centric signal for high-liquidity environments
Orange X Signal
Calculation: Complex multi-factor oversold reversal detection
Requirements: AMC oversold + wick trap + flash/blink + RSI-MFI oversold + bullish flip
Purpose: Oversold bounce signal with multiple confirmations
Visual: Orange X below price
Characteristics: Reversal signal requiring 5+ simultaneous conditions
VSS (Velocity Signal System)
Components: Volume spike + EMA angle + trend direction
Buy Signal: vssTrigger and vssTrendDir == 1
Sell Signal: vssTrigger and vssTrendDir == -1
Visual: Green/Red triangles
Purpose: Velocity-based momentum detection
Characteristics: Fast-response signal for momentum trading
⭐ Elite Composite Signals
Star Uprising Signal
Base Requirements: entryCompositeBuySignal and echoBodyLong and strongUpTrend and isAMCUp
Additional Confirmations: RSI hybrid strong + not high risk
Special Conditions: At bottom zone OR RSI bottom bounce OR strong volume bounce
Visual: Star symbol below price
Purpose: Bullish reversal signal from oversold conditions
Characteristics: Most selective bullish signal requiring multiple confirmations
Ultra Short Signal
Scoring System: 7-component scoring requiring 4+ points
Key Components: EMA trap + volume decline + RSI weakness + composite confirmation
Additional Requirements: Falling EMA structure + volume spike + flash confirmation
Visual: Explosion emoji above price
Purpose: Aggressive short entry for trend reversal or continuation
Characteristics: Complex multi-layered signal for experienced short selling
🎯 Composite Signal Architecture
Enhanced Composite Scoring
Long Composite: 15+ weighted components including structure, momentum, flash/blink, volume, price action, reversal triggers, trend alignment
Short Composite: Mirror structure with bearish bias
Threshold: 5.0 points required for signal activation
Conflict Resolution: If both long and short signals trigger simultaneously, both are disabled
Final Validation: Requires EMA momentum confirmation (ta.rising(emaFast_ATG, 2) for longs, ta.falling(emaFast_ATG, 2) for shorts)
Risk Assessment Integration
High Risk Long: RSI > 70 OR close > upper Bollinger Band 80%
High Risk Short: RSI < 30 OR close < lower Bollinger Band 80%
Zone Analysis: Top zone (95% of 50-bar high) vs Bottom zone (105% of 50-bar low)
Risk Penalty: High risk conditions subtract 1.5 points from composite scores
This signal architecture creates a multi-layered detection system where simple momentum signals provide foundation, technical analysis adds structure, visual indicators offer clarity, specialized detectors capture different market conditions, and composite signals identify potential opportunities while integrated risk assessment is designed to filter risky entries.
VISUAL FEATURES SHOWCASE
Ichimoku Cloud Visualization
Dynamic Color Intensity: Cloud transparency adapts to momentum strength - darker colors indicate stronger directional moves, while lighter transparency shows weakening momentum phases.
Gradient Color Mapping: Bullish momentum renders blue-purple spectrum with increasing opacity, while bearish momentum displays corresponding color gradients with intensity-based transparency.
Real-time Momentum Feedback: Color saturation provides immediate visual feedback on market structure strength, allowing traders to assess levels at a glance without additional indicators.
EMA Ribbon Bands
The 8-level exponential moving average system creates a comprehensive trend structure map with gradient color coding.
Signal Type Visualization
STRATEGY PROPERTIES & BACKTESTING DISCLOSURE
📊 Default Strategy Configuration:
✅ Initial Capital: 100,000 USD (realistic for average traders)
✅ Commission: 0.075% per trade (realistic exchange fees)
✅ Slippage: 3 ticks (market impact consideration)
✅ Position Size: 5% equity per trade (sustainable risk level)
✅ Pyramiding: Disabled (single position management)
✅ Sample Size: 185 trades over 12-month backtesting period
✅ Risk Management: Adaptive stop loss with maximum 1% risk per trade
COMPREHENSIVE BACKTESTING RESULTS
Testing Period & Market Conditions:
Backtesting Period: June 25, 2024 - June 25, 2025 (12 months)
Timeframe: 15-minute charts (MTF system active)
Market: BTCUSDT (Bitcoin/Tether)
Market Conditions: Full market cycle including volatility periods
Deep Backtesting: Enabled for maximum accuracy
📈 Performance Summary:
Total Return: +2.19% (+2,193.59 USDT)
Total Trades Executed: 185 trades
Win Rate: 34.05% (63 winning trades out of 185)
Profit Factor: 1.295 (gross profit ÷ gross loss)
Maximum Drawdown: 0.65% (653.17 USDT)
Risk-Adjusted Returns: Consistent with conservative risk management approach
📊 Detailed Trade Analysis:
Position Distribution:
Long Positions: 109 trades (58.9%) | Win Rate: 36.70%
Short Positions: 76 trades (41.1%) | Win Rate: 30.26%
Average Trade Duration: Optimized for 15-minute timeframe efficiency
Profitability Metrics:
Average Profit per Trade: 11.74 USDT (0.23%)
Average Winning Trade: 151.17 USDT (3.00%)
Average Losing Trade: 60.27 USDT (1.20%)
Win/Loss Ratio: 2.508 (winners are 2.5x larger than losses)
Largest Single Win: 436.02 USDT (8.69%)
Largest Single Loss: 107.41 USDT (controlled risk management)
💰 Financial Performance Breakdown:
Gross Profit: 9,523.93 USDT (9.52% of capital)
Gross Loss: 7,352.48 USDT (7.35% of capital)
Net Profit After Costs: 2,171.44 USDT (2.17%)
Commission Costs: 1,402.47 USDT (realistic trading expenses)
Maximum Equity Run-up: 2,431.66 USDT (2.38%)
⚖️ Risk Management Validation:
Maximum Drawdown: 0.65% showing controlled risk management
Drawdown Recovery: Consistent equity curve progression
Risk per Trade: Successfully maintained below 1.5% per position
Position Sizing: 5% equity allocation proved sustainable throughout testing period
📋 Strategy Performance Characteristics:
✅ Strengths Demonstrated:
Controlled Risk: Maximum drawdown well below industry standards (< 1%)
Positive Expectancy: Win/loss ratio of 2.5+ creates profitable edge
Consistent Performance: Steady equity curve without extreme volatility
Realistic Costs: Includes actual commission and slippage impacts
Sample Size: 185 trades during testing period
⚠️ Performance Considerations:
Win Rate: 34% win rate requires discipline to follow system signals
Market Dependency: Performance may vary significantly in different market conditions
Timeframe Sensitivity: Optimized for 15-minute charts; other timeframes may show different results
Slippage Impact: Real trading conditions may affect actual performance
📊 Benchmark Comparison:
Strategy Return: +2.19% over 12 months
Buy & Hold Bitcoin: +71.12% over same period
Strategy Advantage: Significantly lower drawdown and volatility
Risk-Adjusted Performance: Different risk profile compared to holding cryptocurrency
🎯 Real-World Application Insights:
Expected Trading Frequency:
Average: 15.4 trades per month (185 trades ÷ 12 months)
Weekly Frequency: Approximately 3-4 trades per week
Active Management: Requires regular monitoring during market hours
Capital Requirements:
Minimum Used in Testing: $10,000 for sustainable position sizing
Tested Range: $50,000-$100,000 for comfortable risk management
Commission Impact: 0.075% per trade totaled 1.4% of capital over 12 months
⚠️ IMPORTANT BACKTESTING DISCLAIMERS:
📈 Performance Reality:
Past performance does not guarantee future results. Backtesting results represent hypothetical performance and may not reflect actual trading outcomes due to market changes, execution differences, and emotional factors.
🔄 Market Condition Dependency:
This strategy's performance during the tested period may not be representative of performance in different market conditions, volatility regimes, or trending vs. sideways markets.
💸 Cost Considerations:
Actual trading costs may vary based on broker selection, market conditions, and trade size. Commission rates and slippage assumptions may differ from real-world execution.
🎯 Realistic Expectations:
The 34% win rate requires psychological discipline to continue following signals during losing streaks. Risk management and position sizing are critical for replicating these results.
⚡ Technology Dependencies:
Strategy performance assumes reliable internet connection, platform stability, and timely signal execution. Technical failures may impact actual results.
CONFIGURATION OPTIMIZATION
5-Minute Timeframe Optimization (Advanced Users Only)
⚠️ Important Warning: 5-minute timeframes operate without MTF confirmation, resulting in reduced signal quality and higher false signal rates.
Example 5-Minute Parameters:
Composite Thresholds: Long 6.5, Short 7.0 (vs 15M default 5.0/5.4)
Signal Lookback Bars: 12 (vs 15M default 8)
Volume Multiplier: 2.2 (vs 15M default 1.8)
MTF Timeframe: Disabled (automatic below 30M)
Risk Management Adjustments:
Position Size: Reduce to 3% (vs 5% default)
TP1: 0.8%, TP2: 1.2%, TP3: 2.0% (tighter targets)
SL: 0.8% (tighter stop loss)
Cooldown Minutes: 8 (vs 5 default)
Usage Notes for 5-Minute Trading:
- Wait for higher composite scores before entry
- Require stronger volume confirmation
- Monitor EMA structure more closely
15-Minute Scalping Setup:
TP1: 1.0%, TP2: 1.5%, TP3: 2.5%
Composite Threshold: 5.0 (higher filtering)
TP ATR Multiplier: 7.0
SL ATR Multiplier: 2.5
Volume Multiplier: 1.8 (requires stronger confirmation)
Hold Time: 2 bars minimum
3-Hour Swing Setup:
TP1: 2.0%, TP2: 4.0%, TP3: 8.0%
Composite Threshold: 4.5 (more signals)
TP ATR Multiplier: 8.0
SL ATR Multiplier: 3.2
Volume Multiplier: 1.2
Hold Time: 6 bars minimum
Market-Specific Adjustments
High Volatility Periods:
Increase ATR multipliers (TP: 2.0x, SL: 1.2x)
Raise composite thresholds (+0.5 points)
Reduce position size
Enable cooldown periods
Low Volatility Periods:
Decrease ATR multipliers (TP: 1.2x, SL: 0.8x)
Lower composite thresholds (-0.3 points)
Standard position sizing
Disable extended cooldowns
News Events:
Temporarily disable strategy 30 minutes before major releases
Increase volume requirements (2.0x multiplier)
Reduce position sizes by 50%
Monitor for unusual price action
RISK MANAGEMENT
Dual ROI System: Adaptive vs Fixed Mode
Adaptive RR Mode:
Uses ATR (Average True Range) for automatic adjustment
TP1: 1.0x ATR from entry price
TP2: 1.5x ATR from entry price
TP3: 2.0x ATR from entry price
Stop Loss: 1.0x ATR from entry price
Automatically adjusts to market volatility
Fixed Percentage Mode:
Uses predetermined percentage levels
TP1: 1.0% (default)
TP2: 1.5% (default)
TP3: 2.5% (default)
Stop Loss: 0.9% total (0.6% risk tolerance + 0.3% slippage buffer)(default)
Consistent levels regardless of volatility
Mode Selection: Enable "Use Adaptive RR" for ATR-based targets, disable for fixed percentages. Adaptive mode works better in varying volatility conditions, while fixed mode provides predictable risk/reward ratios.
Stop Loss Management
In Adaptive SL Mode:
Automatically scales with market volatility
Tight stops during low volatility (smaller ATR)
Wider stops during high volatility (larger ATR)
Include 0.3% slippage buffer in both modes
In Fixed Mode:
Consistent percentage-based stops
2% for crypto, 1.5% for forex, 1% for stocks
Manual adjustment needed for different market conditions
Trailing Stop System
Configuration:
Enable Trailing: Activates dynamic stop loss adjustment
Start Trailing %: Profit level to begin trailing (default 1.0%)
Trailing Offset %: Distance from current price (default 0.5%)
Close if Return to Entry: Optional immediate exit if price returns to entry level
Operation: Once position reaches trailing start level, stop loss automatically adjusts upward (longs) or downward (shorts) maintaining the offset distance from favorable price movement.
Timeframe-Specific Risk Considerations
15-Minute and Above (Tested):
✅ Full MTF system active
✅ Standard risk parameters apply
✅ Backtested performance metrics valid
✅ Standard position sizing (5%)
5-Minute Timeframes (Advanced Only):
⚠️ MTF system inactive - local signals only
⚠️ Higher false signal rate expected
⚠️ Reduced position sizing preferred (3%)
⚠️ Tighter stop losses required (0.8% vs 1.2%)
⚠️ Requires parameter optimization
⚠️ Monitor performance closely
1-Minute Timeframes (Limited Testing):
❌ Excessive noise levels
❌ Strategy not optimized for this frequency
Risk Management Practices
Allocate no more than 5% of your total investment portfolio to high-risk trading
Never trade with funds you cannot afford to lose
Thoroughly backtest and validate the strategy with small amounts before full implementation
Always maintain proper risk management and stop-loss settings
IMPORTANT DISCLAIMERS
Performance Disclaimer
Past performance does not guarantee future results. All trading involves substantial risk of loss. This strategy is provided for informational purposes and does not constitute financial advice.
Market Risk
Cryptocurrency and forex markets are highly volatile. Prices can move rapidly against positions, resulting in significant losses. Users should never risk more than they can afford to lose.
Strategy Limitations
This strategy relies on technical analysis and may not perform well during fundamental market shifts, news events, or unprecedented market conditions. No trading strategy can guarantee 100% success or eliminate the risk of loss.
Legal Compliance
You are responsible for compliance with all applicable regulations and laws in your jurisdiction. Consult with licensed financial professionals when necessary.
User Responsibility
Users are responsible for their own trading decisions, risk management, and compliance with applicable regulations in their jurisdiction.

Apex Edge - RSI Trend LinesThe Apex Edge - RSI Trend Lines indicator is a precision tool that automatically draws real-time trendlines on the RSI oscillator using confirmed pivot highs and lows. These dynamic trendlines track RSI structure in motion, helping you anticipate breakout zones, reversals, and hidden divergences.
Every time a new pivot forms, the indicator automatically re-draws the RSI trendline between the two most recent pivots — giving you an always-current view of momentum structure. You’ll instantly see when RSI begins compressing or expanding, long before price reacts.
Key Features: • Dynamic RSI trendlines drawn from the last 2 pivots
• Auto re-draws in real-time as new pivots form
• Optional "Full Extend" or "Pivot Only" modes
• Slope color-coded: green = support, red = resistance
• Built-in dotted RSI levels (30/70 default)
• Alert conditions for RSI trendline breakout signals
• Ideal for spotting divergence, compression, and early SMC confluence
This is not your average RSI — it’s a fully reactive momentum edge overlay designed to give you clarity, structure, and timing from within the oscillator itself. Perfect for traders using Smart Money Concepts, divergence setups, or algorithmic trend tracking.
⚔️ Built for precision. Built for edge. Built for Apex.

Signalgo S&DSignalgo S&D
Signalgo S&D is a next-generation indicator designed for traders who want to harness the true power of supply and demand (S&D) in their trading decisions. Unlike traditional S&D indicators, it leverages proprietary multi-timeframe net volume analysis, trend confirmation, and adaptive trade management.
How Signalgo S&D Works
Multi-Timeframe Net Volume Analysis
Net Volume Calculation: At the heart of Signalgo S&D is a unique net volume engine. It doesn’t just look at price or raw volume, but calculates a net volume value for each bar, factoring in both price movement and the true range of the candle. This is done across multiple timeframes—from 1 minute to 3 months—giving a layered, real-time view of market pressure.
Trend Measurement: The indicator tracks changes in net volume over a customizable trend length, identifying when buying or selling pressure is truly shifting.
Intelligent Signal Generation
Directional Shifts: Buy and sell signals are only considered when net volume flips from negative to positive (or vice versa) and the net volume trend confirms the move.
Multi-Timeframe Confirmation: Strong signals require agreement across several timeframes, filtering out noise and dramatically increasing reliability.
Volume & Momentum Filters: Each signal is further filtered using volume spikes, EMA alignment, and RSI momentum, ensuring that only high-quality, high-probability setups are flagged.
One-Time Event Detection: Signals are triggered only once per event, preventing repeated entries on the same move.
Adaptive Trade Management
Automated Entry/Exit Logic: Every trade signal is paired with a fully automated take-profit (TP), stop-loss (SL), and trailing stop system, all dynamically adjusted to current volatility.
Risk-Reward Scaling: Three profit targets (TP1, TP2, TP3) allow for scaling out or partial exits, while trailing stops lock in gains as the trade progresses.
Visual Feedback: All trade events—entries, exits, TPs, SLs—are clearly marked on the chart for transparency and review.
Inputs & User Controls
Preset Parameters:
Trend Length: Controls how sensitive net volume trend detection is.
Show Labels/Table: Visual toggles for displaying signal and trade management information.
Trade Management:
Show TP/SL Logic: Toggle to display or hide trade management levels.
ATR Length & Multipliers: Fine-tune how SL and TP levels adapt to market volatility.
Enable Trailing Stop: Activate or deactivate dynamic stop movement after TP1.
Entry & Exit Strategy
Entry Logic
Long (Buy) Entry: Triggered when net volume flips positive across multiple timeframes, the trend confirms, and all momentum/volume filters align.
Short (Sell) Entry: Triggered when net volume flips negative across multiple timeframes, with trend and momentum confirmation.
Exit & Trade Management
Stop Loss (SL): Automatically set based on recent volatility (ATR), adapting to the current market environment.
Take Profits (TP1, TP2, TP3): Three profit targets at increasing reward multiples, allowing for flexible trade management.
Trailing Stop: After TP1 is hit, the stop loss moves to breakeven and a trailing stop is activated to lock in further gains.
Event Markers: Each time a TP or SL is hit, a visual label is placed on the chart for full transparency.
Multi-Timeframe Synchronization: Instead of focusing on a single timeframe, this indicator requires confirmation across several, providing a market-wide perspective and filtering out false signals.
Dynamic, Adaptive Management: The built-in TP/SL and trailing logic is not static—it adapts to volatility and market conditions, providing a disciplined, automated approach to exits and risk.
Event-Driven, Not Static: Signals are only generated when all conditions align, and each event is marked only once, eliminating repetitive or redundant signals.
Advanced Filtering: Signals are filtered by volume spikes, EMA and RSI momentum, and trend alignment, ensuring only the highest-quality trades are considered.
Visual & Alert Integration: Every signal and trade event is visually marked and can trigger TradingView alerts, keeping you informed in real time.
Trading Strategy Application
Versatility: Suitable for scalping, day trading, swing trading, and even longer-term positions thanks to its multi-timeframe logic.
Systematic Execution: By automating entries, exits, and risk management, Signalgo S&D helps you trade with discipline and confidence, minimizing emotional bias.
Noise Reduction: The advanced, layered filtering logic means you only see the highest-probability setups, helping you avoid common S&D “fakeouts” and overtrading.

Signalgo S/RSignalgo S/R
Signalgo S/R is a cutting-edge TradingView indicator engineered for traders who want to leverage support and resistance (S/R) in a way that goes far beyond traditional methods. This overview will help you understand its unique approach, inputs, entry and exit strategies, and what truly sets it apart.
How Signalgo S/R Works
Multi-Timeframe S/R Detection
Layered Analysis: Signalgo S/R continuously scans price action across a wide spectrum of timeframes, from 1 minute up to 3 months. This multi-layered approach ensures that both short-term and long-term S/R levels are dynamically tracked and updated.
Advanced Pivot Recognition: Instead of simply plotting static lines, the indicator uses a sophisticated pivot recognition system to identify only the most relevant and recent S/R levels, adapting as the market evolves.
Synchronized Structure: By aligning S/R levels across timeframes, it builds a robust market structure that highlights truly significant zones—areas where price is most likely to react.
Intelligent Breakout & Reversal Signals
Close Confirmation: The indicator only triggers a breakout or breakdown signal when price not just touches, but closes beyond a key S/R level, dramatically reducing false signals.
Multi-Timeframe Confirmation: True buy or sell signals require agreement across several timeframes, filtering out noise and improving reliability.
One-Time Event Detection: Each breakout or breakdown is recognized only once per occurrence, eliminating repetitive signals from the same event.
Inputs & User Controls
Preset Parameters:
Pivot Length: Adjusts how sensitive the S/R detection is to price swings.
Label Offset: Fine-tunes the placement of visual labels for clarity.
Trade Management Controls:
Show TP/SL Logic: Toggle to display or hide take-profit (TP) and stop-loss (SL) levels.
ATR Length & Multipliers: Adapt SL and TP distances to current volatility.
Enable Trailing Stop: Option to activate dynamic stop movement after TP1 is reached.
Entry & Exit Strategy
Entry Logic
Long (Buy) Entry: Triggered when multiple timeframes confirm a breakout above resistance, signaling strong upward momentum.
Short (Sell) Entry: Triggered when multiple timeframes confirm a breakdown below support, indicating strong downward momentum.
Exit & Trade Management
Stop Loss (SL): Automatically set based on recent volatility, always adapting to current market conditions.
Take Profits (TP1, TP2, TP3): Three profit targets are set at increasing reward multiples, allowing for partial exits or scaling out.
Trailing Stop: After the first profit target is reached, the stop loss moves to breakeven and a trailing stop is activated, locking in gains as the trade continues.
Event Markers: Each time a TP or SL is hit, a visual label is placed on the chart for full transparency.
What Separates Signalgo S/R from Traditional S/R Indicators?
True Multi-Timeframe Synchronization: Most S/R tools only look at a single timeframe or plot static levels. Signalgo S/R dynamically aligns levels across all relevant timeframes, providing a comprehensive market map.
Event-Driven, Not Static: Instead of plotting every minor swing, it intelligently filters for only the most actionable S/R levels and signals—reducing chart clutter and focusing attention on what matters.
Breakout Confirmation Logic: Requires a close beyond S/R, not just a wick, to validate breakouts or breakdowns. This greatly reduces false positives.
Automated, Adaptive Trade Management: Built-in TP/SL and trailing logic mean you get not just signals, but a full trade management suite—something rarely found in standard S/R indicators.
Visual & Alert Integration: Every signal, TP/SL event, and trailing stop is visually marked and can trigger TradingView alerts, keeping you informed in real time.
Trading Strategy Application
Scalping to Swing Trading: The multi-timeframe logic makes it suitable for all trading styles, from fast intraday moves to longer-term position trades.
Systematic, Disciplined Execution: By automating entries, exits, and risk management, Signalgo S/R helps you trade with confidence and consistency, removing emotion from the process.
Noise Reduction: The advanced filtering logic means you only see the highest-probability setups, helping you avoid common S/R “fakeouts.”

Signalgo XSignalgo X
Signalgo X is a sophisticated indicator crafted for traders who demand a disciplined, multi-layered approach to market analysis and trade management. This overview will help you understand its capabilities, logic, and how it can elevate your trading.
Core Concept
Signalgo X is built to:
Scan multiple timeframes simultaneously for price, volume, and volatility patterns.
Filter out unreliable signals during periods of market hype or manipulation.
Automate trade management with dynamic take-profit (TP), stop-loss (SL), and trailing logic.
Deliver actionable, visual signals and alerts for timely, confident decisions.
Inputs & Controls
Preset System Parameters:
News Sensitivity: Determines how responsive the indicator is to price moves.
Hype Filter Strength: Sets how aggressively the system avoids volatile, manipulated, or news-driven periods.
User-Configurable:
Show TP/SL Logic: Turn on/off the display of take-profit and stop-loss levels directly on your chart.
How Signalgo X Works
1. Multi-Timeframe Market Analysis
Signalgo X continuously monitors:
Closing price
Trading volume
Volatility (ATR)
across six distinct timeframes, from 1 hour to 3 months. This layered approach ensures that signals are validated by both short-term momentum and long-term trends.
2. Price, Volume, and Volatility Synthesis
Price Change: The system tracks percentage changes over each timeframe to gauge momentum.
Volume Ratio: By comparing current volume to a moving average, it detects unusual spikes that may signal institutional activity or manipulation.
Volatility: Measures the intensity of price movements relative to average ranges, helping to identify breakout or exhaustion scenarios.
3. Proprietary Anti-Hype Filter
A unique scoring mechanism evaluates:
Volume spikes without corresponding price action
Sudden jumps in volatility
Conflicting signals across timeframes
Social hype proxies (e.g., sharp moves on low volume)
If the market is deemed “hyped,” all trading signals are suppressed and a clear warning is shown, keeping you out of unpredictable conditions.
4. Signal Classification & Mapping
Significant Moves: Only price actions that exceed a sensitivity threshold and are confirmed by volume/volatility are considered.
Bullish/Bearish Signals: Generated for each timeframe.
Signal Strength: Categorized as regular, or strong based on multi-timeframe agreement.
Entry & Exit Strategy
Entry Logic
Long (Buy) Entry: Triggered when bullish signals are detected (of any strength) and no hype is present.
Short (Sell) Entry: Triggered when bearish signals are detected and no hype is present.
Exit & Trade Management
Stop Loss (SL): Placed at a calculated distance from entry, adapting to recent volatility.
Take Profits (TP1, TP2, TP3): Three profit targets, each at a greater reward multiple.
Trailing Stop: After the first take-profit is hit, the stop-loss moves to breakeven and a trailing stop is activated to protect further gains.
Event Tracking: The indicator visually marks when each TP or SL is hit, providing real-time feedback.
Chart Plots: All relevant SL, TP, and trailing stop levels are clearly marked for both long and short trades.
Labels: Entry, exit, and signal strength events are color-coded and visually prominent.
Alerts: Built-in alert conditions allow you to set up TradingView notifications for strong/regular buy/sell signals and hype warnings.
Trading Strategy Application
Multi-Timeframe Confirmation: Only strong signals confirmed by several timeframes are acted upon, reducing false positives.
Volume & Volatility Awareness: The indicator avoids low-quality, “fakeout” signals by requiring confirmation from both price and volume/volatility.
Hype Avoidance: Keeps you out of the market during news-driven or manipulated periods, helping to protect your capital.
Automated Discipline: The TP/SL logic enforces a rules-based exit strategy, helping you lock in profits and limit losses without emotional interference.
Who Should Use Signalgo X?
Signalgo X is ideal for traders who want:
Systematic, high-confidence signals
Automated and disciplined trade management
Protection against unpredictable market events
Clear, actionable visuals and alerts

TICK Extreme Levels & AlertsAutomatically draws horizontal lines at +1000 and -1000 TICK levels
Sends alerts when TICK crosses those levels (for potential scalping/reversal setups)
Strategy: How to Use TICK in Real-Time Trading
1. Confirm Market Breadth
Use TICK to confirm broad participation in the move:
• Long S&P futures or SPY? Only buy breakouts if TICK is above +600 to +1000
• Shorting? Confirm with TICK below –600 to –1000
2. Fade Extremes for Scalps
Look for reversals at extreme levels:
• Fade +1200+: market likely overbought short term → scalp short
• Fade –1200–: market likely oversold → scalp long
Use in combo with other signals (like price exhaustion, candlestick reversal, or VWAP touches)
3. Avoid Trading in the Choppy Zone
If TICK remains between –400 and +400, institutions are not committed. This is where fakeouts are common.
4. Time Entries with TICK Swings
For example:
• TICK moves from –800 to +600 = momentum shift → look for long entries
• TICK stalling around +1000 = momentum climax → partial profit or fade play

Coinbase BTC Premium by BIGTAKERBTC Premium Gap Analysis: Binance, Coinbase, Upbit
This indicator provides real-time analysis and visualization of the premium gap between the Binance BTCUSDT price and the BTC prices on Coinbase (BTCUSD) and Upbit (BTCKRW).
Key Features
Coinbase Premium Gap
Measures the price difference between Coinbase and Binance as a percentage.
To improve visibility, the Coinbase premium is visually amplified by 10x.
Upbit Premium Gap
Calculates the premium by comparing Upbit's BTCKRW price (converted into USD using the real-time USDKRW exchange rate) against Binance BTCUSDT.
Dynamic Color Coding
Premiums above 0% are displayed in lime green, indicating positive premiums.
Premiums below 0% are displayed in red, indicating discounts.
Real-Time Labels
Displays real-time premium values for both Coinbase and Upbit on the right side of the chart.
Additional Notes
Upbit premiums are adjusted for the USD/KRW exchange rate to ensure accurate USD-based comparison.
The Coinbase premium is magnified visually (10x) to better capture minor movements, while the actual premium value remains correctly displayed.
The indicator is optimized for traders who monitor global BTC market price disparities across major exchanges.
How to Use
Quickly track global BTC price discrepancies across Binance, Coinbase, and Upbit.
Detect "Kimchi Premium" conditions in the Korean market through Upbit premiums.
Analyze buying and selling pressure in North American markets through Coinbase premiums.