Algo Smart Pro🚀 Algo Smart Pro: The Ghost Algorithm
Algo Smart Pro is not just another indicator; it is a sophisticated Neural-based Algorithm designed to decode institutional market behavior.
By integrating advanced Order Flow Analysis with Smart Money Concepts (SMC), it exposes the hidden liquidity traps set by big banks.
Key Algorithmic Features:
Institutional Liquidity Detection: Tracks where the "Smart Money" is building positions before the move.
Dynamic Order Block Filtering: Unlike static indicators, our algorithm filters out weak blocks and highlights high-probability displacement zones.
Real-time Delta Volume Engine: Monitors the raw buying/selling pressure behind every candle.
Automated Risk-to-Reward Ratio: Precision entry with 3-layered institutional targets.
Link :
Telegram
WhatsApp
www.Algofxglobal.com
Tradingstrategy

Multi-VWAP Pro (HP) + Alerts - par Alphaomega18 Multi-VWAP Pro High-Precision (D/W/M) – by alphaomega18
🚀 Overview
Elevate your institutional analysis with the Multi-VWAP Pro High-Precision, a comprehensive tool designed for traders who demand surgical accuracy.
Most standard VWAP indicators lag or shift when changing timeframes. This script solves that by using a 1-minute data polling engine (request.security), ensuring your Daily, Weekly, and Monthly levels remain rock-solid and accurate, whether you are on a 1m, 15m, or 1h chart.
💎 Key Features
High-Precision Engine: Calculation based on 1-minute intraday data for maximum mathematical accuracy.
Multi-Timeframe Anchors: View Daily, Weekly, and Monthly VWAPs simultaneously.
Dynamic Color Logic: The Daily VWAP turns Green when the price is above and Red when below for instant trend bias.
Triple SD Bands: 3 fully customizable Standard Deviation bands for each timeframe to identify exhaustion zones.
Smart Alerts: Fully programmable notifications for price crosses on all levels.
Clean Labels: Real-time labels on the price scale for a professional, organized look.
📈 Trading Strategy: The Power of Confluence
Using three different VWAP anchors allows you to see the market through multiple lenses. Here is how to use this tool:
1. The Institutional Confluence
The strongest setups occur when two or more VWAP lines overlap.
The Setup: If the Daily VWAP clusters with the Weekly VWAP, it creates a "Hard Floor/Ceiling."
The Trade: Look for high-probability bounces in these zones where institutions defend their average price.
2. Mean Reversion with SD3 Bands
The 3rd Standard Deviation (SD3) represents price extremes.
The Trade: When price pierces a Daily SD3, look for a reversal back toward the VWAP (Mean Reversion), especially if it aligns with a Weekly or Monthly SD2 band.
3. Trend Confirmation
Bullish Bias: If the Daily VWAP is Green, prioritize "Buy the Dip" on lower SD bands.
Bearish Bias: If the Daily VWAP is Red, prioritize "Sell the Rip" on upper SD bands.
💡 Pro Tip for my Followers
"Alignment is king. When the Daily, Weekly, and Monthly VWAPs all slope in the same direction, you have a high-conviction trend. Follow me for more high-precision tools and market insights!"
🛠 Settings & Customization
Visibility: Toggle any VWAP or SD band on/off.
Full Color Control: Pick your own colors for Weekly and Monthly lines.
Adjustable Multipliers: Fine-tune the volatility bands (SD1, SD2, SD3) for any asset.

Multi-VWAP Pro (HP) + Alerts - par alphaomega18Multi-VWAP Pro High-Precision (D/W/M) – by alphaomega18
🚀 Overview
Elevate your institutional analysis with the Multi-VWAP Pro High-Precision, a comprehensive tool designed for traders who demand surgical accuracy.
Most standard VWAP indicators lag or shift when changing timeframes. This script solves that by using a 1-minute data polling engine (request.security), ensuring your Daily, Weekly, and Monthly levels remain rock-solid and accurate, whether you are on a 1m, 15m, or 1h chart.
💎 Key Features
High-Precision Engine: Calculation based on 1-minute intraday data for maximum mathematical accuracy.
Multi-Timeframe Anchors: View Daily, Weekly, and Monthly VWAPs simultaneously.
Dynamic Color Logic: The Daily VWAP turns Green when the price is above and Red when below for instant trend bias.
Triple SD Bands: 3 fully customizable Standard Deviation bands for each timeframe to identify exhaustion zones.
Smart Alerts: Fully programmable notifications for price crosses on all levels.
Clean Labels: Real-time labels on the price scale for a professional, organized look.
📈 Trading Strategy: The Power of Confluence
Using three different VWAP anchors allows you to see the market through multiple lenses. Here is how to use this tool:
1. The Institutional Confluence
The strongest setups occur when two or more VWAP lines overlap.
The Setup: If the Daily VWAP clusters with the Weekly VWAP, it creates a "Hard Floor/Ceiling."
The Trade: Look for high-probability bounces in these zones where institutions defend their average price.
2. Mean Reversion with SD3 Bands
The 3rd Standard Deviation (SD3) represents price extremes.
The Trade: When price pierces a Daily SD3, look for a reversal back toward the VWAP (Mean Reversion), especially if it aligns with a Weekly or Monthly SD2 band.
3. Trend Confirmation
Bullish Bias: If the Daily VWAP is Green, prioritize "Buy the Dip" on lower SD bands.
Bearish Bias: If the Daily VWAP is Red, prioritize "Sell the Rip" on upper SD bands.
💡 Pro Tip for my Followers
"Alignment is king. When the Daily, Weekly, and Monthly VWAPs all slope in the same direction, you have a high-conviction trend. Follow me for more high-precision tools and market insights!"
🛠 Settings & Customization
Visibility: Toggle any VWAP or SD band on/off.
Full Color Control: Pick your own colors for Weekly and Monthly lines.
Adjustable Multipliers: Fine-tune the volatility bands (SD1, SD2, SD3) for any asset.

high-frequency scalping strategy by Alphaomega18Alphaomega18 – High-Frequency Scalping Engine (1m)
Institutional Logic | Explosive Momentum | Session-Based Precision
🔬 Strategy Overview
Alphaomega18 is a next-generation high-frequency scalping strategy engineered exclusively for the 1-minute timeframe (1m).
It is built around a proprietary Source Shift Algorithm, comparing:
SMA 3 (Close-based)
SMA 5 (Open-based)
Unlike traditional moving average crossovers, Alphaomega18 measures instantaneous momentum displacement between candle opens and real-time price action. This allows the strategy to detect and exploit impulsive moves at their inception, before lagging indicators can react.
⚙️ Core Technical Edge
Proprietary Open vs Close SMA displacement logic
Ultra-fast signal generation optimized for scalping environments
Designed to operate efficiently in high-volatility conditions
Minimal indicator lag – price leads the signal
This structure makes Alphaomega18 particularly effective during liquidity injections such as market opens and session transitions.
🚀 Verified Performance Highlights
Backtested Period: December 22, 2025 – January 18, 2026
Nasdaq Futures (NQ) – New York Open
With an optimized 50-point Stop Loss, Alphaomega18 delivered institutional-grade performance:
Net Profit: +$21,035.00
Total Return: +2,103.50%
Profit Factor: 1.34 (high consistency)
Additional Results – New York Session
ES (S&P 500): +$5,350.00 (+267.50%) | PF: 1.181
BTC/USD: +$2,921.67 (+146.08%) | PF: 1.61+
24/7 Mode – Crypto & Metals
Bitcoin (BTC): +$10,932.00 (+547.53%)
Gold (XAU/USD): +$474.73 (+21.74%)
🕒 Smart Session Filter (Key Feature)
Alphaomega18 integrates a multi-session trading filter, allowing traders to focus exclusively on high-probability market windows:
New York Open (09:30–11:45 NY time)
The “Phenomenal Window” where the +2103% NQ performance was achieved.
European Session (08:00–17:00 Paris time)
Optimized for EUR/USD and DAX scalping.
Full-Time Mode (24/7)
Recommended for cryptocurrencies and gold.
This feature significantly reduces market noise and overtrading.
📊 Trading Rules (Clear & Objective)
Recommended Assets:
Nasdaq (NQ), S&P 500 (ES), Bitcoin (BTC)
Timeframe:
1 minute (1m) — mandatory
Risk Settings:
NQ: 50-point Stop Loss
Other assets: 40-point Stop Loss
Signal Logic:
BUY: SMA 3 (green) crosses above SMA 5 (red)
SELL: SMA 3 (green) crosses below SMA 5 (red)
🧠 Who Is This Strategy For?
✔ Active scalpers
✔ Futures & crypto traders
✔ Traders seeking session-based precision
✔ Users with low-spread / fast-execution brokers
⚠️ Risk Disclaimer
Scalping involves substantial risk and requires disciplined risk management.
Alphaomega18 is a high-frequency strategy and performs best with low spreads, minimal slippage, and proper execution conditions. Past performance does not guarantee future results.

HMA Trend Scalper [wjdtks255]🚀 HMA Trend Scalper V1: Ultimate Precision Strategy
1. Overview
This indicator captures immediate market trend reversals based on the high-responsiveness of the HMA (Hull Moving Average). It doesn't just show direction; it simultaneously calculates ATR-based volatility to generate optimal Take Profit (TP) and Stop Loss (SL) lines in real-time.
2. How to Trade
🚀 LONG Entry:
The HMA line must be Green, and the price must be positioned above the line.
Enter when the price breaks above the high of the last 5 bars and the 🚀 LONG label appears.
💀 SHORT Entry:
The HMA line must be Red, and the price must be positioned below the line.
Enter when the price breaks below the low of the last 5 bars and the 💀 SHORT label appears.
🎯 Exit (TP/SL):
Close the position immediately when the price touches the Aqua line (TP) or the Yellow line (SL).
3. Key Features
Smart Cleaning: By enabling the 'Hide Past Records' option, the indicator automatically removes previous labels and lines when a new signal occurs, keeping your chart clean and focused.
Real-time Tracking: TP and SL lines extend candle-by-candle as the price moves, providing superior readability for active trades.
High Visibility: Status panels like 🎯 TP Hit or ⚠️ SL Hit are generated upon trade completion, allowing you to intuitively track your trading results.
4. Recommended Settings
Sensitivity: 15 (Optimized for Scalping).
TP/SL Multipliers: Fully customizable to fit your personal risk-to-reward strategy.

Trend Cloud with Buy/Sell Text [wjdtks255]Indicator Title: Trend Cloud with Buy/Sell Signal Pro
Short Description
A high-probability trend-following indicator based on Supertrend dynamics, enhanced with a Volume Filter to pinpoint explosive entries while minimizing false breakouts.
Detailed Description (Overview)
The Trend Cloud with Buy/Sell Text is designed for traders who prioritize clarity and momentum. It visualizes market trends through a "Trend Cloud" system and generates real-time BUY/SELL signals only when price action is backed by significant trading volume.
Key Technical Pillars
Dynamic Trend Cloud: Fills the area between the price and the Supertrend line, providing immediate visual feedback on trend strength and potential support/resistance zones.
Smart Volume Filter: A unique logic that compares current volume against a 20-period moving average. Labels only appear when a trend shift occurs with above-average volume, filtering out weak "fakeouts."
No-Repaint Labels: Signals are calculated and fixed at the close of the candle, ensuring that the BUY/SELL text remains permanent for reliable historical backtesting and live execution.
The Alpha Hunter Strategy (How to Trade)
1. Long Entry (Buy)
Condition: The cloud turns Aqua and a "BUY" label appears below the candle.
Confirmation: Ensure the price remains above the Aqua Trend Line.
Volume Check: The indicator automatically verifies if the volume is higher than the 20-period average before displaying the label.
Exit: Exit when a "SELL" signal appears or the price closes below the Aqua line.
2. Short Entry (Sell)
Condition: The cloud turns Red and a "SELL" label appears above the candle.
Confirmation: Price should stay below the Red Trend Line.
Exit: Exit when a "BUY" signal appears or the price closes above the Red line.
Input Parameters & Optimization
ATR Period (Default: 10): Determines the sensitivity to price volatility.
ATR Factor (Default: 3.0): Controls the distance of the trend line. Increase to 3.5 - 4.0 to reduce noise in choppy markets.
Volume Filter (Toggle): When enabled, only high-momentum signals are shown.
Recommended Usage
Best Timeframes: 15m, 1h, 4h.
Asset Classes: Highly effective for Crypto (BTC/ETH) and high-volume stocks.

Market Structure Break + RSI ExitSignal Architect™ — Developer Note
This indicator includes a limited visual preview of a proprietary power signal I have personally developed and refined across futures, algorithmic systems, options, and equity trading.
Every tool I release is built with one principle in mind:
clarity of direction without over-promising or under-delivering.
That is why all Signal Architect™ tools emphasize:
Market structure first
High-probability directional context
Clear, visual risk framing
No predictive claims, no curve-fit illusions
What you are seeing here is only a small glimpse of a much broader internal framework I actively use in live environments.
🧠 Background & Scope
Over the years, I have personally developed 800+ programs spanning:
Equities
Futures
Options
Dividend & income systems
Portfolio construction and allocation logic
This includes 40+ Nasdaq-100 trading bots, several of which operate under extremely strict rule-sets and controlled deployment conditions.
Nothing shared publicly represents my full system—only educational and analytical previews designed to demonstrate how structure and probability can be aligned visually.
🤝 Support & Collaboration
If you find value in what I share:
Please subscribe, boost, and share my scripts, Ideas, and MINDS posts
You are always welcome to message me directly with questions or if you need something built or adapted
Constructive feedback and collaboration are encouraged
For traders looking to go deeper, I offer optional memberships that include:
Access to additional signals
Early previews
Occasional free tools and upgrades to support your trading journey
🔗 Membership & Signals:
trianchor.gumroad.com
⚠️ Final Note
Everything published publicly is for educational and analytical purposes only.
Markets carry risk. Discipline and risk management always come first.
— Signal Architect™
You can Find my personally developed GBT below
chatgpt.com
chatgpt.com
chatgpt.com
********************************************************************************************************************WHAT THIS INDICATOR DOES
This indicator is a structure-first breakout engine designed around how price actually transitions between balance and expansion.
It does not predict reversals.
It waits for confirmed market structure breaks, then:
Anchors risk using recent wave extremes
Projects deterministic TP/SL zones
Tracks outcomes visually and statistically
Optionally exits early when momentum exhausts (RSI fade)
This makes it ideal for:
Directional traders
Swing continuation setups
Expansion phases after compression
🧠 CORE SIGNAL ARCHITECT LOGIC
1️⃣ Market Structure Identification
The system uses pivot highs and pivot lows to define true structural levels:
Pivot High break → Long bias
Pivot Low break → Short bias
This avoids:
Random candle breakouts
Intrabar noise
False momentum spikes
Only confirmed structural levels are traded.
2️⃣ Entry Trigger (Structure Break)
A trade is triggered only when price closes through structure:
Direction Requirement
Long Close breaks above last confirmed pivot high
Short Close breaks below last confirmed pivot low
📌 Important:
No signal fires if you are already in a trade — one position at a time, clean sequencing.
3️⃣ Stop-Loss Logic (Wave-Anchored Risk)
Stops are not arbitrary.
They are anchored to:
Recent wave low (for longs)
Recent wave high (for shorts)
This ensures:
Stops sit beyond real market structure
Risk reflects actual auction failure, not candle noise
4️⃣ Take-Profit Logic (Risk × Reward)
Take-profit is mechanically derived:
TP = Risk × Risk:Reward Ratio
Examples:
RR = 1.0 → TP = same distance as SL
RR = 1.5 → TP = 1.5× SL distance
RR = 2.0 → TP = expansion-focused swings
This keeps results comparable, repeatable, and testable.
5️⃣ Optional RSI Exit (Momentum Fade)
RSI is not used for entries.
It is used only as an optional early-exit filter:
Trade RSI Condition
Long RSI crosses down from Overbought
Short RSI crosses up from Oversold
This is designed for:
Reducing give-back during exhaustion
Tight markets where expansion stalls
Volatility contraction environments
🔕 You can disable this entirely for pure structure trading.
📦 VISUAL OUTPUTS
🔲 Risk Boxes (Core Feature)
Every trade plots:
Green box = profit zone
Red box = loss zone
Boxes:
Extend forward bar-by-bar
Stop updating once trade resolves
Allow instant visual expectancy review
🔺 Signal Arrows
Green ▲ = Structure Break Long
Red ▼ = Structure Break Short
No repainting.
No intrabar guessing.
🧮 Performance Stats Table
Tracks:
Total trades
Wins
Losses
Win rate %
📌 This is contextual feedback, not a promise of future results.
🎯 RECOMMENDED TIMEFRAMES (VERY IMPORTANT)
This indicator performs best when structure matters.
⭐ PRIMARY TIMEFRAMES (Recommended)
Timeframe Use Case
15-Minute Intraday structure breaks, clean expansions
30-Minute Session-level continuation
1-Hour Swing structure, reduced noise
2-Hour Institutional rhythm, fewer false breaks
4-Hour Macro structure legs
✔ These timeframes allow pivots to form properly
✔ Stops remain structurally meaningful
✔ RR math stays realistic
⚠️ SECONDARY / CONDITIONAL
Timeframe Notes
5-Minute Use only during trend days
Daily Works well, but slower signal frequency
🚫 NOT RECOMMENDED
Timeframe Why
1–3 Minute Too much pivot distortion
Tick / Seconds Breaks structure logic entirely
This is not a scalping indicator.
🟩 BACKGROUND BIAS SHADING
Green tint → Active long bias
Red tint → Active short bias
No tint → Neutral / flat
This helps:
Avoid over-trading
Stay aligned with active structure
Recognize when the system is waiting
🧠 HOW TO USE THIS CORRECTLY
Best Practices
✔ Trade only in expansion environments
✔ Let pivots form before expecting signals
✔ Respect the stop — it is structurally valid
✔ Journal results per timeframe
Avoid
✘ Forcing trades in chop
✘ Using this as a reversal indicator
✘ Lowering timeframe to “get more signals”
⚠️ IMPORTANT DISCLAIMER
This indicator is for educational and analytical purposes only.
It does not:
Predict markets
Guarantee profits
Replace risk management
Trading involves substantial risk and can result in loss of capital.
Past performance does not guarantee future results.

HMA Trend Scalper V1[wjdtks255]
Overview
This indicator is a high-performance trend-following system optimized for crypto futures trading. It provides clear entry signals and dynamic, real-time risk management tools to help traders stay on the right side of the market.
Key Features
Dynamic Trend Tracking: Uses a specialized HMA (Hull Moving Average) to filter market noise and identify the core trend.
Real-time TP/SL Extension: Unlike static indicators, the Take Profit (TP) and Stop Loss (SL) lines extend candle-by-candle along with the price action.
Clean Chart UI: Lines only exist from the entry point to the current candle, preventing chart clutter.
Automatic Completion: Once the price hits a target, the line stops extending and marks the result (Target Hit or Stop Out).
Trading Strategy (How to Trade)
1. Long Entry (🚀 LONG)
Condition: The price must be above the trend line, and a breakout of the recent 5-candle high must occur with significant volume.
Action: Enter a Long position when the "🚀 LONG" label appears.
Exit: Hold until the price reaches the Cyan (Aqua) TP line or hits the Yellow SL line.
2. Short Entry (💀 SHORT)
Condition: The price must be below the trend line, and a breakdown of the recent 5-candle low must occur with significant volume.
Action: Enter a Short position when the "💀 SHORT" label appears.
Exit: Hold until the price reaches the Cyan (Aqua) TP line or hits the Yellow SL line.
3. Risk Management
Stop Loss: The indicator automatically calculates the optimal SL based on recent volatility (ATR) and swing points.
Take Profit: The TP is set at a calculated ratio to ensure a positive risk-to-reward setup.
Settings
Trend Sensitivity: Adjust the HMA length to match your preferred timeframe (Scalping vs. Swing).
Volume Multiplier: Filter out weak moves by increasing the volume breakout requirement.
Custom Styles: Fully customize line colors, widths, and styles (Solid, Dashed, Dotted) in the settings menu.

Trading Discipline Mirror How deciplined you are?
Trading Discipline Journal – Smart Feedback helps traders stay disciplined and emotionally controlled. Select your winning or losing reasons, and the indicator automatically calculates scores, evaluates your behavior, and gives clear feedback on whether you’re trading in a safe mindset or a risky one.

Smart Moving Average Dynamics [ChartNation]Smart Moving Average Dynamics (SMAD) — by Chart Nation
What it does:
SMAD maps how far price deviates from a chosen moving average and normalizes that distance into a bounded oscillator (−100…+100). It detects extreme expansions and prints non-repainting dots when the move exits an extreme. Price-level rails are drawn from those events (with optional fade/expiry) to highlight likely reaction zones. The MA line is colored by bias. A slim gauge summarizes the current oscillator percentile; a compact info panel shows TF, Trend, Volume rank, and Volatility rank.
How it works (high-level, closed-source)
Core signal: diff = price – MA(type, length) where MA can be SMA/EMA/RMA/WMA/VWMA.
Normalization (choose one):
Highest Abs (N): scales diff by the highest absolute excursion over N bars (fast, adaptive).
Z-Score: scales by stdev(diff, N) and maps ±σ to ±100 via a user factor.
ATR-Scaled: scales by ATR * k, relating deviation to current volatility.
Percent Rank: ranks the magnitude of |diff| over N bars and reapplies the original sign.
All methods clamp to −100…+100 to keep visuals consistent across assets/TFs.
Extremes & confirmation: Dots print only when an extreme exits ±100 (optionally on bar close) and can be filtered by linger bars and short-term slope flip, reducing one-bar spikes.
Rails: When an extreme confirms, a rail is anchored at the corresponding price swing and can soft-fade and/or expire after X bars.
Trend color: MA color = Up (green) when oscillator > threshold and MA slope > 0; Down (magenta) for the opposite; Neutral otherwise.
Context panels:
Slim Gauge: current oscillator bucket (0–20) with the exact normalized reading.
Info Panel: TF, Trend, and 0–100 percent-ranks of Volume and ATR-based volatility grouped as Low / Medium / High.
SMAD isn’t a collection of plots; it’s a single framework that integrates:
a deviation-from-MA engine,
four interchangeable normalization models (selected per market regime),
a gated extreme detector (linger + slope + confirm-on-close), and
time-aware rails with soft fade/expiry, presented with a minimal gauge and info panel so traders can compare regimes across TFs without recalibrating thresholds.
How to use (examples, not signals)
Mean-revert plays: When price exits an extreme and prints a dot, look for reactions near the new rail. Combine with your S/R and risk model.
Trend continuation: In strong trends the oscillator will spend more time above/below zero; the colored MA helps keep you aligned and avoid fading every push.
Regime switching: Try Percent Rank or ATR-Scaled on choppy/alts; Z-Score on majors; Highest Abs (N) when you want fastest adaptation.
Risk ideas: Rails can be used as partial-take or invalidate levels. Always backtest on your pair/TF.
Key settings
Normalization: Highest Abs / Z-Score / ATR-Scaled / Percent Rank (with N & factors).
Filters: Extreme threshold, linger bars, slope lookback, confirm on close.
Rails: Expire after X bars; soft-fade step.
Panels: Slim gauge (bottom-right), Info panel (middle-right).
Notes & limits
Prints confirm after the extreme exits ±100; nothing repaints retroactively.
Normalization can change sensitivity—choose the one matching your asset’s regime.

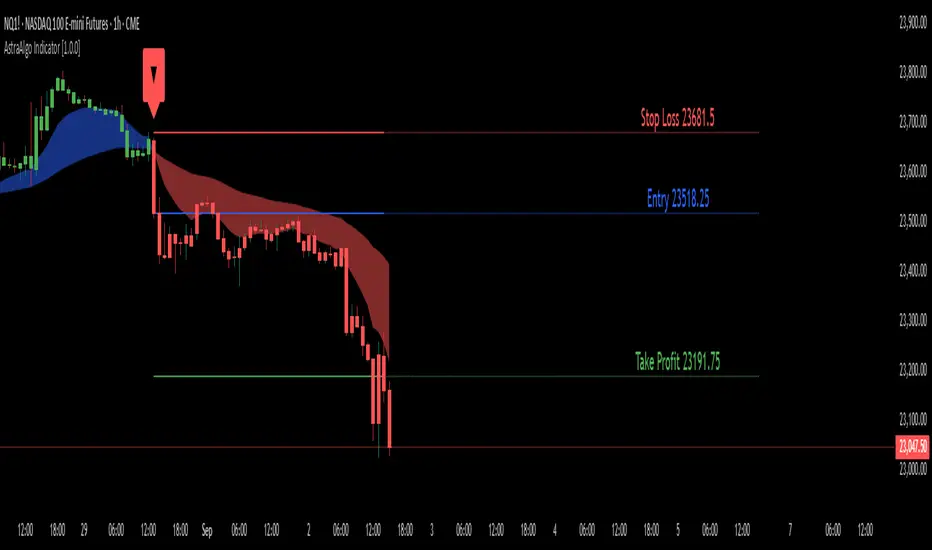
AstraAlgo IndicatorOVERVIEW
The AstraAlgo Indicator delivers precise, actionable trade signals on TradingView. With configurable signal modes, dynamic support and resistance, and a fully adjustable alerts system, it helps traders make informed decisions and manage risk effectively.
SIGNAL MODES
Signal Modes are the core of the AstraAlgo Indicator, providing users with proprietary trade signals tailored to their preferred complexity and style.
BAR COLORING
Bar Coloring provides a clear visual distinction between bullish and bearish candlesticks, allowing traders to interpret price action at a glance. This feature helps identify momentum and trend direction without analyzing raw price data.
ASTRA CLOUD
Astra Cloud is a dynamic support and resistance overlay that visually highlights key price zones on your TradingView charts. These zones adjust in real time to reflect market movements, helping traders identify areas of potential price reaction.
ALERTS
Alerts in the AstraAlgo Indicator are designed to keep traders informed of key market movements in real time. They notify you whenever a significant trading signal appears on your chart, ensuring you can act promptly even when you’re away from TradingView.
Extremum Range MA Crossover Strategy1. Principle of Work & Strategy Logic ⚙️📈
Main idea: The strategy tries to catch the moment of a breakout from a price consolidation range (flat) and the start of a new trend. It combines two key elements:
Moving Average (MA) 📉: Acts as a dynamic support/resistance level and trend filter.
Range Extremes (Range High/Low) 🔺🔻: Define the borders of the recent price channel or consolidation.
The strategy does not attempt to catch absolute tops and bottoms. Instead, it enters an already formed move after the breakout, expecting continuation.
Type: Trend-following, momentum-based.
Timeframes: Works on different TFs (H1, H4, D), but best suited for H4 and higher, where breakouts are more meaningful.
2. Justification of Indicators & Settings ⚙️
A. Moving Average (MA) 📊
Why used: Core of the strategy. It smooths price fluctuations and helps define the trend. The price (via extremes) must cross the MA → signals a potential trend shift or strengthening.
Parameters:
maLength = 20: Default length (≈ one trading month, 20-21 days). Good balance between sensitivity & smoothing.
Lower TF → reduce (10–14).
Higher TF → increase (50).
maSource: Defines price source (default = Close). Alternatives (HL2, HLC3) → smoother, less noisy MA.
maType: Default = EMA (Exponential MA).
Why EMA? Faster reaction to recent price changes vs SMA → useful for breakout strategies.
Other options:
SMA 🟦 – classic, slowest.
WMA 🟨 – weights recent data stronger.
HMA 🟩 – near-zero lag, but “nervous,” more false signals.
DEMA/TEMA 🟧 – even faster & more sensitive than EMA.
VWMA 🔊 – volume-weighted.
ZLEMA ⏱ – reduced lag.
👉 Choice = tradeoff between speed of reaction & false signals.
B. Range Extremes (Previous High/Low) 📏
Why used: Define borders of recent trading range.
prevHigh = local resistance.
prevLow = local support.
Break of these levels on close = trigger.
Parameters:
lookbackPeriod = 5: Searches for highest high / lowest low of last 5 candles. Very recent range.
Higher value (10–20) → wider, stronger ranges but rarer signals.
3. Entry & Exit Rules 🎯
Long signals (BUY) 🟢📈
Condition (longCondition): Previous Low crosses MA from below upwards.
→ Price bounced from the bottom & strong enough to push range border above MA.
Execution: Auto-close short (if any) → open long.
Short signals (SELL) 🔴📉
Condition (shortCondition): Previous High crosses MA from above downwards.
→ Price rejected from the top, upper border failed above MA.
Execution: Auto-close long (if any) → open short.
Exit conditions 🚪
Exit Long (exitLongCondition): Close below prevLow.
→ Uptrend likely ended, range shifts down.
Exit Short (exitShortCondition): Close above prevHigh.
→ Downtrend likely ended, range shifts up.
⚠️ Important: Exit = only on candle close beyond extremes (not just wick).
4. Trading Settings ⚒️
overlay = true → indicators shown on chart.
initial_capital = 10000 💵.
default_qty_type = strategy.cash, default_qty_value = 100 → trades fixed $100 per order (not lots). Can switch to % of equity.
commission_type = strategy.commission.percent, commission_value = 0.1 → default broker fee = 0.1%. Adjust for your broker!
slippage = 3 → slippage = 3 ticks. Adjust to asset liquidity.
currency = USD.
margin_long = 100, margin_short = 100 → no leverage (100% margin).
5. Visualization on Chart 📊
The strategy draws 3 lines:
🔵 MA line (thickness 2).
🔴 Previous High (last N candles).
🟢 Previous Low (last N candles).
Also: entry/exit arrows & equity curve shown in backtest.
Disclaimer ⚠️📌
Risk Warning: This description & code are for educational purposes only. Not financial advice. Trading (Forex, Stocks, Crypto) carries high risk and may lead to full capital loss. You trade at your own risk.
Testing: Always backtest & demo test first. Past results ≠ future profits.
Responsibility: Author of this strategy & description is not responsible for your trading decisions or losses.

Xmoon – 3 Push Divergence – PremiumWhat the Xmoon Indicator Does and Why It’s Special
The Xmoon Indicator is an advanced and unique analytical tool, built on years of trading experience, research, and development. It is not merely a combination of a few simple indicators; it is a comprehensive, intelligent system that brings together the three main pillars of trading success—strategy, risk management, and trading psychology—into a single integrated tool.
Strategy
• Xmoon’s core algorithm is based on the 3 Push Divergence pattern in the RSI —a pattern not offered in other indicators. Most existing tools only detect divergence between two highs or two lows, whereas Xmoon can identify three consecutive highs or three consecutive lows with a momentum mismatch, which considerably increases the statistical likelihood of a trend reversal.
Risk Management
• Automatically calculates the size of each step entry based on per-step capital allocation, leverage, and entry/exit prices, using precise, weighted calculations.
• These multi-step calculations run in real time and are shown clearly in the Information Box for quick reading.
• A Liquidity Line (risk threshold) is computed for each setup and plotted on the chart so you can see at a glance where the position would be liquidated (futures) or where the analysis is invalidated (spot).
Psychology & Decision-Making
• From the moment a signal is generated, Xmoon plots all key levels— step entries, risk-free levels, targets, and the liquidity line —so the trader knows from the outset:
o where the profitable exit is if the market follows the analysis;
o where the break-even (risk-free) exit is if the market moves against the analysis.
• This approach significantly reduces stress and emotional decision-making, because both favorable and unfavorable scenarios are predefined.
Logic & Workflow of the Xmoon Indicator
1️⃣ Pivot Detection and Classification
Xmoon first detects price pivots on the chart and classifies them— based on the bar distance between consecutive pivot highs/lows—into four tiers: Super Minor, Minor, Mid-Major, and Major .
The greater the distance between pivots, the larger and more reliable the pivot becomes—though signals are generated less frequently.
2️⃣ Detecting the 3 Push Divergence Pattern
At this stage, Xmoon identifies 3 Push Divergence patterns. The pattern forms when price prints three consecutive pivots in the same direction, i.e.:
• Bullish: three successive higher highs
• Bearish: three successive lower lows
Meanwhile, at the corresponding points on the RSI , momentum moves the other way:
• Bullish case: RSI peaks step down each time — weakening buying pressure
• Bearish case: RSI troughs step up each time — weakening selling pressure
This repeated price–momentum disagreement three times in a row can significantly increase the likelihood of a trend reversal.
3️⃣ Plotting the Pattern and Key Levels
After the pattern is detected, Xmoon draws the divergence lines and plots the following levels on the chart:
• Step entry lines based on the user-defined number of steps and allocated capital.
• Risk-free (break-even) lines for exits without profit or loss.
• Target lines indicating minimum profit objectives.
• Liquidity level (risk threshold) marking where equity would be wiped out in futures.
These visuals let the trader see, at a glance, the full picture of the pattern, planned entries/exits, and the risk range.
4️⃣ Information Box
After the pattern is detected, Xmoon can display an on-chart Information Box alongside each detected pattern (when enabled in the settings). It includes:
• Pivot type: Super Minor, Minor, Mid-Major, or Major.
• Confirmation filters:
1. Higher-timeframe trend based on the 200-period moving average (MA200).
2. Higher-timeframe overbought/oversold status based on RSI.
• Suggested entry size: based on actual capital and leverage.
This box helps the trader quickly see the pattern quality, overall market context, and the suggested position size.
ℹ️ Explanation of Confirmation Filters
Using these filters can increase signal accuracy.
This information is built into the Xmoon indicator, so you don’t need to add any extra indicators or tools to the chart. Xmoon performs the comparisons in real time and displays the filter results in the Information Box .
• Higher-timeframe trend filter: If the higher-timeframe trend based on the 200-period moving average (MA200) is bullish, buy/long signals are stronger; if it’s bearish, sell/short signals are stronger.
• Higher-timeframe overbought/oversold filter: If RSI is in the overbought zone, the probability of success for sell/short signals is higher; in the oversold zone, the probability of success for buy/long signals is higher.
🧩 What are the components of the Xmoon indicator, and why are they combined?
• Core strategy: trend-reversal signals via a proprietary 3 Push Divergence algorithm.
• Multi-stage confirmation: higher-timeframe trend based on MA200 , plus higher-timeframe RSI overbought/oversold confirmation.
• Advanced position sizing: step-based sizing and weighted averaging .
• Structured exit management: risk-free levels, targets , and liquidity level.
• Supports fast decision-making: all vital information at a glance.
This combination turns Xmoon into a complete, practical system that has not been implemented in this integrated way in any similar tool on TradingView, and it is precisely the sum of these features in a single indicator that sets Xmoon apart from comparable tools.
How to Use the Xmoon Indicator
1️⃣ Add to chart: Add the indicator to the chart of your chosen symbol.
2️⃣ Configure parameters: In Settings , adjust the following to match your strategy:
• Number of Entry steps: 2 to 10 steps
• Pivot type: Super Minor / Minor / Mid-Major / Major
• Pattern direction: Bullish / Bearish
• Display options: show lines and the Information Box
• Capital per trade
• Higher-timeframe filters: timeframes for Trend and RSI
3️⃣ Enable alerts: Turn on alerts to receive immediate notifications when a 3 Push Divergence pattern is detected.
4️⃣ Review the Information Box: To assess pattern strength and alignment with the market after a signal appears, check:
• Pivot size: Super Minor / Minor / Mid-Major / Major (for gauging pattern strength)
• Confirmation filters:
1. Whether the detected pattern aligns with the higher-timeframe trend
2. Whether the detected pattern aligns with the higher-timeframe RSI overbought/oversold condition
These details help you decide whether to enter the trade.
5️⃣ Step Entries
After reviewing the conditions, open your first position at Step 1 . If price moves against you and reaches the Step 2 level, open a new position there, and continue opening additional positions at each subsequent step level.
Whenever price reverses from any of these levels and moves in the direction of your analysis, all open positions will move into profit .
In Xmoon, the number of entry steps is fully configurable ( 2 to 10 ). Set it according to your strategy—the system automatically calculates the size of each step based on the capital you allocate.
6️⃣ Exit Management
Depending on market conditions, you can choose one of the following:
• ⚖️ Exit at the risk-free level: when the market is uncertain and you prefer to close at break-even.
• 🎯 Exit at the target level: when price has followed your analysis and you want to realize profit.
⚠️ Liquidity Level
• Spot: analysis invalidation point.
• Futures: the price at which a leveraged position’s equity would be wiped out.
Why the Invite-Only Version of Xmoon Is Worth Getting
• Proprietary 3 Push Divergence detection and confirmation that isn’t available in the free version or generic indicators.
• Automatic, precise capital and step sizing, with visual plotting of key levels from the moment a signal is issued.
• Real-time market context and pattern quality shown in the Information Box—no need to switch timeframes or add extra indicators.
• Risk control and psychological support by outlining predefined scenarios from start to finish of the trade.
• Limited access to help prevent misuse and reduce users’ financial risk, with dedicated training before activation.
• Developed through extensive backtesting and live evaluation; outcomes depend on correct use and market conditions.
We sincerely hope you have successful and profitable trades.
📣 If you have any questions or need further guidance, we’ll be happy to hear from you.
It’s our pleasure to assist you anytime.
🔻🔻🔻 Persian Section – بخش فارسی 🔻🔻🔻
اندیکاتور ایکسمون چه کاری انجام میدهد و چرا خاص است
اندیکاتور ایکسمون یک ابزار تحلیلی پیشرفته و منحصربهفرد است که حاصل سالها تجربه ترید، تحقیق و توسعه است. این اندیکاتور صرفاً ترکیب چند اندیکاتور ساده نیست، بلکه یک سیستم جامع و هوشمند است که سه رکن اصلی موفقیت در معاملات یعنی استراتژی، مدیریت سرمایه و روانشناسی معاملهگری را در یک ابزار یکپارچه گردآورده است
در بخش استراتژی
* الگوریتم اصلی ایکسمون بر اساس الگوی سهپوش واگرایی (تری پوش دایورجنس) در آر-اِس-آی طراحی شده است؛ الگویی که در سایر اندیکاتور ها ارائه نشده است، بیشتر ابزارهای موجود تنها واگرایی بین دو قله یا دو کف را تشخیص میدهند، در حالی که ایکسمون توانایی شناسایی سه قله یا سه کف متوالی با تضاد مومنتوم را دارد که این موضوع از نظر آماری احتمال بازگشت روند را بهمراتب افزایش میدهد
در بخش مدیریت سرمایه
* محاسبه خودکار حجم هر پله، بر اساس سرمایه پله ای، لوریج و قیمتهای ورود/خروج بهصورت دقیق و وزنی انجام میشود
* این محاسبات پیچیده برای چندین پله به شکل لحظهای انجام شده و در باکس اطلاعات به سادهترین شکل نمایش داده میشود
* خط لیکوییدیتی (حد ریسک) برای هر الگو محاسبه و روی نمودار بصورت بصری رسم میشود تا کاربر در یک نگاه بداند سرمایهاش کجا صفر میشود (در فیوچرز) یا تحلیلش کجا باطل میشود (در اسپات)
در بخش روانشناسی و تصمیمگیری
* ایکسمون از همان لحظه صدور سیگنال، تمام خطوط کلیدی (ورودی پلهای، ریسکفری، تارگت، لیکوییدیتی) را رسم میکند تا معاملهگر از ابتدا بداند
* اگر بازار طبق تحلیل پیش برود، خروج سودآور کجاست
* اگر بازار بر خلاف تحلیل پیش برود، نقطه خروج بیضرر (ریسکفری) کجاست
* این رویکرد باعث کاهش شدید استرس و تصمیمگیری احساسی میشود، چون سناریوهای خوشبینانه و بدبینانه از پیش مشخص هستند
⚙️ منطق و روش کار اندیکاتور ایکسمون
1️⃣ شناسایی و طبقهبندی پیوتها
اندیکاتور ایکسمون ابتدا پیوتهای قیمتی را روی نمودار شناسایی کرده و بر اساس فاصلهی کندلی بین سقف یا کف ها، آنها را در چهار دسته طبقهبندی میکند : سوپر مینور، مینور، میدماژور و ماژور
هرچه فاصله بین پیوت ها بیشتر باشد، پیوت بزرگتر و معتبرتر است، اما سیگنالها کمتر تولید میشوند
2️⃣ تشخیص الگوی سهپوش واگرایی
اندیکاتور ایکسمون در این مرحله الگوهای سهپوش واگرایی را شناسایی میکند، این الگو زمانی شکل میگیرد که قیمت سه پیوت متوالی همجهت تشکیل دهد، یعنی
* حالت صعودی : سه سقف پیاپی بالاتر از قبلی
* حالت نزولی : سه کف پیاپی پایینتر از قبلی
و همزمان، در نقاط متناظر در آر-اِس-آی حرکت معکوس دیده شود، به این معنا که
* حالت صعودی، قلههای آر-اِس-آی هر بار پایینتر از قبلی قرار گیرند - کاهش قدرت خرید
* حالت نزولی، درههای آر-اِس-آی هر بار بالاتر از قبلی شکل گیرند - کاهش فشار فروش
این تضاد قیمت و مومنتوم، وقتی سه بار پیاپی رخ دهد، احتمال بازگشت روند را بهشدت افزایش میدهد
3️⃣ ترسیم الگو و نمایش سطوح کلیدی
پس از شناسایی الگو، ایکسمون خطوط واگرایی و همچنین خطوط و سطوح زیر را روی نمودار ترسیم میکند، این موارد شامل
* 📍 خطوط ورود پلهای بر اساس تعداد پله و سرمایه تنظیمشده توسط کاربر
* ⚖️ خطوط ریسکفری برای خروج بدون سود و زیان
* 🎯 خطوط تارگت به عنوان سطوح حداقل سود
* 🛡 سطح لیکوییدیتی (حد ریسک) برای مشخصکردن نقطه صفر شدن سرمایه در معاملات فیوچرز
این ترسیمات باعث میشود معاملهگر در یک نگاه تصویر کامل از الگو، سطوح ورود و خروج و محدوده ریسک داشته باشد
4️⃣ باکس اطلاعات
پس از شناسایی الگو، اندیکاتور ایکسمون یک باکس اطلاعات تکمیلی در کنار هر الگو نمایش میدهد، البته با فعالسازی گزینه مربوطه در تنظیمات، باکس اطلاعات در کنار الگو نمایش داده میشود و شامل موارد زیر میباشد
* 🏷 نوع پیوت : سوپر مینور، مینور، میدماژور یا ماژور
* 📋 فیلترهای تأییدی
یک - جهت روند در تایمفریم بالاتر بر اساس میانگین متحرک دویست
دو - وضعیت اشباع خرید/فروش در تایمفریم بالاتر بر اساس اندیکاتور آر-اِس-آی
* 📊 حجم پیشنهادی ورود : بر اساس سرمایه واقعی و لوریج
این باکس به معاملهگر کمک میکند در یک نگاه کیفیت الگو، شرایط کلی بازار و حجم پیشنهادی ورود را بداند
توضیح درباره فیلترهای تأییدی : استفاده از این فیلترها میتواند دقت سیگنالها را افزایش دهد. این اطلاعات در اندیکاتور ایکسمون موجود است و نیازی نیست اندیکاتور یا ابزار اضافه دیگری به چارت اضافه کنید. ایکسمون مقایسه ها را در لحظه انجام میدهد و نتیجه فیلترها را در باکس اطلاعات به شما نشان میدهد
* فیلتر جهت روند در تایمفریم بالاتر : اگر روند بالاتر بر اساس اِم-اِی-دویست صعودی باشد، سیگنالهای خرید/لانگ قویتر هستند و بالعکس
* فیلتر تشخیص نواحی اشباع خرید/فروش در تایمفریم بالاتر : اگر آر-اِس-آی در محدوده اُورباوت باشد، احتمال موفقیت فروش بیشتر است و در محدوده اُورسولد احتمال موفقیت خرید بالاتر میرود
🧩 اجزای اندیکاتور ایکسمون چه هستند و چرا این اجزا با هم ترکیب شدهاند
* استراتژی اصلی : سیگنال بازگشت روند با الگوریتم اختصاصی سهپوش واگرایی
* تأیید چندمرحلهای جهت روند در تایم فریم بالاتر بر اساس اِم-اِی-دویست و تایید وضعیت بیشینه خرید/فروش در تایم فریم بالاتر در اندیکاتور آر-اِس-آی
* مدیریت سرمایه پیشرفته : محاسبه حجم پلهای و میانگین وزنی
* مدیریت خروج ساختاریافته : سطوح ریسکفری، تارگت، لیکوییدیتی
* پشتیبانی از تصمیمگیری سریع : همه اطلاعات حیاتی در یک نگاه
این ترکیب، ایکسمون را به یک سیستم کامل و کاربردی تبدیل کرده که در هیچ ابزار مشابهی در تریدینگویو به این شکل یکپارچه پیادهسازی نشده است و دقیقاً مجموع این ویژگیها در یک اندیکاتور است که ایکسمون را از ابزارهای مشابه متمایز میکند
📖 نحوه استفاده از اندیکاتور ایکسمون
1️⃣ افزودن اندیکاتور به چارت : اندیکاتور را به نمودار نماد دلخواه اضافه کنید
2️⃣ تنظیم پارامترها : از بخش تنظیمات، موارد زیر را بر اساس استراتژی شخصی خودتان مشخص کنید
* تعداد پلههای ورود: از دو تا ده پله
* نوع پیوت ها: سوپر مینور/مینور/مید-ماژور/ماژور
* نوع الگوها: نزولی/صعودی
* نمایش خطوط و باکس اطلاعات
* تعیین سرمایه در هر معامله
* تایمفریمهای فیلتر اِم-اِی-دویست و آر-اِس-آی
3️⃣ فعالسازی هشدارها : برای اطلاع فوری از شناسایی الگوهای سهپوش واگرایی ، آلارمها را فعال کنید
4️⃣ بررسی باکس اطلاعات : برای سنجش قدرت الگو و همجهتی با بازار، پس از صدور سیگنال، اطلاعات زیر را در باکس مشکی اطلاعات بررسی کنید
* 🏷 نوع پیوت : بررسی میزان قدرت الگو - سوپر مینور، مینور، میدماژور یا ماژور
* 📋 فیلترهای تأییدی
یک - بررسی هم جهتی الگوی شناسایی شده با جهت روند در تایمفریم بالاتر
دو - بررسی هم جهتی الگوی شناسایی شده با وضعیت اشباع خرید یا فروش در اندیکاتور آر-اِس-آی در تایمفریم بالاتر
این اطلاعات به شما کمک میکند تصمیم بگیرید که آیا وارد معامله شوید یا خیر
5️⃣ ورود پلهای
اگر پس از بررسی شرایط تصمیم به ورود گرفتید، اولین پوزیشن را در پله اول باز کنید و در صورتی که بازار در خلاف جهت موردنظر شما حرکت کرد و به سطح پله دوم رسید، یک پوزیشن جدید در همان سطح باز کنید و با رسیدن به سطوح بعدی، پوزیشن های بعدی را باز می کنید
هر زمان که بازار از هر یک از این سطوح برگشت و در جهت تحلیل شما حرکت کرد، تمامی پوزیشنهای باز شده وارد سود میشوند
در اندیکاتور ایکسمون، تعداد پلههای ورودی کاملاً قابلتنظیم است (بین دو تا ده پله ) و شما میتوانید بر اساس استراتژی شخصی خود آن را تعیین کنید، سیستم بهطور خودکار حجم هر پله را بر اساس سرمایه واردشده محاسبه میکند
6️⃣ مدیریت خروج
بسته به شرایط بازار، میتوانید یکی از دو روش زیر را انتخاب کنید
* ⚖️ خروج در سطح ریسکفری : زمانی که بازار نامطمئن است و میخواهید بدون سود یا زیان از معامله خارج شوید
* 🎯 خروج در سطح تارگت : زمانی که قیمت طبق تحلیل شما حرکت کرده است و بدنبال کسب سود هستید
⚠️سطح لیکوییدیتی
* اسپات: نقطه ابطال تحلیل
* فیوچرز: نقطه صفر شدن سرمایه پوزیشن با لوریج
💎 چرا نسخه اینوایت اونلی ایکسمون ارزش تهیه دارد
* الگوریتم اختصاصی شناسایی و تأیید سهپوش واگرایی که در نسخه رایگان یا اندیکاتورهای عمومی وجود ندارد
* محاسبات سرمایه و حجم پلهای بهصورت خودکار و دقیق، همراه با رسم بصری سطوح کلیدی از لحظه صدور سیگنال
* نمایش آنی شرایط بازار و کیفیت الگو در باکس اطلاعات بدون نیاز به تغییر تایمفریم یا افزودن اندیکاتورهای اضافی
* کنترل ریسک و پشتیبانی روانی معاملهگر با ارائه سناریوهای مشخص از ابتدا تا انتهای معامله
* دسترسی محدود برای جلوگیری از استفاده نادرست و کاهش ریسک مالی کاربران، همراه با آموزش اختصاصی پیش از فعالسازی
* اثباتشده در تستها و معاملات واقعی با نتایج قابل اتکا، به شرط استفاده صحیح بر اساس آموزش
صمیمانه امیدواریم معاملات موفق و پرسودی داشته باشید
📣 اگر سوالی دارید یا نیاز به راهنمایی بیشتری دارید، خوشحال میشویم از ما بپرسید
با کمال میل در خدمتتان هستیم

XAUMO MEGABAR Detector]XAUMO MegaBar Detector – Breakout Candle Identification Tool
Purpose:
The XAUMO MegaBar Detector is built to highlight rare, high-impact candles where strong price movement and high trading volume occur together. These moments often reflect aggressive market activity and can be used to confirm potential breakouts or reversals.
How It Works (High-Level Overview)
The tool continuously monitors two primary conditions:
Price Expansion – Identifies large-bodied candles compared to recent averages.
Volume Expansion – Confirms that the move is supported by above-average trading activity.
When both conditions are present, the candle is marked:
🟢 Mega Bull – Strong bullish pressure.
🔴 Mega Bear – Strong bearish pressure.
Key Features
Automatic Timeframe Adjustment – Detection sensitivity changes based on chart timeframe, so results stay relevant from 1-minute scalps to multi-day swing setups.
Clear Visual Output – Significant candles are highlighted directly on the chart for easy recognition.
Optional Labels – Toggle on/off text labels (“Mega Bull” / “Mega Bear”) for a cleaner chart view.
Alert Integration – Set TradingView alerts to be notified immediately when a qualifying candle appears.
Universal Compatibility – Works on Forex, Commodities, Indices, Crypto, Stocks, ETFs, and Futures.
Practical Uses for Traders
As a confirmation tool when price approaches support/resistance or Fibonacci levels.
To filter low-quality setups by focusing only on moments where both price and volume confirm the move.
As part of a trend-following or breakout strategy when combined with other analysis methods.
Using the Indicator
Add the indicator to any chart and select your preferred timeframe.
Watch for highlighted candles – they indicate significant combined momentum and liquidity.
Use as a signal filter or confirmation alongside your existing trading system.
Optional: Set alerts to receive push/email/webhook notifications.
===================================
📌 MEGA BAR TRADING CHEAT SHEET
Spot Big Money. Ride the Move.
===================================
🧠 WHAT’S A MEGA BAR?
A Mega Bar is a candle so big it makes the rest look tiny — and it often means institutions are making a move.
Check the 4 Rules:
✅ Body size ≥ 2x average
✅ High relative volume (vs. last 20 bars)
✅ Closes near high (bull) or low (bear)
✅ Comes after sideways chop or price squeeze
📈 WHY IT MATTERS
Mega Bars = intent, not random spikes.
🟢 Mega Bull near support/Fib pullback → Likely accumulation
🔴 Mega Bear near resistance/Fib extension → Likely distribution or trap
🔧 HOW TO TRADE IT
1. WAIT FOR IT
No Mega Bar → No trade.
Mega Bull (big green) → BUY bias.
Mega Bear (big red) → SELL bias.
2. FIND THE SPOT
Fib levels: 61.8% / 78.6% / 138.2%
Major Support/Resistance
3. CONFIRM ON BIGGER TIMEFRAME
Example: 15M Mega Bar → Check 1H trend direction.
4. SET YOUR LEVELS
Stop-Loss:
Long → Below Mega Bull low (+0.2×ATR)
Short → Above Mega Bear high (+0.2×ATR)
Take-Profit:
Fib extensions: 127.2% / 161.8% / 261.8%
Prior highs/lows
5. RISK SMART
Risk 1–2% max per trade
Aim for 2:1+ R:R
🌍 WORKS ON:
Forex • Commodities • Stocks • Crypto • Indices
THE RETAILER’S FORMULA:
🟢 Big Green → Buy
🔴 Big Red → Sell
🎯 Fibs = Payday
One setup. One signal. Discipline = profit.

SAFE Leverage Pro x50Safe Leverage Pro x50 — Safe leverage based on timeframes
Description:
Safe Leverage Pro x50 is an indicator designed to help traders choose prudent and realistic leverage, tailored to the timeframe being traded and the asset chosen.
Based on rigorous statistical research, this indicator provides a visual recommendation of the maximum typical leverage by timeframe and automatically suggests a more conservative value (by default, half) for trading with greater peace of mind and risk control.
* The goal is not for the indicator to make decisions for you, but rather to support your pre-defined entry strategies, allowing you to clearly understand how much leverage you can use without compromising your account against normal price fluctuations.
*The indicator does not calculate based on real-time volatility or ATR, but rather relies on statistical historical patterns obtained by analyzing price behavior after entry, differentiating between average movements in long and short entries by timeframe.
Important: Before following the recommendations of this indicator, check the maximum leverage your broker or exchange allows for the asset you are trading, as it can vary significantly between platforms.
* Philosophy behind the indicator:
This project arises as a response to the simplistic discourse that condemns leverage without distinguishing nuances.
Leverage is not intrinsically bad. What is dangerous is leveraging without method, without awareness, and without risk management.
Safe Leverage Pro x50 is designed to change that narrative:
** It's not about whether or not to use leverage, but when, how much, and how to use it intelligently.

Liquidity mark-out indicator(by Lumiere)This indicator marks out every High that has a bullish candle followed by a bearish one, vice versa for lows.
Once the price reaches the marked-out liquidity, the line is removed automatically.
This indicator only shows the current liquidity of the time frame you are at.
(To get it look like the picture just chance the length to 30-50)
Key Features of the Liquidity Mark-Out Indicator:
🔹 Identifies Liquidity Zones – Marks highs and lows based on candlestick patterns.
🔹 Customizable Settings – Toggle highs/lows visibility 🎚️, adjust line colors 🎨, and set line length (bars) 📏.
🔹 Smart Clean-Up – Automatically removes swept levels (when price breaks through) for a clean chart 🧹.
🔹 Pattern-Based Detection –
Highs: Detects two-candle reversal patterns (🟢 bullish close → 🔴 bearish close).
Lows: Detects two-candle reversal patterns (🔴 bearish close → 🟢 bullish close).
🔹 Dynamic Lines – Projects liquidity levels forward (adjustable length) to track key zones 📈.
Perfect For Traders Looking To:
✅ Spot potential liquidity grabs 🎯
✅ Identify key support/resistance levels 🛑
✅ Clean up their chart from outdated levels 🖥️

AL Brooks - Price Action Multi-Signal Suite📘 Price Action Multi-Signal Suite📘
This indicator is a complete visual toolset for traders who use price action principles inspired by Al Brooks-style analysis.
It combines multiple nuanced signals — like first/second entries, breakout failures, trend bias, higher-timeframe context, and dynamic trend channels — into one elegant, customizable interface.
It is built with clarity, flexibility, and actionable precision in mind.
🧠 Core Concepts Behind the Tool
1. Trend Bias with EMA (20 by default)
The indicator calculates a standard EMA (default: 20) to establish trend direction bias.
When price is above EMA, we consider the market to be in a bull trend, and vice versa.
The EMA line changes color dynamically — green (bull), red (bear), gray (neutral).
🟢 Example:
If price is forming higher highs and staying above EMA with strong bull bars, the bias is bullish. In this phase, you're looking for High 1 and High 2 (H1/H2) setups.
2. First and Second Entries (H1/H2 and L1/L2)
High 1 (H1): First pullback in a bull trend after a minor new high.
High 2 (H2): A second attempt to push up after a failed H1.
Low 1 (L1) and Low 2 (L2): Mirror the above logic for bear trends.
📈 Example Trade – H2 Long:
Price breaks out above EMA.
Pulls back and forms an H1, but it fails to break out.
Second push (H2) forms a higher low, then closes strong above previous bar → BUY entry.
📉 Example Trade – L2 Short:
Market is below EMA.
A rally creates L1, fails.
L2 forms and closes below the previous bar low with a bear body → SELL entry.
3. Second Entry Logic (Simplified Swing Count)
This adds context to H2/L2 by ensuring at least two swings occurred in the same direction.
Reduces false signals in choppy markets.
Painted as colored circles (aqua = long, fuchsia = short).
4. Breakout Failure Detection
Detects false breakouts using 10-bar highs/lows:
Failed High Breakout: Price breaks a 10-bar high but closes back inside → potential reversal short.
Failed Low Breakout: Price breaks a 10-bar low but closes back inside → potential long.
🚨 Example:
Price breaks above a recent high but closes below it with a strong bear bar → look for reversal or fade setups.
5. Inside / Outside Bars
Helps recognize compression (inside bars) or volatility expansions (outside bars).
Inside bars often precede breakouts.
Outside bars may signal traps or indecision.
Use these in combination with entry logic. An H2 after an inside bar can signal a strong, clean breakout.
6. Higher Timeframe (HTF) Context
Pulls EMA and trend bias from a higher timeframe (default: 1hr).
Background color indicates HTF bias (adjustable opacity).
Green = HTF uptrend.
Red = HTF downtrend.
🧭 Usage: Trade in the direction of the HTF bias when possible. An H2 with HTF bias bullish adds confluence.
7. Trend Channels (Automatic, Visual)
Dynamically draws trend channel lines based on pivot highs/lows.
These act as support/resistance, visual guides for traps or continuation.
Trendline breakouts or touches often align with H2/L2 setups.
📏 Example:
Price touches lower channel and forms a second entry long (L2) with a strong bull bar → high-quality reversal trade.
⚙️ Customization Options
Toggle each signal component (entries, bias, bars, failures, channels).
Adjust EMA length, HTF resolution, background opacity.
Keep your chart clean and focused on the signals that matter to you.
📊 Trade Example Summary
H2 with HTF Bullish
Trade Setup: Strong bull bar after a failed H1, above EMA
Expected Move: Trend continuation upward
L2 with Channel Hit
Trade Setup: Pullback hits lower trend channel, forms L2
Expected Move: Reversal or scalp down
Failed High Breakout
Trade Setup: Price breaks above a 10-bar high, but reverses and closes inside
Expected Move: Quick fade or reversal short
Inside Bar + H2
Trade Setup: Price compresses into an inside bar, followed by a breakout with H2
Expected Move: Momentum breakout trade
Outside Bar + L2
Trade Setup: Price breaks strongly in one direction (outside bar), second push fails upward, forms L2
Expected Move: Short on weakness
Please note, this is an educational idea and representation of whatever I understood of it.
Historical performances may not be replicable in present/future.
Trade at your own responsibility.
Regards! ^^

Fibonacci Counter-Trend TradingOverview:
The Fibonacci Counter-Trend Trading strategy is designed to capitalize on price reversals by utilizing Fibonacci levels calculated from the standard deviation of price movements. This strategy opens a sell order when the closing price crosses above a specified upper Fibonacci level and a buy order when the closing price crosses below a specified lower Fibonacci level. By leveraging the principles of Fibonacci retracement and volatility, this strategy aims to identify potential reversal points in the market.
How It Works:
Fibonacci Levels Calculation:
The strategy calculates upper and lower Fibonacci levels based on the standard deviation of the price over a specified moving average length. These levels are derived from the Fibonacci sequence, which is widely used in technical analysis to identify potential support and resistance levels.
The upper levels are calculated by adding specific Fibonacci ratios (0.236, 0.382, 0.5, 0.618, 0.764, and 1.0) multiplied by the standard deviation to the basis (the volume-weighted moving average).
The lower levels are calculated by subtracting the same Fibonacci ratios multiplied by the standard deviation from the basis.
Trade Entry Rules:
Sell Order: A sell order is triggered when the closing price crosses above the selected upper Fibonacci level. This indicates a potential reversal point where the price may start to decline.
Buy Order: A buy order is initiated when the closing price crosses below the selected lower Fibonacci level. This suggests a potential reversal point where the price may begin to rise.
Trade Management:
The strategy includes stop-losses based on the Fibonacci levels to protect against adverse price movements.
How to Use:
Users can customize the moving average length and the multiplier for the standard deviation to suit their trading preferences and market conditions.
The strategy can be applied to various financial instruments, including stocks, forex, and cryptocurrencies, making it versatile for different trading environments.
Pros:
The Fibonacci Counter-Trend Trading strategy combines the mathematical principles of the Fibonacci sequence with the statistical measure of standard deviation, providing a unique approach to identifying potential market reversals.
This strategy is particularly useful in volatile markets where price swings can lead to significant trading opportunities.
The use of Fibonacci levels can help traders identify key support and resistance areas, enhancing decision-making.
Cons:
The strategy may generate false signals in choppy or sideways markets, leading to potential losses if the price does not reverse as anticipated.
Relying solely on Fibonacci levels without considering other technical indicators or market conditions may result in missed opportunities or increased risk.
The effectiveness of the strategy can vary depending on the chosen parameters (e.g., moving average length and standard deviation multiplier), requiring users to spend time optimizing these settings for different market conditions.
As with any counter-trend strategy, there is a risk of significant drawdowns during strong trending markets, where the price continues to move in one direction without reversing.
By understanding the mechanics of the Fibonacci Counter-Trend Trading strategy, along with its pros and cons, traders can effectively implement it in their trading routines and potentially enhance their trading performance.
Multiple MAsHere's a well-written description in English for your "Multiple MAs" indicator that you can use when publishing on TradingView. It’s concise, professional, and highlights the key features of the indicator while explaining its purpose for traders.
---
### Multiple MAs Indicator
#### Overview
The **Multiple MAs** indicator is a versatile and straightforward tool designed to help traders visualize price trends using multiple Simple Moving Averages (SMAs) on a single chart. By plotting six SMAs with customizable lengths (MA5, MA10, MA20, MA50, MA100, and MA200), this indicator provides a clear view of short-term, medium-term, and long-term trends, making it ideal for trend-following strategies, crossover analysis, and identifying potential support/resistance levels.
#### Features
- **Customizable MA Lengths**: Adjust the periods of all six moving averages (MA5, MA10, MA20, MA50, MA100, MA200) to suit your trading style and timeframe.
- **Distinct Visuals**: Each MA is plotted with a unique color and line width for easy identification:
- MA5 (Dodger Blue, 1px)
- MA10 (Green, 1px)
- MA20 (Red, 2px)
- MA50 (Purple, 3px)
- MA100 (Gray, 3px)
- MA200 (White, 3px)
- **Overlay on Price Chart**: The indicator overlays directly on the price chart, allowing for seamless integration with other technical analysis tools.
- **High Precision**: Displays values with 8-decimal precision, ensuring accuracy for assets with small price movements (e.g., forex pairs or cryptocurrencies).
#### How to Use
1. **Trend Identification**: Use the longer MAs (e.g., MA100, MA200) to determine the overall trend direction. If the price is above these MAs, the trend is likely bullish; if below, it’s likely bearish.
2. **Crossover Signals**: Look for crossovers between shorter MAs (e.g., MA5 crossing MA20) for potential entry or exit signals. For example:
- A bullish signal occurs when a shorter MA crosses above a longer MA.
- A bearish signal occurs when a shorter MA crosses below a longer MA.
3. **Support and Resistance**: MAs often act as dynamic support or resistance levels. Watch for price reactions around these lines, especially the MA50, MA100, and MA200.
4. **Divergence Analysis**: Compare the slope of different MAs to identify potential trend reversals or weakening momentum.
#### Settings
- **MA5 Length**: Default is 5 bars.
- **MA10 Length**: Default is 10 bars.
- **MA20 Length**: Default is 20 bars.
- **MA50 Length**: Default is 50 bars.
- **MA100 Length**: Default is 100 bars.
- **MA200 Length**: Default is 200 bars.
#### Best Practices
- **Timeframe**: This indicator works on any timeframe but is particularly effective on daily, 4-hour, and 1-hour charts for swing trading or trend-following strategies.
- **Combine with Other Tools**: Pair the Multiple MAs with other indicators like RSI, MACD, or volume analysis to confirm signals and avoid false breakouts.
- **Adjust for Volatility**: For highly volatile assets, consider increasing the MA lengths to reduce noise and focus on broader trends.
#### Notes
- The indicator is lightweight and optimized for performance, ensuring it runs smoothly even on lower timeframes.
- Colors and line widths are pre-set for clarity but can be customized in the indicator settings if needed.
#### Credits
Created by kosar_v. Feedback and suggestions are welcome to improve this tool for the TradingView community!

Destroyer LifeDestroyer Life Strategy - High-Frequency Long & Short Trading
Overview:
The Destroyer Life strategy is an advanced cryptocurrency trading algorithm designed for high-frequency execution on the 15-second timeframe. It combines CRT (Candle Range Trend) and Turtle Soup trading logic with multi-timeframe analysis to optimize entries and exits for both long and short trades. This strategy is specifically optimized for high-volatility crypto pairs, such as SOL/USD on MEXC, ensuring precise execution with minimal drawdown.
Key Features:
15-Second Timeframe Execution: Optimized for ultra-short-term trading.
Long & Short Strategy: Simultaneously identifies profitable buy and sell opportunities.
CRT & Turtle Soup Logic: Leverages price action patterns for enhanced trade accuracy.
Higher Timeframe Analysis (HTF): Incorporates liquidity zones, fair value gaps (FVG), and breaker blocks for context-aware trading.
Dynamic Position Sizing: Uses an adjustable leverage multiplier for risk-controlled trade sizing.
Commission Optimization: Ensures profitability even with trading fees.
Strict Risk Management: Implements exit conditions based on liquidity structure and trend reversals.
Strategy Performance (Backtested on SOL/USD - MEXC):
Overall Profitability: ~80% win rate in backtesting.
Net Profit: $3,151.12 (6.30% ROI).
Gross Profit: $3,795.68 (7.59%).
Gross Loss: $644.56 (1.29%).
Long Trades Profit: $1,459.05 (2.92%).
Short Trades Profit: $1,692.07 (3.38%).
Commission Paid: $924.82.
Minimum Trade Holding Period: 1-minute cooldown between trades.
Trading Logic:
Entry Conditions:
Long Trades: Triggered when the price enters a liquidity void and aligns with higher timeframe bullish bias.
Short Trades: Triggered when price approaches a resistance level with bearish higher timeframe confluence.
CRT & Turtle Soup Patterns: Identifies reversals by analyzing breakout and fake-out structures.
Exit Conditions:
Long Positions Close: Upon price exceeding a 3.88% profit threshold or reversing below an HTF structure.
Short Positions Close: Upon reaching a similar 3.88% threshold or showing strong bullish signals.
Dynamic Position Sizing:
Uses a leverage-based calculation that adapts trade size based on volatility.
Liquidity Awareness:
Tracks Mitigation Blocks (MB), Fair Value Gaps (FVG), Buy/Sell-Side Liquidity (BSL/SSL) to determine optimal execution.
Best Use Cases:
Scalpers & High-Frequency Traders: Those looking for rapid trade execution with short holding periods.
Crypto Traders Focused on Low Timeframes: Optimized for 15-second price action.
Traders Utilizing Liquidity Concepts: Built to exploit liquidity traps and inefficiencies.
Risks & Considerations:
High-Frequency Execution Requires Low Latency: Ensure your broker or exchange supports fast order execution.
Backtested Results May Vary: Real-time performance depends on market conditions.
Commission & Fees Impact Profits: Consider exchanges with low fees to maximize strategy efficiency.
Final Thoughts:
The Destroyer Life Strategy is designed for serious traders looking to take advantage of high-volatility markets with a structured, liquidity-based approach. By combining price action, liquidity concepts, and adaptive risk management, it provides a solid framework for executing high-probability trades on crypto markets.
🚀 Ready to take your trading to the next level? Try Destroyer Life today and dominate the markets!

Iron Bot Statistical Trend Filter📌 Iron Bot Statistical Trend Filter
📌 Overview
Iron Bot Statistical Trend Filter is an advanced trend filtering strategy that combines statistical methods with technical analysis.
By leveraging Z-score and Fibonacci levels, this strategy quantitatively analyzes market trends to provide high-precision entry signals.
Additionally, it includes an optional EMA filter to enhance trend reliability.
Risk management is reinforced with Stop Loss (SL) and four Take Profit (TP) levels, ensuring a balanced approach to risk and reward.
📌 Key Features
🔹 1. Statistical Trend Filtering with Z-Score
This strategy calculates the Z-score to measure how much the price deviates from its historical mean.
Positive Z-score: Indicates a statistically high price, suggesting a strong uptrend.
Negative Z-score: Indicates a statistically low price, signaling a potential downtrend.
Z-score near zero: Suggests a ranging market with no strong trend.
By using the Z-score as a filter, market noise is reduced, leading to more reliable entry signals.
🔹 2. Fibonacci Levels for Trend Reversal Detection
The strategy integrates Fibonacci retracement levels to identify potential reversal points in the market.
High Trend Level (Fibo 23.6%): When the price surpasses this level, an uptrend is likely.
Low Trend Level (Fibo 78.6%): When the price falls below this level, a downtrend is expected.
Trend Line (Fibo 50%): Acts as a midpoint, helping to assess market balance.
This allows traders to visually confirm trend strength and turning points, improving entry accuracy.
🔹 3. EMA Filter for Trend Confirmation (Optional)
The strategy includes an optional 200 EMA (Exponential Moving Average) filter for trend validation.
Price above 200 EMA: Indicates a bullish trend (long entries preferred).
Price below 200 EMA: Indicates a bearish trend (short entries preferred).
Enabling this filter reduces false signals and improves trend-following accuracy.
🔹 4. Multi-Level Take Profit (TP) and Stop Loss (SL) Management
To ensure effective risk management, the strategy includes four Take Profit levels and a Stop Loss:
Stop Loss (SL): Automatically closes trades when the price moves against the position by a certain percentage.
TP1 (+0.75%): First profit-taking level.
TP2 (+1.1%): A higher probability profit target.
TP3 (+1.5%): Aiming for a stronger trend move.
TP4 (+2.0%): Maximum profit target.
This system secures profits at different stages and optimizes risk-reward balance.
🔹 5. Automated Long & Short Trading Logic
The strategy is built using Pine Script®’s strategy.entry() and strategy.exit(), allowing fully automated trading.
Long Entry:
Price is above the trend line & high trend level.
Z-score is positive (indicating an uptrend).
(Optional) Price is also above the EMA for stronger confirmation.
Short Entry:
Price is below the trend line & low trend level.
Z-score is negative (indicating a downtrend).
(Optional) Price is also below the EMA for stronger confirmation.
This logic helps filter out unnecessary trades and focus only on high-probability entries.
📌 Trading Parameters
This strategy is designed for flexible capital management and risk control.
💰 Account Size: $5000
📉 Commissions and Slippage: Assumes 94 pips commission per trade and 1 pip slippage.
⚖️ Risk per Trade: Adjustable, with a default setting of 1% of equity.
These parameters help preserve capital while optimizing the risk-reward balance.
📌 Visual Aids for Clarity
To enhance usability, the strategy includes clear visual elements for easy market analysis.
✅ Trend Line (Blue): Indicates market midpoint and helps with entry decisions.
✅ Fibonacci Levels (Yellow): Highlights high and low trend levels.
✅ EMA Line (Green, Optional): Confirms long-term trend direction.
✅ Entry Signals (Green for Long, Red for Short): Clearly marked buy and sell signals.
These features allow traders to quickly interpret market conditions, even without advanced technical analysis skills.
📌 Originality & Enhancements
This strategy is developed based on the IronXtreme and BigBeluga indicators,
combining a unique Z-score statistical method with Fibonacci trend analysis.
Compared to conventional trend-following strategies, it leverages statistical techniques
to provide higher-precision entry signals, reducing false trades and improving overall reliability.
📌 Summary
Iron Bot Statistical Trend Filter is a statistically-driven trend strategy that utilizes Z-score and Fibonacci levels.
High-precision trend analysis
Enhanced accuracy with an optional EMA filter
Optimized risk management with multiple TP & SL levels
Visually intuitive chart design
Fully customizable parameters & leverage support
This strategy reduces false signals and helps traders ride the trend with confidence.
Try it out and take your trading to the next level! 🚀

DCA Alpha 1.0 Trading Tool for Dollar-Cost Averaging
Description:
DCA Alpha 1.0 is a precision-engineered trading tool designed to assist traders and investors in accumulating assets during market downturns. Using proprietary algorithms that combine momentum decay, extreme price deviation metrics, trend dynamics, divergence analysis, and mean regression, it identifies potential bottom extreme zones in various asset classes such as indices, stocks, crypto, and commodities.
This indicator highlights market conditions where assets are oversold, undervalued, or experiencing capitulation—providing disciplined, unleveraged dollar-cost averaging (DCA) opportunities. Ideal for long-term growth strategies, DCA Alpha 1.0 helps cut through market noise, pinpointing moments of peak fear and maximum reward potential.
Whether navigating volatile crypto markets, timing corrections in indices, or accumulating commodities, DCA Alpha 1.0 serves as a vital tool for mastering the art of buying low and building your assets up strategically.
Instructions:
Getting Started:
Add the Indicator:
Install DCA Alpha 1.0 on your TradingView chart.
Select your preferred asset class: stocks, indices, crypto, or commodities.
Choose an appropriate timeframe (e.g., daily or weekly for long-term DCA strategies).
Customize Inputs: Adjust the following settings to align with your strategy:
Percentage of Equity to Trade: Define the portion of your portfolio to allocate per signal (default: 1% equity).
Profit Target Percentages: Set thresholds for locking in gains (default: 50% on lower timeframes, 500% on higher timeframes).
Zones and Signals:
Extreme Negative Zones:
What It Represents:
These zones highlight conditions where prices are deeply oversold, indicating extreme bearish sentiment. The market is likely nearing a bottom, offering high-probability buying opportunities.
Entry Signals:
When the price enters these extreme negative zones, visual markers (e.g., green triangles or other indicators) will signal a potential buying opportunity. These moments are indicative of market exhaustion, signaling that a reversal could be imminent.
Momentum Decay & Divergence:
Momentum decay occurs when price movement slows over time. In extreme negative zones, if prices continue to fall but at a diminishing rate (e.g., decreased volume or a fading oscillator), it suggests weakening bearish momentum. This, coupled with bullish divergence (oscillator forming higher lows while price makes lower lows), signifies a reversal, making it an ideal point to consider dollar-cost averaging into the asset.
Neutral Zones:
What It Represents:
The neutral zone is a state of market equilibrium, where prices are neither overbought nor oversold. The market is in a balanced state, with no strong trend emerging.
Mean Regression:
In a neutral zone, the market is reverting to its mean or average price after overreacting in either direction. A price transition from extreme zones (overbought/oversold) to the neutral zone suggests a reversion to the market's long-term average, making this a period of reduced volatility and uncertainty.
Entering or Exiting Neutral Zones:
Traders should avoid entering or exiting positions during neutral zone conditions unless transitioning from an extreme zone (negative or positive). Transitioning from an extreme negative zone to neutral may suggest an opportunity to accumulate assets gradually, while a shift from neutral to an extreme negative zone may indicate a deeper correction and warrant caution.
Momentum Decay & Divergence (Exiting Neutral Zone):
If prices are rising but the oscillator shows lower highs (bearish divergence), and momentum is fading, this could signal a pullback. A transition out of the neutral zone in this context may prompt traders to hold off on new positions or consider profit-taking.
Extreme Positive Zones:
What It Represents:
Markets can also become overbought or overvalued. When price enters extreme positive zones, the asset may be overvalued, suggesting potential selling or a waiting period.
Exit Signals:
Red triangle indicators signal potential exit points when prices reach overbought conditions, signaling a time to lock in profits and reduce exposure.
Momentum Decay & Divergence (Exiting Positive Zone):
When prices are making new highs but momentum is weakening (momentum decay) and the oscillator is showing lower highs (bearish divergence), this could indicate a faltering rally. Such conditions represent an ideal time to reduce exposure or exit positions.
Key Inputs for Customization:
Percentage of Equity to Trade:
This setting allows you to allocate a portion of your total portfolio per buy signal. By default, 1% of equity is used per signal, but this can be adjusted based on your risk tolerance and strategy.
Profit Target Percentages:
These thresholds help lock in gains once the price moves a set percentage in your favor.
Lower Timeframes: Default profit target of 50%.
Higher Timeframes: Default profit target of 500%.
These settings can be customized for specific risk/reward preferences.
Warning!!! : Aggressive Mode
Aggressive Mode is an advanced feature designed for traders who want to increase the frequency of signals during periods of market volatility. This mode will trigger more frequent entries, even into slightly less extreme zones, capturing short-term reversals.
What Aggressive Mode Does:
It amplifies signals by allowing the tool to identify more frequent price reversals, including brief market corrections, increasing trade frequency. While this can offer more trading opportunities, it also exposes you to higher risk.
Warning:
Aggressive Mode should be used only by experienced traders familiar with short-term volatility. The increased frequency of signals could lead to higher risk exposure. Ensure robust risk management practices, such as stop-loss orders and profit-taking strategies, are in place before activating this mode.
Default Setting:
Aggressive Mode is disabled by default. It can be activated at your discretion based on your experience level and risk appetite.
Best Practices:
Focus on High-Quality Assets: Prioritize assets with strong recovery potential (e.g., major indices, blue-chip cryptocurrencies).
Use Longer Timeframes: Minimize market noise and optimize your DCA strategy by focusing on higher timeframes (e.g., daily or weekly charts).
Review Trading Inputs: Regularly adjust your inputs to ensure they align with your financial goals and risk tolerance.
Implement Risk Management: Use stop-loss orders and profit targets to manage risk, especially when using Aggressive Mode.
Disclaimer:
DCA Alpha 1.0 is designed specifically for unleveraged, long-term dollar-cost averaging strategies. It is not intended for day trading or leveraged positions. The tool excels at identifying market dips but cannot guarantee success. Users are fully responsible for their own risk management, including the use of stop-losses, profit targets, and position sizing.
Aggressive Mode increases trade frequency and may lead to higher exposure and potential losses. Only experienced traders should consider using this mode. Always understand the risks involved before incorporating this tool into your trading strategy.

Customizable Days Range HighlighterThis Pine Script highlights ranges where consecutive green candles (bullish candles) form a price move within a specified percentage range.
It draws a visual box to represent this move, with the ability to customize both the percentage range and the number of consecutive green candles required to trigger the highlight.
The script calculates the range based on the low to close of the candles, allowing you to focus on the body of the candle (excluding wicks).
Key Features:
Customizable Percentage Range: Set a range (from and to) for the percentage price move between the lowest low and the close of the candle. This enables you to target specific price moves based on your trading strategy.
Consecutive Green Candle Range: Highlight moves only after a specific number of consecutive green candles. You can define the minimum and maximum number of green candles (days) that must be present for the range to be considered valid.
Wick Option: Choose whether to include wicks in the price move calculation or focus purely on the low to close of each green candle (body of the candle).
Visual Highlights: When a valid range is identified, the script draws a green box around the price move and labels it with the calculated percentage move. This helps you visually spot significant bullish price moves.
Parameters:
Percentage Move From: Minimum percentage move between the low and close of the candle for the range to be highlighted.
Percentage Move To: Maximum percentage move for the range to be considered valid.
Minimum and Maximum Green Candles: Set the minimum and maximum number of consecutive green candles (bullish candles) to trigger the range highlight.
Include Wicks: Choose whether to include the candle wicks in the percentage calculation or focus on the body (low to close).
How It Works:
The script tracks consecutive green candles and calculates the range from the low to close of each green candle.
When a valid range is found, where the price move falls within the defined percentage range and the consecutive green candles are within the specified days range, a box is drawn around the price move.
A label is also placed on the chart, showing the percentage move, to help you quickly identify potentially significant price movements.
This tool is ideal for traders who are looking for specific bullish moves over a series of green candles and want to visually identify those opportunities based on price movement and percentage change.