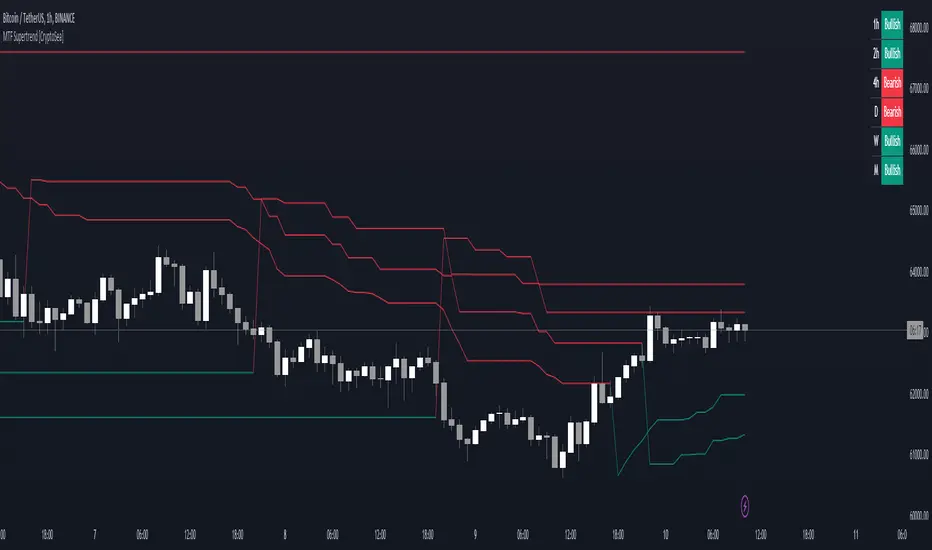
MTF Supertrend [CryptoSea]The MTF Supertrend Indicator is a versatile tool crafted to enhance trend analysis across multiple timeframes. Leveraging the reliable Supertrend formula, it provides traders with a comprehensive view of market trends and potential reversal points.
Key Features
Multi Timeframe Analysis: Tracks Supertrend signals over a variety of timeframes, offering a broad perspective on market direction.
Percentage Threshold Display: Filters out Supertrend data that is not within a specified percentage of the current price, keeping the display focused on relevant trends.
Adaptive Visual Display: Features a dynamic table that shows the current Supertrend status, which is fully customizable to the user's display preferences.
Customizable Sensitivity: Users can fine-tune the factor and ATR period settings, allowing for personalized trend sensitivity.
How it Works
Supertrend Calculation: Computes the Supertrend using the Average True Range (ATR) multiplied by a customizable factor, detecting changes in volatility and trend.
Higher Timeframe Filtering: Prioritizes higher timeframe trends over the current chart's timeframe to avoid chart clutter and focus on the most significant trends.
Colour-Coded Trends: Utilizes colour coding to clearly indicate bullish and bearish trends, aiding quick visual analysis.
Responsive Display Options: Includes a switchable table view to overlay trend information on the chart, with options for dark and light themes.
Benefits for Different Trading Styles
Day Traders: Use real-time updates to catch short-term trend reversals and ride the momentum for quick profits.
Swing Traders: Benefit from viewing medium to long-term trends to formulate strategies that span several days or weeks.
Position Traders: Utilize the monthly supertrend data to make long-term investment decisions based on prevailing market directions.
Application
Strategic Decision-Making: Assists traders in making informed decisions by providing a layered view of trend directions across timeframes.
Trend Confirmation: Reinforces trading strategies by confirming trends with higher timeframe Supertrend alignment.
Customized Analysis: Adapts to various trading styles with input settings that control the display and sensitivity of trend data.
The MTF Supertrend Indicator by is a powerful addition to the trader's toolkit, enhancing multi-timeframe trend analysis and contributing to a strategic trading approach in volatile markets.
Trend
HTF Candle Consistency [LuxAlgo]The HTF Candle Consistency indicator tracks the most recent candle sentiment in up to 10 Higher Timeframe (HTF) and colors the user chart candle bodies based on the dominating sentiment. Users can weigh specific timeframes more significantly.
Additionally, the script provides an HTF dashboard that displays the current directional readouts for each selected timeframe to allow for an independent HTF analysis.
🔶 USAGE
Analyzing the movement and direction of higher timeframe candles can help filter out noisy variation from the price, and could be utilized to time trades better. When the majority of recent candles from the selected timeframes are bullish, the candle body will be colored in green, if this majority is bearish it will be colored in red.
Using the "Tricolor" coloring mode introduces a third coloring option, and is used when there isn't a clear sentiment majority across the selected timeframes, this option effectively allows for filtering out unwanted trends.
Users can control the variations to be filtered out depending on their chart timeframe and the enabled HTF's in the settings. Using low timeframes with higher HTF's will gray out a larger amount of candles, disabling these timeframes, changing them, or giving higher weighting to lower HTF's will allow for obtaining more dominance detection, and as such less grayed-out candles.
As seen above, the weight function allows for precise control over the specific elements being analyzed.
This indicator also features a dashboard for viewing each timeframe's direction at the same time. By doing so, it allows for better judgment on the specific elements composing the current HTF majority.
🔶 DETAILS
This indicator is only intended for Higher Timeframe Analysis, all the input timeframes should be kept equal to or lower than your current chart timeframe.
NOTE: This is necessary for data accuracy in most multi-timeframe indicators, and is generally a good practice to keep in mind.
As a reminder, the dashboard will display the timeframe in red text if a lower timeframe is detected. It is recommended to change or disable this timeframe for your analysis.
This indicator can support up to 10 timeframes, each with independent weightings.
NOTE: When a timeframe is disabled, the dashboard will no longer display that timeframe, and it will not be used in calculations.
🔹 Candle Coloring
Candle color can be selected between 3 modes.
Tricolor (Default): Changes the color based on a 3-part split of the possible data sum range.
Bicolor: Changes the color based on the sum being greater than or less than 0.
Gradient: Uses a 3-color gradient to determine the candle color based on the possible data sum range.
🔶 SETTINGS
🔹 Higher Timeframes
Toggle: Enable/Disable the timeframe from analysis.
Timeframe: Select which timeframe to use for analysis. <- NOTE: This input reflects any custom intervals you have created on Tradingview.
Weight: Determines the Weighting (Multiplier) for the timeframe's direction.
🔹 Style
Color Mode: (More details above) Determines the color mode in use for coloring candles.
🔹 Dashboard
General Settings: Control Toggle, Location, & Size of Dashboard on your chart.
Orientation: Choose to display the dashboard in a "Vertical (default)" or "Horizontal" orientation to fit your style.

Volume Delta [hapharmonic]Volume Delta: Volume Delta is an indicator that simplifies how you analyze trading volumes and the percentage of buy-sell activities effortlessly.
As a trader or market analyst, understanding underlying volume and trade flows is critical. The Volume Delta indicator provides thorough insight into both the total volume and the percentage of buying versus selling within the current candlestick. This information is pivotal for those looking to gauge market momentum and sentiment more effectively.
Additionally, the Volume Delta indicator can plot the candlestick colors based on the percentage of the dominant buying or selling volume. The area between the open and close prices of the candlestick is considered 100% and fills with colors corresponding to the predominant volume at that percentage.
Volume Delta also integrates the concept of Net volume. This component is crucial as it reveals the real market sentiment by calculating the difference between the volume of trades executed at an uptick and those at a downtick.
🟠 Overview
This indicator now displays in two layouts. Recently, Tradingview introduced the "force_overlay=true" function in Pine Script , allowing plots to be moved to the main chart. Thus, all displays are from the same indicator.
🟠 USAGE
From the data displayed in 'plot.style_columns' , the peak area represents the entire volume, accounting for 100%. Within this area, there are two color levels indicating volume. If one type of volume, whether buying or selling, exceeds the other, the larger volume will be positioned behind and the smaller in front. This arrangement prevents the scenario where a higher buying volume obscures the smaller selling volume. Therefore, the two colors can be switched between the front and the back as needed.
As you can see, the 12 and 26-day Exponential Moving Averages (EMAs) are used, with the Volume Confirmation Length set at 6. Therefore, the crossing of the EMAs proceeds normally, but it is highlighted with three triangular arrows to indicate a high likelihood of a valid crossover. However, if the volume is insufficient, these markers won't be displayed, although the EMA crossover will still occur as usual. This can be useful for using volume to verify the significance of the EMA crossover.
🟠 Setting
If you enable the label, please be aware that the chart size will shrink, causing the candlestick display to become unclear. Therefore, you might need to select "Logarithmic" at the bottom right of your screen, or for mobile applications, press and hold on the price scale and choose "Logarithmic" to adjust the scale appropriately.
Enjoy!

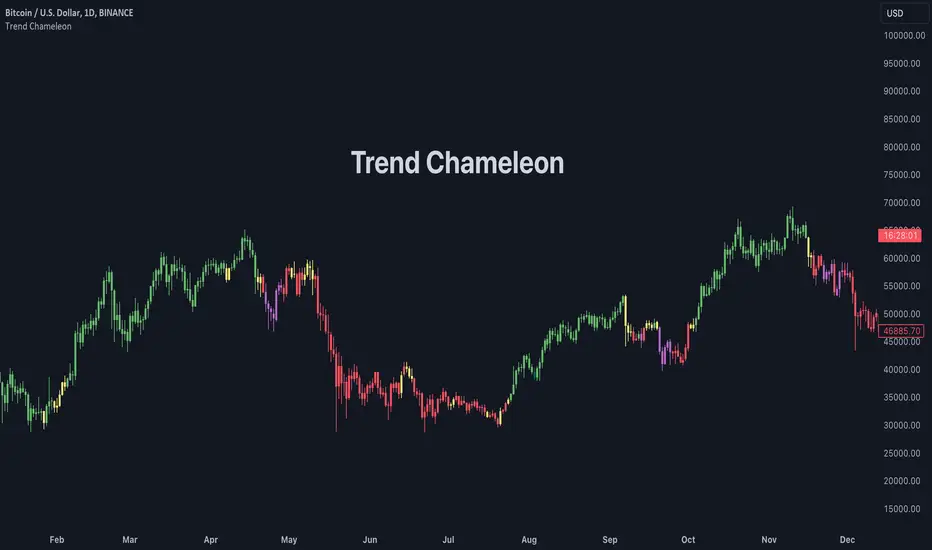
Trend ChameleonThe Trend Chameleon, originally developed by Alex Cole for the Bloomberg Terminal, is a powerful tool designed to simplify trend identification and illuminate potential trading opportunities. It leverages a clear visual display to decode market movements, making it useful for traders of all experience levels.
🟠 Overview
Here's an illustration of how the indicator performs for ES (S&P 500 E-mini Future) on the daily chart:
Trend Chameleon employs a color-coded candle scheme, with each color corresponding to a specific level of trend strength. Purple candles represent the strongest bearish trends, while teal candles signal the most potent bullish momentum. Between these extremes lie red, yellow, and green candles, providing a spectrum of trend direction. This intuitive color coding allows you to quickly grasp the prevailing market sentiment and identify potential entry and exit points for your trades.
🟠 Algorithm
Under the hood, Trend Chameleon evaluates four conditions to provide a directional strength score:
1. Whether the MACD value is positive.
2. Whether the SMA 50 of open prices is above the SMA 50 of the close prices.
3. Whether the ROC indicator value is positive.
4. Whether the current close price is above the SMA 50.
The total number of fulfilled conditions (0 to 4) determines the trend strength, with 0 indicating the most bearish and 4 signifying the strongest bullish trend. This score is then visually represented by coloring the bars on the chart.
🟠 Note
If you don't see the bars being properly colored after adding this indicator, please ensure Trend Chameleon is positioned on top of all other indicators in your chart. This can be easily achieved by hovering over the indicator's name, clicking the three dots, selecting "Visual Order," and then choosing "Bring to front."
Swing Failure Pattern (SFP) [LuxAlgo]The Swing Failure Pattern indicator highlights Swing Failure Patterns (SFP) on the user chart, a pattern occurring during liquidity generation from significant market participants.
A Confirmation level used to confirm a trend reversal is also included. Users can additionally filter out SFP based on a set Volume % Threshold .
🔶 USAGE
Swing failure patterns occur when candle wicks exceed (above/below) a recent swing level but close back below/above it, and occur from more significant market participants engineering liquidity. This pattern can be indicative of a potential trend reversal.
A label and an accentuated wick line highlight the SFP (both can be disabled).
Using a higher "Swings" period will not return different SFP but will however potentially reduce their detection rate.
🔹 Confirmation Level
The confirmation level is the highest point between the previous swing and SFP for a bullish SFP, and the lowest point for a bearish SFP. This level allows confirming a trend reversal after an SFP once the price breaks it.
A small triangle will be displayed when the price closes beyond the confirmation level.
A more reactive and contrarian approach could use the SFP as an entry point, and the confirmation level for taking (partial) profit, or stop loss. The example below shows a possible scenario:
🔹 Volume % Threshold
During the occurrence of an SFP, the Volume % Threshold option allows comparing the cumulative volume outside the Swing level to the total volume of the candle. The following options are included:
Volume outside swing < Threshold: Volume outside the Swing level needs to be lower than x % of total candle volume. Prevent excessive liquidity generation.
Volume outside swing > Threshold: Volume outside the Swing level needs to be higher than x % of total candle volume. Requires more significant liquidity to be generated.
None: No extra filter is applied
Note that in the above case, the left SFP is no longer highlighted because the volume above the swing level was higher than the 25% threshold of the total volume.
When we change the setting to "Volume outside swing > Threshold", we get the reversed situation.
The "Volume outside Swing level" is obtained using intrabar - Lower TimeFrame (LTF) data.
At the intrabar (LTF) level, there are a maximum of 100K bars available. When using the Volume % Threshold filter, a vertical line will highlight the maximum period during which intrabars are available.
🔶 DETAILS
🔹 LTF Settings
When 'Auto' is enabled (Settings, LTF), the LTF will be the nearest possible x times smaller TF than the current TF. When 'Premium' is disabled, the minimum TF will always be 1 minute to ensure TradingView plans lower than Premium don't get an error.
Examples with current Daily TF (when Premium is enabled):
500 : 3-minute LTF
1500 (default): 1-minute LTF
5000: 30 seconds LTF (1 minute if Premium is disabled)
The concerning LTF can be seen at the right-top (default) corner.
🔶 SETTINGS
Swings: Period used for the swing detection, with higher values returning longer-term Swing Levels.
Bullish SFP: enable/disable bullish Swing Failure Patterns.
Bearish SFP: enable/disable bearish Swing Failure Patterns.
🔹 Volume Validation
Validation:
Volume outside swing < Threshold: The volume outside the swing level needs to be lower than x % of the total volume.
Volume outside swing > Threshold: The volume outside the swing level needs to be higher than x % of the total volume.
None: No extra validation is applied.
Volume % Threshold: % of total volume as threshold.
Auto + multiple: Adjusts the initial set LTF
LTF: LTF setting
Premium: Enable when your TradingView plan is Premium or higher
🔹 Dashboard
Show Dashboard: Display applied Lower Timeframe (LTF)
Location: Location of the dashboard
Size: Size of the dashboard
🔹 Style
Swing Lines
Confirmation Lines
Swing Failure Wick
Swing Failure Label
Lines / Labels: Color for lines and labels
SFP Wicks: Color for SFP wick line

Bayesian Bias OscillatorWhat is a Bayes Estimator?
Bayesian estimation, or Bayesian inference, is a statistical method for estimating unknown parameters of a probability distribution based on observed data and prior knowledge about those parameters. At first , you will need a prior probability distribution, which is a prior belief about the distribution of the parameter that you are interested in estimating. This distribution represents your initial beliefs or knowledge about the parameter value before observing any data. Second , you need a likelihood function, which represents the probability of observing the data given different values of the parameter. This function quantifies how well different parameter values explain the observed data. Then , you will need a posterior probability distribution by combining the prior distribution and the likelihood function to obtain the posterior distribution of the parameter. The posterior distribution represents the updated belief about the parameter value after observing the data.
Bayesian Bias Oscillator
This tool calculates the Bayes bias of returns, which are directional probabilities that provide insight on the "trend" of the market or the directional bias of returns. It comes with two outputs: the default one, which is the Z-Score of the Bayes Bias, and the regular raw probability, which can be switched on in the settings of the indicator.
The Z-Score output value doesn't tell you the probability, but it does tell you how much of a standard deviation the value is from the mean. It uses both probabilities, the probability of a positive return and the probability of a negative return, which is just (1 - probability of a positive return).
The probability output value shows you the raw probability of a positive return vs. the probability of a negative return. The probability is the value of each line plotted (blue is the probability of a positive return, and purple is the probability of a negative return).
FVG Positioning Average [LuxAlgo]The FVG Positioning Average indicator aims to uncover potential price levels of interest by averaging together recent Fair Value Gap (FVG) initiation levels.
This indicator is grounded in the theory that significant buying or selling activity is the primary catalyst for creating FVGs.
By averaging together the prices where each FVG initiated, we may potentially reveal where major participants are positioned.
🔶 USAGE
By analyzing the average price of bullish or bearish FVGs, users can identify potential support or resistance areas where the larger participants may re-enter or defend their positions.
These areas could be used to adjust entries and exits or assist with risk management such as take-profit or stop-loss levels.
The indicator displays 2 lines, the Bull Average and the Bear Average.
The Bull Average is only displayed when the price holds above the bull Average.
The Bear Average is only displayed when the price holds below the bear average.
When only one average is displayed alone, this level is seen as support or resistance, it is anticipated that this level would be defended for the current trend to stay valid.
When both averages are displayed simultaneously, it can be interpreted as one side attempting to take over the trend.
The movements and reactions during these attempts can be analyzed to provide helpful information about where the price might be headed.
Possible outcomes:
Trend Confirmation/Re-Entry (From Weak Attempts)
Trend Reversal (Creating Support or Resistance)
Consolidation (Oscillating between/around Bull & Bear Averages)
🔶 DETAILS
🔹 Lookback Types
This indicator includes 2 lookback types:
Bar Count: Uses Bars to determine what data to include. This type can be utilized for averages that are more locally relevant to the current chart data.
FVG Count: Uses a specific # of FVGs for calculations. This type can be utilized for a continuous & consistent view, typically relevant with longer term analysis.
Note: When using bar lookback, if no data is in range, no lines will be displayed.
Below is an example of the 'FVG Count' Display.
🔹 Initiation Levels
Initiation Levels are the specific price points where each FVG starts, these are the last points the price was traded at before creating the gap.
Bull Initiation Level: Lowest Point (Bottom) of FVG
Bear Initiation Level: Highest Point (Top) of FVG
🔹 FVG Display
Each FVG being used for the current calculation of averages is displayed on the chart for reference.
Note: If you prefer to not display the FVGs, they can be toggled off in the settings, uncheck "Show FVGs on Chart".
🔶 Settings
FVG Lookback: As mentioned above in the 'Lookback Types', this sets the number of FVGs or Bars to use for consideration.
Lookback Type: As also mentioned above in 'Lookback Types', this determines the method of lookback to be used.
ATR Multiplier: The FVGs are required to have a Greater Width than (ATR * Multiplier) in order to be used for calculations. This allows you to focus on the data being considered if needed.

Trend Regression Kernel [IkkeOmar]Kernel by @jdehorty huge shoutout to him! This is only an idea for how I use it when trading
All credit for the kernel goes to him, I did not make the kernel! I don't know how to make it more clear.
I use this to assist with top-down analysis.
timeframe I want to trade : timeframe to analyse with white noise and kernel:
1m : 1H
5m : 2H
15m : 4H
1H : 1D
In the chart you see that I have the 1H open, I use the white noise at a "lower setting length" (55 in this case), I change the source of to be the kernel on the higher timeframe. When a new trend is detected by the White noise I wait for price to retest the kernel before building a position. Another case described below:
Here i use the adaptive MCVF (I have made this free for everyone on TradingView) to buy when price is below the kernel while the trend for the white noise is bullish .
Notice that the Kernel is set on the 4H timeframe! The source of the white noise is the kernel!
Here is an example in a bearish trend:
Notice, I am on the 5m chart, kernel uses the 2H chart and the source of the white noise is the kernel.
I use the adaptive MCVF to help me get entries AFTER the first touch of the kernel.
Mandatory code explanation, with respect to the house rules:
Input settings:
Input Settings:
The script provides various input parameters to customize the indicator:
src: The source of price data, defaulted to closing prices.
h, r, x_0: Parameters for Kernel 1.
h2, r2, x_2: Parameters for Kernel 2.
Kernel Regression Functions:
Two functions kernel_regression1 and kernel_regression2 are defined to perform kernel regression calculations.
These functions estimate the trend using the Nadaraya-Watson kernel non-parametric regression method.
They take the source data (_src), the size of the data series (_size), and the lookback window (_h) as inputs.
They iterate over the data series and calculate the weighted sum of the values based on the specified kernel parameters.
The result is divided by the cumulative weight to obtain the estimated value.
Estimations:
The kernel_regression1 and kernel_regression2 functions are called with the respective parameters to estimate trends (yhat1 and yhat2).
Buy and Sell Signals:
Buy and sell signals are generated based on crossover and crossunder conditions between the two trend estimates (yhat1 and yhat2).
buySignal is true when yhat1 crosses above yhat2.
SellSignal is true when yhat1 crosses below yhat2.
Plotting:
The average of the two trend estimates (yhat1 and yhat2) is calculated and plotted.
The color of the plot is determined based on whether yhat1 is greater than yhat2, less than yhat2, or equal to yhat2.
Buy and sell signals are plotted using triangle shapes below and above bars, respectively.
Alerts:
Alert conditions are set based on buy and sell signals. Alerts are triggered when a crossover (long signal) or crossunder (short signal) occurs.
The alerts include information about the signal type, symbol, and price.
It's important to mention that the buy and sell signals from the indicator is very discretionary, I rarely use them, and if I do it's if they are in confluence with a correction i am biased towards or if it has confluence with some of my other systems.
The adaptive MCVF and White noise is free for everyone on TradingView, linked below:)
Huge shoutout to @jdehorty, original kernel below:

Vortex [GOODY]The "Vortex " indicator introduces a novel approach to trend, enhancing the traditional Vortex Indicator (VI) by integrating a dynamic trend direction line, customizable trend exhaustion alerts, and improved visual clarity with additional features to aid in identifying not just the trend's direction but also its sustainability.
Key Features:
• Enhanced Trend Direction Line: Beyond the standard VI+ and VI- calculations, our indicator plots a trend direction line that averages these values, offering a clear visual cue of the market's overall direction. This line's color adapts based on the trend's strength and potential exhaustion, providing immediate insight into market sentiment.
• Customizable Trend Exhaustion Level: With the user-defined viExhaustionLevel, traders can set their thresholds for what they consider to be an overextended trend, adding a strategic layer to their analysis. This feature aims to signal when a trend might be reaching a point of reversal or slowdown, offering an opportunity for preemptive strategy adjustment.
• Trend Signal Alerts: Automated alert conditions for uptrend and downtrend signals facilitate timely decision-making. Traders can configure alerts to notify them of significant crossovers in VI+ and VI-, ensuring they don't miss critical market movements.
• User-friendly Interface: The option to toggle the trend direction line on or off caters to diverse analysis preferences, ensuring that the chart remains as streamlined or detailed as the user desires.
• Visual Enhancements: Background color coding and horizontal reference lines improve the indicator's usability, making it easier for traders to interpret the data at a glance.
Practical Applications:
• Trend Following: Ideal for traders who specialize in trend-following strategies, providing early signals of trend formation and potential exhaustion.
• Risk Management: By identifying potential trend reversals, traders can make informed decisions about entry and exit points, improving their risk management.
• Market Analysis: Offers a comprehensive overview of market dynamics, aiding in the analysis of various assets across timeframes.

Trend Analysis with Standard Deviation by zdmre This script analyzes trends in financial markets using standard deviation.
The script works by first calculating the standard deviation of a security's price over a specified period of time. The script then uses this standard deviation to identify potential trend reversals.
For example, if the standard deviation of a security's price is high, this could indicate that the security is overvalued and due for a correction. Conversely, if the standard deviation of a security's price is low, this could indicate that the security is undervalued and due for a rally.
The script can be used to analyze any security, including stocks, bonds, and currencies. It can also be used to analyze different time frames, such as daily, weekly, and monthly.
How to Use the Script
To use the script, you will need to specify the following parameters:
Time frame: The time frame you want to analyze.
Standard deviation: The standard deviation you want to use.
Once you have specified these parameters, the script will calculate the standard deviation of the security's price over the specified time frame. The script will then use this standard deviation to identify potential trend reversals.
#DYOR

Session LiquidityDescribes if markets are liquid enough for institutions to manipulate. Its often difficult to determine if markets will trend or chop, but by looking at how much volume we have at the open, we can determine of the session will be choppy or trendy, and take trades based on that.
Settings predefined for 1m timeframe on SPY. May work with other tickers, but I have not tested it out yet.
Designed for stocks(as of now, may update later)

Periodic Activity Tracker [LuxAlgo]The Periodic Activity Tracker tool periodically tracks the cumulative buy and sell volume in a user-defined period and draws the corresponding matching bars and volume delta for each period.
Users can select a predefined aggregation period from the following options: Hourly, Daily, Weekly, and Monthly.
🔶 USAGE
This tool provides a simple and clear way of analyzing volumes for each aggregated period and is made up of the following elements:
Buy and sell volumes by period as red and green lines with color gradient area
Delta (difference) between buy & sell volume for each period
Buy & sell volume bars for each period
Separator between lines and bars, and period tags below each pair of bars for ease of reading
On the chart above we can see all the elements displayed, the volume level on the lines perfectly matches the volume level on the bars for each period.
In this case, the tool has the default settings so the anchor period is set to Daily and we can see how the period tag (each day of the week) is displayed below each pair of bars.
Users can disable the delta display and adjust the bar size.
🔹 Reading The Tool
In trading, assessing the strength of the bulls (buyers) and bears (sellers) is key to understanding the current trading environment. Which side, if any, has the upper hand? To answer this question, some traders look at volume in relation to price.
This tool provides you with a view of buy volume versus sell volume, allowing you to compare both sides of the market.
As with any volume tool, the key is to understand when the forces of the two groups are balanced or unbalanced.
As we can observe on the chart:
NOV '23: Buy volume greater than sell volume, both moving up close together, flat delta. We can see that the price is in range.
DEC '23: Buy volume bigger than Sell volume, both moving up but with a bigger difference, bigger delta than last month but still flat. We can see the price in the range above last month's range.
JAN '24: Buy and sell volume tied together, no delta whatsoever. We can see the price in range but testing above and below last month's range.
FEB '24: Buy volume explodes higher and sell volume cannot keep up, big growing delta. Price explodes higher above last month's range.
Traders need to understand that there is always an equal number of buyers and sellers in a liquid market, the quality here is how aggressive or passive they are. Who is 'attacking' and who is 'defending', who is using market orders to move prices, and who is using limit orders waiting to be filled?
This tool gives you the following information:
Lines: if the top line is green, the buyers are attacking, if it is red, the sellers are attacking.
Delta: represents the difference in their strength, if it is above 0 the buyers are stronger, if it is below 0 the sellers are stronger.
Bars: help you to see the difference in strength between buyers and sellers for each period at a glance.
🔹 Anchor Period
By default, the tool is set to Hourly. However, users can select from a number of predefined time periods.
Depending on the user's selection, the bars are displayed as follows:
Hourly : hours of the current day
Daily : days of the current week
Weekly : weeks of the current month
Monthly : months of the current year
On the chart above we can see the four periods displayed, starting at the top left and moving clockwise we have hourly, daily, weekly, and monthly.
🔶 DETAILS
🔹 Chart TimeFrame
The chart timeframe has a direct impact on the visualization of the tool, and the user should select a chart timeframe that is compatible with the Anchor period in the tool's settings panel.
For the chart timeframe to be compatible it must be less than the Anchor period parameter. If the user selects an incompatible chart timeframe, a warning message will be displayed.
As a rule of thumb, the smaller the chart timeframe, the more data the tool will collect, returning indications for longer-term price variations.
These are the recommended chart timeframes for each period:
Hourly : 5m charts or lower
Daily : 1H charts or lower
Weekly : 4H charts or lower
Monthly : 1D charts or lower
🔹 Warnings
This chart shows both types of warnings the user may receive
At the top, we can see the warning that is given when the 'Bar Width' parameter exceeds the allowed value.
At the bottom is the incompatible chart timeframe warning, which prompts the user to select a smaller chart timeframe or a larger "Anchor Period" parameter.
🔶 SETTINGS
🔹 Data Gathering
Anchor period: Time period representing each bar: hours of the day, days of the week, weeks of the month, and months of the year. The timeframe of the chart must be less than this parameter, otherwise a warning will be displayed.
🔹 Style
Bars width: Size of each bar, there is a maximum limit so a warning will be displayed if it is reached.
Volume color
Delta: Enable/Disable Delta Area Display

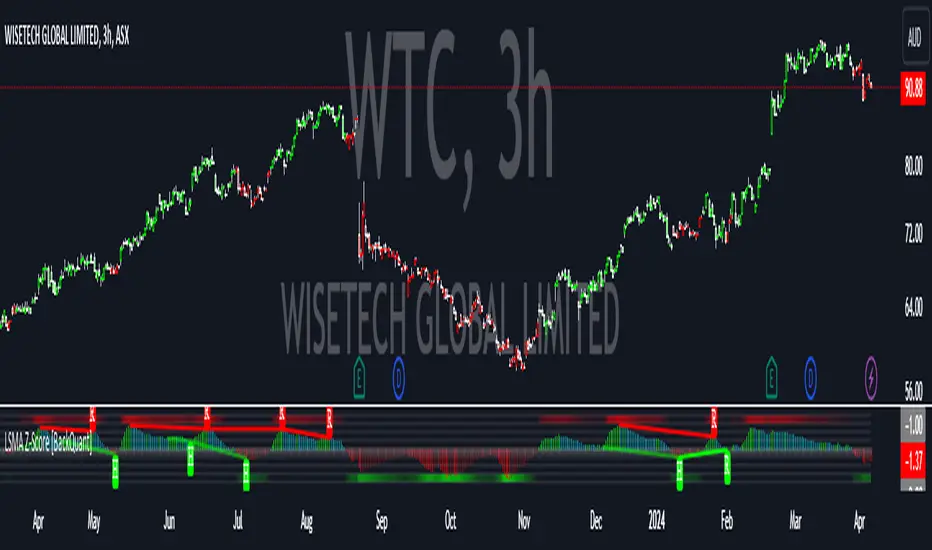
LSMA Z-Score [BackQuant]LSMA Z-Score
Main Features and Use in the Trading Strategy
- The indicator normalizes the LSMA into a detrended Z-Score, creating an oscillator with standard deviation levels to indicate trend strength.
- Adaptive coloring highlights the rate of change and potential reversals, with different colors for positive and negative changes above and below the midline.
- Extreme levels with adaptive coloring indicate the probability of a reversion, providing strategic entry or exit points.
- Alert conditions for crossing the midline or significant shifts in trend direction enhance its utility within a trading strategy.
1. What is an LSMA?
The Least Squares Moving Average (LSMA) is a technical indicator that smoothens price data to help identify trends. It uses the least squares regression method to fit a straight line through the selected price points over a specified period. This approach minimizes the sum of the squares of the distances between the line and the price points, providing a more statistically grounded moving average that can adapt more smoothly to price changes.
2. What is a Z-Score?
A Z-Score is a statistical measurement that describes a value's relationship to the mean of a group of values, measured in terms of standard deviations from the mean. If a Z-Score is 0, it indicates that the data point's score is identical to the mean score. A Z-Score helps in understanding if a data point is typical for a given data set or if it is atypical. In finance, a Z-Score is often used to measure how far a piece of data is from the average of a set, which can be helpful in identifying outliers or unusual data points.
3. Why Turning LSMA into a Z-Score is Innovative and Its Benefits
Converting LSMA into a Z-Score is innovative because it combines the trend identification capabilities of the LSMA with the statistical significance testing of Z-Scores. This transformation normalizes the LSMA, creating a detrended oscillator that oscillates around a mean (zero line), with standard deviation levels to show trend strength. This method offers several benefits:
Enhanced Trend Detection:
- By normalizing the LSMA, traders can more easily identify when the price is deviating significantly from its trend, which can signal potential trading opportunities.
Standardization:
- The Z-Score transformation allows for comparisons across different assets or time frames, as the score is standardized.
Objective Measurement of Trend Strength:
- The use of standard deviation levels provides an objective measure of trend strength and volatility.
4. How It Can Be Used in the Context of a Trading System
This indicator can serve as a versatile tool within a trading system for a range of things:
Trend Confirmation:
- A positive Z-Score can confirm an uptrend, while a negative Z-Score can confirm a downtrend, providing traders with signals to enter or exit trades.
Oversold/Overbought Conditions:
- Extreme Z-Score levels can indicate overbought or oversold conditions, suggesting potential reversals or pullbacks.
Volatility Assessment:
- The standard deviation levels can help traders assess market volatility, with wider bands indicating higher volatility.
5. How It Can Be Used for Trend Following
For trend following strategies, this indicator can be particularly useful:
Trend Strength Indicator:
- By monitoring the Z-Score's distance from zero, traders can gauge the strength of the current trend, with larger absolute values indicating stronger trends.
Directional Bias:
- Positive Z-Scores can be used to establish a bullish bias, while negative Z-Scores can establish a bearish bias, guiding trend following entries and exits.
Color-Coding for Trend Changes :
- The adaptive coloring of the indicator based on the rate of change and extreme levels provides visual cues for potential trend reversals or continuations.
Thus following all of the key points here are some sample backtests on the 1D Chart
Disclaimer: Backtests are based off past results, and are not indicative of the future.
This is using the Midline Crossover:
INDEX:BTCUSD
INDEX:ETHUSD
BINANCE:SOLUSD
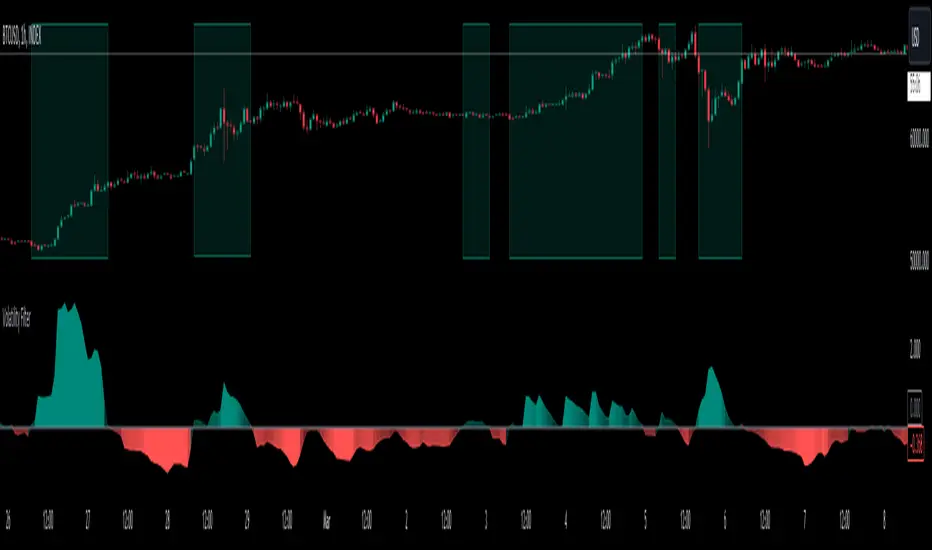
Volatility Filter v2VF v2 is a new iteration of my tool designed for traders who wish to gain a deeper understanding of market dynamics, specifically to distinguish periods of high volatility, which often correspond to strong market trends. By identifying these periods, traders can make more informed decisions, potentially leading to better trading outcomes.
Understanding Market Volatility:
At the heart of this script lies the concept of market volatility, a statistical measure reflecting the degree of variation in trading prices. Volatility is pivotal for traders; it provides insights into the market's emotional state, indicating periods of uncertainty or confidence. High volatility often correlates with strong trends, making it a critical indicator for trend-followers. By identifying when volatility crosses a certain threshold, traders can discern whether the market is likely to be in a trending phase or a more subdued, range-bound state.
How the Script Works:
The core functionality of the script revolves around a signal line that oscillates around a zero threshold. When the signal line is above zero, it indicates increased market volatility, suggesting the presence of a trend. The farther the oscillator deviates from zero, the stronger the implied trend. This mechanism enables traders to visually gauge market conditions and adjust their strategies accordingly.
Controlling the Indicator:
To cater to diverse trading styles and preferences, the script is equipped with several customizable settings:
Filter Threshold: This 'zero line' acts as the baseline for distinguishing between different volatility regimes. Crossing this threshold is a primary signal for changes in market volatility.
Moving Average Type: With over 30 types of moving averages to choose from, traders can select the one that best fits their analysis style. Each type offers a different perspective on price data, allowing for a tailored approach to trend identification.
Colorize Indicator: This feature enhances the visual representation of the indicator, making it easier to interpret. When enabled, the oscillator's color intensity varies with its proximity to the extremes, providing a quick visual cue about trend strength.
Advanced Settings – Length and Multiplier:
The script introduces an innovative approach to time frame analysis through its length and multiplier settings:
Length: This parameter sets the base period for all metrics within the script, similar to traditional indicators.
Multiplier: This unique feature differentiates the script by incorporating three distinct timeframes into the analysis: a lower timeframe, the main (current) timeframe, and a higher timeframe. The multiplier adjusts these timeframes relative to the main one. For instance, with a daily main timeframe and a multiplier of 2, the lower timeframe would be 12 hours, and the higher timeframe would be 2 days. This tri-timeframe approach aims to provide a more comprehensive volatility assessment.
Volatility Filter Indicators Section:
The script utilizes nine different, undisclosed metrics within its volatility filter. Traders have the flexibility to enable or disable these metrics based on their preferences, allowing for a customizable trading experience. Additionally, the script offers alert functionality for when the indicator crosses the threshold, either upwards or downwards, facilitating timely decision-making.
P.S
With better understanding of markets over time, I designed a new iteration of my volatility filter indicator. The second version provides faster, more precise way to analyze markets, but I also wanted to keep my first version untouched in case if some people find it better for their purposes. As I mentioned above, this version is calculated in a very different way from a previous one, so if you never tried it you can do it here
Dual SMA/EMA BandsThe Dual SMA/EMA Bands indicator provides a clear view of market trends, combining Simple Moving Averages (SMA) and Exponential Moving Averages (EMA) in one customizable tool. Designed for any timeframe, it features Aqua and Purple Bands for 50-period and 200-period averages , respectively, aiding in trend analysis and volatility insights.
Features:
Adaptive Timeframes : Automatically aligns with the chart’s timeframe or can be manually set for cross-timeframe analysis.
Customization : Offers easy adjustments for colors, line thickness, and opacity to suit personal preferences and enhance readability.
Insights : Facilitates trend confirmation and volatility assessment, essential for informed trading decisions.
Usage Tips:
Use the bands to gauge market direction; above the bands suggests bullish conditions, below them indicates bearish trends.
The gap between EMA and SMA within each band can signal market volatility.
Apply customizable timeframes for a comprehensive market overview.
Conclusion:
With its straightforward setup and versatile application, the Dual SMA/EMA Bands indicator is a valuable tool for traders looking to deepen their market analysis and uncover trading opportunities.

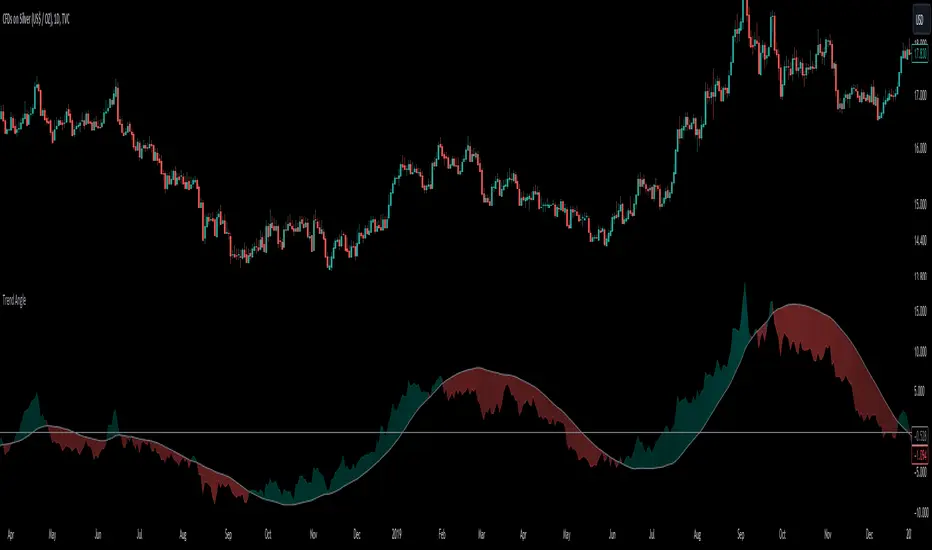
Trend AngleThe "Trend Angle" indicator serves as a tool for traders to decipher market trends through a methodical lens. It quantifies the inclination of price movements within a specified timeframe, making it easy to understand current trend dynamics.
Conceptual Foundation:
Angle Measurement: The essence of the "Trend Angle" indicator is its ability to compute the angle between the price trajectory over a defined period and the horizontal axis. This is achieved through the calculation of the arctangent of the percentage price change, offering a straightforward measure of market directionality.
Smoothing Mechanisms: The indicator incorporates options for "Moving Average" and "Linear Regression" as smoothing mechanisms. This adaptability allows for refined trend analysis, catering to diverse market conditions and individual preferences.
Functional Versatility:
Source Adaptability: The indicator affords the flexibility to select the desired price source, enabling users to tailor the angle calculation to their analytical framework and other indicators.
Detrending Capability: With the detrending feature, the indicator allows for the subtraction of the smoothing line from the calculated angle, highlighting deviations from the main trend. This is particularly useful for identifying potential trend reversals or significant market shifts.
Customizable Period: The 'Length' parameter empowers traders to define the observation window for both the trend angle calculation and its smoothing, accommodating various trading horizons.
Visual Intuition: The optional colorization enhances interpretability, with the indicator's color shifting based on its relation to the smoothing line, thereby providing an immediate visual cue regarding the trend's direction.
Interpretative Results:
Market Flatness: An angle proximate to 0 suggests a flat market condition, indicating a lack of significant directional movement. This insight can be pivotal for traders in assessing market stagnation.
Trending Market: Conversely, a relatively high angle denotes a trending market, signifying strong directional momentum. This distinction is crucial for traders aiming to capitalize on trend-driven opportunities.
Analytical Nuance vs. Simplicity:
While the "Trend Angle" indicator is underpinned by mathematical principles, its utility lies in its simplicity and interpretative clarity. However, it is imperative to acknowledge that this tool should be employed as part of a comprehensive trading strategy , complemented by other analytical instruments for a holistic market analysis.
In essence, the "Trend Angle" indicator exemplifies the harmonization of simplicity and analytical rigor. Its design respects the complexity of market behaviors while offering straightforward, actionable insights, making it a valuable component in the arsenal of both seasoned and novice traders alike.
Kalman Filtered RSI Oscillator [BackQuant]Kalman Filtered RSI Oscillator
The Kalman Filtered RSI Oscillator is BackQuants new free indicator designed for traders seeking an advanced, empirical approach to trend detection and momentum analysis. By integrating the robustness of a Kalman filter with the adaptability of the Relative Strength Index (RSI), this tool offers a sophisticated method to capture market dynamics. This indicator is crafted to provide a clearer, more responsive insight into price trends and momentum shifts, enabling traders to make informed decisions in fast-moving markets.
Core Principles
Kalman Filter Dynamics:
At its core, the Kalman Filtered RSI Oscillator leverages the Kalman filter, renowned for its efficiency in predicting the state of linear dynamic systems amidst uncertainties. By applying it to the RSI calculation, the tool adeptly filters out market noise, offering a smoothed price source that forms the basis for more accurate momentum analysis. The inclusion of customizable parameters like process noise, measurement noise, and filter order allows traders to fine-tune the filter’s sensitivity to market changes, making it a versatile tool for various trading environments.
RSI Adaptation:
The RSI is a widely used momentum oscillator that measures the speed and change of price movements. By integrating the RSI with the Kalman filter, the oscillator not only identifies the prevailing trend but also provides a smoothed representation of momentum. This synergy enhances the indicator's ability to signal potential reversals and trend continuations with a higher degree of reliability.
Advanced Smoothing Techniques:
The indicator further offers an optional smoothing feature for the RSI, employing a selection of moving averages (HMA, THMA, EHMA, SMA, EMA, WMA, TEMA, VWMA) for traders seeking to reduce volatility and refine signal clarity. This advanced smoothing mechanism is pivotal for traders looking to mitigate the effects of short-term price fluctuations on the RSI's accuracy.
Empirical Significance:
Empirically, the Kalman Filtered RSI Oscillator stands out for its dynamic adjustment to market conditions. Unlike static indicators, the Kalman filter continuously updates its estimates based on incoming price data, making it inherently more responsive to new market information. This dynamic adaptation, combined with the RSI's momentum analysis, offers a powerful approach to understanding market trends and momentum with a depth not available in traditional indicators.
Trend Identification and Momentum Analysis:
Traders can use the Kalman Filtered RSI Oscillator to identify strong trends and momentum shifts. The color-coded RSI columns provide immediate visual cues on the market's direction and strength, aiding in quick decision-making.
Optimal for Various Market Conditions:
The flexibility in tuning the Kalman filter parameters makes this indicator suitable for a wide range of assets and market conditions, from volatile to stable markets. Traders can adjust the settings based on empirical testing to find the optimal configuration for their trading strategy.
Complementary to Other Analytical Tools:
While powerful on its own, the Kalman Filtered RSI Oscillator is best used in conjunction with other analytical tools and indicators. Combining it with volume analysis, price action patterns, or other trend-following indicators can provide a comprehensive view of the market, allowing for more nuanced and informed trading decisions.
The Kalman Filtered RSI Oscillator is a groundbreaking tool that marries empirical precision with advanced trend analysis techniques. Its innovative use of the Kalman filter to enhance the RSI's performance offers traders an unparalleled ability to navigate the complexities of modern financial markets. Whether you're a novice looking to refine your trading approach or a seasoned professional seeking advanced analytical tools, the Kalman Filtered RSI Oscillator represents a significant step forward in technical analysis capabilities.
Thus following all of the key points here are some sample backtests on the 1D Chart
Disclaimer: Backtests are based off past results, and are not indicative of the future.
INDEX:BTCUSD
INDEX:ETHUSD
BINANCE:SOLUSD

MTF TREND-PANEL-(AS)
0). INTRODUCTION: "MTF TREND-PANEL-(AS)" is a technical tool for traders who often perform multi-timeframe analysis.
This simple tool is meant for traders who wish to monitor and keep track of trend directions simultaneously on various timeframes, ranging from 1MIN to 3MONTHS (or other - 'DIFF')
script enhances decision-making efficiency and provides a clearer picture of market condition by integrating multiple timeframe analysis into a single panel.
1). WARNING!:
-script doesn't make any calculations on its own really but is more of a tool for traders to remember what is happening on other time frames
- use tooltips to navigate settings easier
2). MAIN OPTIONS:
- Keeps track of up to 7 timeframes. (NUMBER of TimeFrames setting, from 1-7)
- Customizable Display: Choose to display nothing, upward/downward arrows, or a range indication for each timeframe.
- timeframe options: '1-MIN','5-MIN','15-MIN','30-MIN','1H','4H','1D','1W','1M','3M','DIFF'
- Color Coding: Define your preferred colors for each timeframe
- set position of the table and size of text (Position/text)
- Personal Touch: Add your own trading maxim or motto for inspiration to show up when SHOW TEXT is turned on
3. )OPTIONS:
-NUMBER of TimeFrames setting: from 1-7 - how many rows to show
-SHOW TABLE: Toggle to display or hide the trend table panel.
-SHOW TEXT: Show or hide your personalized trading maxim.
-SHOW TREND: Enable to display trend direction arrows.
-SHOW_CLRS: Turn on to activate color coding for each timeframe.
-position/text size for table
-settings for each timeframe:color,time,trend
-place to type ur own text
5). How to Use the Script:
-After adding the script to your chart, use the 'NUMBER of TimeFrames' setting to select how many timeframes you want to track (1 to 7).
-Customize the appearance of each timeframe row using the color and arrow options.
-For trend analysis, the script offers arrows to indicate upward, downward, or ranging markets.
-decide what trend dominates particular TF (using other tools - script does not calculate trend on its own )
- mark trends on panel to keep track of all TF
-Enable or disable various features like the table panel, trader maxim, and color coding using the ON/OFF options.
6). just in case:
- ask me anything about the code
-don't be shy to report any bugs or offer improvements of any kind.
- originally created for @ict_whiz and made public at his request

ziksfx Structure - LiteInspired by the 'mentfx Structure' indicator created by Anton (mentfx) on TradingView, I have developed my own unique version of the market structure indicator, enhancing it with features that resonate with my personal trading style and offer additional insights into market behaviour.
In the spirit of Anton's original concept, my indicator incorporates the fundamental idea of "sells before buys" for bullish ranges and "buys before sells" for bearish ranges. This methodological approach is designed to mirror the activities of large market participants who typically offload positions before accumulating again in a bullish context, and accumulate before offloading in a bearish context.
The "ranges" displayed on the chart represent historical and updated highs and lows, reflecting the structural delivery of price across any timeframe. This approach assumes that in a bullish range, the market is likely to sustain upward momentum until it reaches a new high or experiences a significant "sell before buy" scenario, and conversely in a bearish range.
Key Enhancements and Features:
Immediate Break of Structure (BOS) Recognition: This feature promptly updates the high/low to the candle that triggers a BOS, providing a more agile response compared to the original mentfx Structure's approach of waiting for a swing high/low to set the range. This adaptation allows me for quicker adaptation to the market's unfolding narrative.
Market Stage Visualization: By seamlessly integrating with the structure tracking, my indicator presents the current 'Market Stage,' offering a clear stage of the current market's phase, which is crucial for informed trading decisions. The core methodology for determining market stages is derived from the foundational concepts established by mentfx.
Moving Average Integration: The inclusion of a Moving Average (MA) within the indicator adds a layer of trend confirmation, reinforcing decisions based on market structure with established trend analysis techniques. You can use EMA or SMA.
Customizable Session Settings: Tailor the indicator to focus on specific market hours, enhancing its utility for session-based trading strategies and backtesting efficiency.
Triple M: The Triple-M feature is also included in this indicator, which provides a visual representation of the market's momentum and potential reverse.
ATR: Utilizes the Average True Range (ATR) to estimate stop loss levels, providing a data-driven method to manage risk in accordance with current market volatility.
Watermark: Displays the name of the ticker and the current timeframe directly on the chart for easy reference, ensuring clarity and orientation when analyzing multiple instruments or timeframes.
How It Works:
When a range is assigned as being bullish, it will continue updating the high until a new high is created after the bos (= the new high of the range) and will not update or change until a candle's body, open's or close's above it - which will re-update the high and update the low. The low will be updated based on the last time price had a candle (open or closure) below a previous candle low, and then will find the lowest low after the rule was met to assign a low (the idea here is to locate the last major "sell before buy" and showcase that range. And this will occur vice versa, where: when a range is assigned as bearish, it will continue updating the low until a true low is created (=low of the range) and will not update or change until a candle's body, open's or close's below it - which will reupdate the low and update the high. The high will be updated based on the last time price had a candle (open or closure) above a previous candle high, and then will find the highest high after the rule was met to assign a high (once again, the idea being to locate the last major "buy before sell" and showcase price as existing in that range.)
A high is considered as a high that has a lower high to its left and to its right. And a low is considered as a low that has a higher low to its left and to its right. These high and low are used to determine the final high or low of a Bullish or Bearish range (respectively).
Range Determination: The indicator assesses the market momentum and assigns a Bullish or Bearish state based on the most recent directional break.
High/Low Rules Adaptation: In a Bullish range, indicator updates the high if a candle's body, not just the wick, exceeds the current high. This subtle yet significant change allows for a more conservative and potentially more accurate portrayal of bullish sentiment.
Dynamic Updating: As the market evolves, the indicator recalibrates the high and low lines based on the latest price movements, ensuring that you always have the most current and relevant data.
The indicator is not merely a trend-following or scalping tool. It leverages a distinct interpretation of market behavior, focusing on the last major "sell before buy" in Bullish ranges and "buy before sell" in Bearish ranges. By doing so, it aims to pinpoint the true sentiment behind price movements, offering traders a more grounded basis for anticipating market trends.
Of course, a special acknowledgment is due to Anton for his foundational work and the insightful knowledge he's giving day-by-day. The principles of his structure tracking method and market approach have significantly influenced the creation of this indicator, which now carries those insights forward, adapted through the lens of my personal trading philosophy.

Swing Trading Indicators (Improved)This "Swing Trading Indicators" script is a sophisticated trading tool designed for traders who wants to use technical analysis for identifying optimal entry points, safeguarding profits, and protect their capital. With foundations loosely based on the momentum burst strategy by Pradeep Bonde, Kristjan Kullamaggie's trading methodologies, and incorporating automatic stop-losses based on Average Daily Range (ADR) and Average True Range (ATR), this script offers a comprehensive solution if you want to capitalize on short-term market movements.
Key Features:
Indicators and Moving Averages: Includes EMA (5, 10, 20, 50 days), SMA (200 days), and the highest and lowest prices over 200 days to provide a multifaceted view of market trends and momentum.
Thrust Indicator: Central to the script, the thrust indicator signals a buy point when a candlestick bar closes above the highs of the last two days, indicating a momentum burst. This feature is particularly inspired by Pradeep Bonde's 4% breakout strategy, highlighting the script's capability to identify range expansion and upward thrusts as key entry moments.
Automatic Stop-Levels: Utilizes ADR and ATR to set dynamic stop-losses, helping traders to manage risk effectively by adapting to market volatility.
Comprehensive Market Analysis : Through volume analysis, RSI, closing range, and other parameters, the script offers a deep dive into market dynamics, aiding in decision-making.
Who Should Use It:
This tool is ideal for swing traders and momentum traders focused on short to medium-term gains. Its robust set of features makes it suitable for those who prefer a data-driven approach to identify buying opportunities and manage risk.
Trading Style Compatibility:
The thrust indicator shines in momentum trading strategies, providing clear signals for entering trades ahead of potential price jumps. The integration of moving averages and volume analysis supports a variety of trading styles, including day trading and swing trading, by offering insights into trend strength and potential reversals.
How the Thrust Indicator Works:
When you see a thrust indicator (green upwards arrow below a candle) when the price is moving out of a consolidation or low volatility price-range , that's the buy point.
The thrust indicator is NOT indended as an indicator for long term positions or trend reversals, but for entries at a good price while capturing the first day of a potential 5-20% move in the coming 3-5 days.
The thrust indicator pinpoints moments when a stock shows a strong upward momentum, characterized by a candlestick closing above the highs of the preceding two days. This identifies a momentum burst, signaling an optimal entry point for traders looking to profit from a short-term price movement, typically ranging from 5-20% over the following 3-5 days. Such precision in identifying entry points is invaluable for traders focusing on capturing quick gains from market volatility.
"Top / Watch out" Indicator:
In addition to the script's core functionality, the "WatchOut" indicator plays a crucial role in identifying potential reversals after significant price movements. By analyzing conditions such as recent price increases compared to the average daily range, RSI levels, and the opening price distance from the EMA, the "WatchOut" indicator alerts traders to exercise caution. This feature is pivotal for those looking to avoid entering trades that might be on the verge of a pullback or reversal, enhancing the script's utility in managing risk.

Composite Trend Oscillator [ChartPrime]CODE DUELLO:
Have you ever stopped to wonder what the underlying filters contained within complex algorithms are actually providing for you? Wouldn't it be nice to actually visually inspect for that? Those would require some kind of wild west styled quick draw duel or some comparison method as a proper 'code duello'. Then it can be determined which filter can 'draw' the quickest from it's computational holster with the least amount of lag and smoothness.
In Pine we can do so, discovering how beneficial that would be. This can be accomplished by quickly switching from one filter to another by input() back and forth, requiring visual memory. A better way could be done by placing two indicators added to the chart and then eventually placed into one indicator pane on top of each other.
By adding a filter() helper function that calls other moving average functions chosen for comparison, it can put to the test which moving average is the best drawing filter suited to our expected needs. PhiSmoother was formerly debuted and now it is utilized in a more complex environment in a multitude of ways along side other commonly utilized filters. Now, you the reader, get to judge for yourself...
FILTER VERSATILITY:
Having the capability to adjust between various smoothing methods such as PhiSmoother, TEMA, DEMA, WMA, EMA, and SMA on historical market data within the code provides an advantage. Each of these filter methods offers distinct advantages and hinderances. PhiSmoother stands out often by having superb noise rejection, while also being able to manipulate the fine-tuning of the phase or lag of the indicator, enhancing responsiveness to price movements.
The following are more well-known classic filters. TEMA (Triple Exponential Moving Average) and DEMA (Double Exponential Moving Average) offer reduced transient response times to price changes fluctuations. WMA (Weighted Moving Average) assigns more weight to recent data points, making it particularly useful for reduced lag. EMA (Exponential Moving Average) strikes a balance between responsiveness and computational efficiency, making it a popular choice. SMA (Simple Moving Average) provides a straightforward calculation based on the arithmetic mean of the data. VWMA and RMA have both been excluded for varying reasons, both being unworthy of having explanation here.
By allowing for adjustment refinements between these filter methods, traders may garner the flexibility to adapt their analysis to different market dynamics, optimizing their algorithms for improved decision-making and performance on demand.
INDICATOR INTRODUCTION:
ChartPrime's Composite Trend Oscillator operates as an oscillator based on the concept of a moving average ribbon. It utilizes up to 32 filters with progressively longer periods to assess trend direction and strength. Embedded within this indicator is an alternative view that utilizes the separation of the ribbon filaments to assess volatility. Both versions are excellent candidates for trend and momentum, both offering visualization of polarity, directional coloring, and filter crossings. Anyone who has former experience using RSI or stochastics may have ease of understanding applying this to their chart.
COMPOSITE CLUSTER MODES EXPLAINED:
In Trend Strength mode, the oscillator behavior signifies market direction and movement strength. When the oscillator is rising and above zero, the market is within a bullish phase, and visa versa. If the signal filter crosses the composite trend, this indicates a potential dynamic shift signaling a possible reversal. When the oscillator is teetering on its extremities, the market is more inclined to reverse later.
With Volatility mode, the oscillator undergoes a transformation, displaying an unbounded oscillator driven by market volatility. While it still employs the same scoring mechanism, it is now scaled according to the strength of the market move. This can aid with identification of ranging scenarios. However, one side effect is that the oscillator no longer has minimum or maximum boundaries. This can still be advantageous when considering divergences.
NOTEWORTHY SETTINGS FEATURES:
The following input settings described offer comprehensive control over the indicator's behavior and visualization.
Common Controls:
Price Source Selection - The indicator offers flexibility in choosing the price source for analysis. Traders can select from multiple options.
Composite Cluster Mode - Choose between "Trend Strength" and "Volatility" modes, providing insights into trend directionality or volatility weighting.
Cluster Filter and Length - Selects a filter for the cluster composition. This includes a length parameter adjustment.
Cluster Options:
Cluster Dispersion - Users can adjust the separation between moving averages in the cluster, influencing the sensitivity of the analysis.
Cluster Trimming - By modifying upper and lower trim parameters, traders can adjust the sensitivity of the moving averages within the cluster, enhancing its adaptability.
PostSmooth Filter and Length - Choose a filter to refine the composite cluster's post-smoothing with a length parameter adjustment.
Signal Filter and Length - Users can select a filter for the lagging signal plot, also having a length parameter adjustment.
Transition Easing - Sensitivity adjustment to influence the transition between bullish and bearish colors.
Enjoy

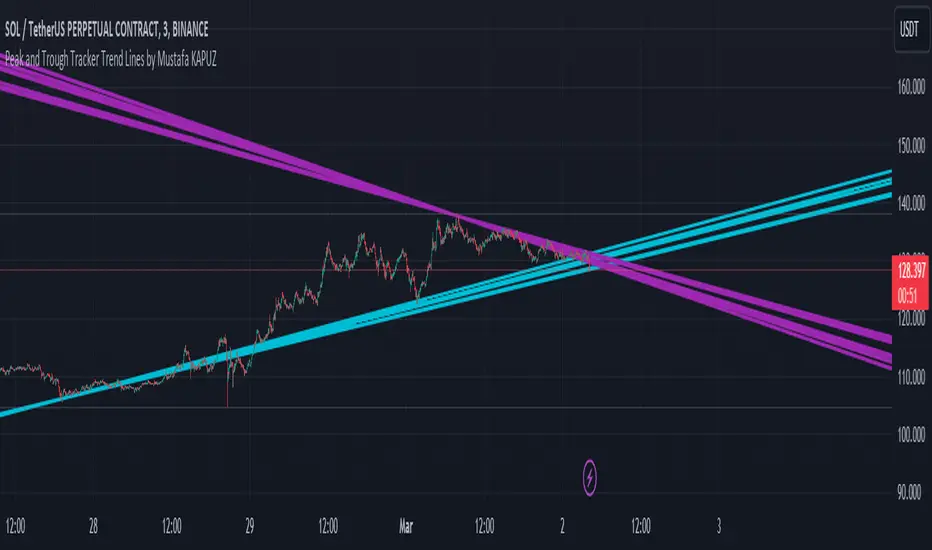
Peak and Trough Tracker by Mustafa KAPUZPeak and Trough Tracker
This indicator identifies the highest and lowest prices reached in two user-defined time periods. It then draws two lines connecting these peak and trough points. The purple line represents the connection between the highest prices, while the aqua line represents the relationship between the lowest prices. Both lines extend into the future and past, providing insights into potential support and resistance levels.
How to Use:
Add the indicator to your chart.
Enter two time periods.
Analyze the lines connecting peak and trough points.
This tool helps visually understand the market's key turning points and adjust your investment strategy based on these insights.
Zirve ve Dip Noktaları İzleyici
Bu indikatör, kullanıcı tarafından belirlenen iki zaman periyodunda piyasanın ulaştığı en yüksek ve en düşük fiyatları tespit eder. Ardından, bu zirve ve dip noktalarını birleştiren iki çizgi çizer. Mor çizgi, en yüksek fiyatlar arasındaki bağlantıyı gösterirken; aqua çizgi, en düşük fiyatlar arasındaki ilişkiyi temsil eder. Her iki çizgi de geleceğe ve geçmişe doğru uzanarak, potansiyel destek ve direnç seviyeleri hakkında fikir verir.
Kullanımı:
İndikatörü grafik üzerine ekleyin.
İki zaman periyodu girin.
Zirve ve dip noktalarını birleştiren çizgilerin analizini yapın.
Bu araç, piyasanın önemli dönüm noktalarını görsel olarak anlamanıza ve yatırım stratejinizi bu bilgilere göre ayarlamanıza yardımcı olur.
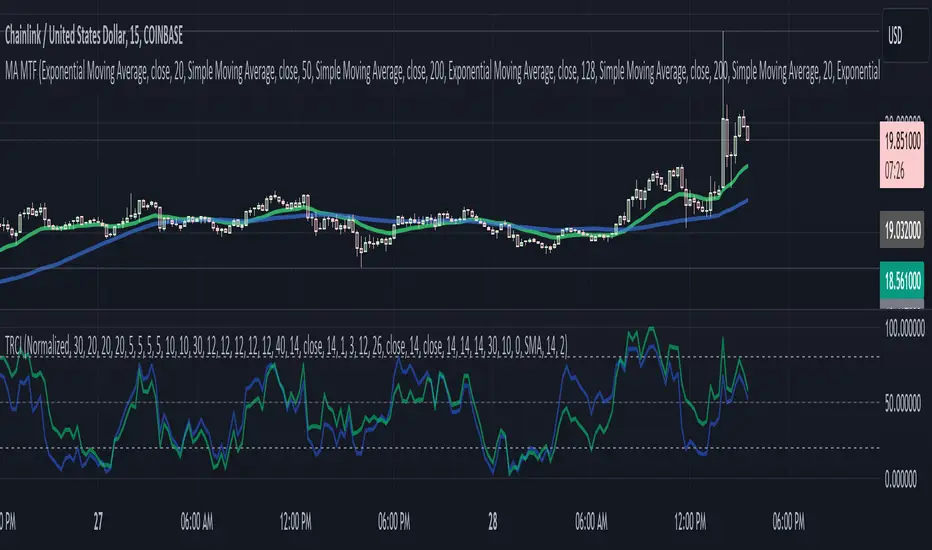
Trend Reversal Composite Index
Overview
The "Trend Reversal Composite Index" (TRCI) is a comprehensive technical analysis tool that combines several indicators to identify potential trend reversals and assess the overall market pulse. The script integrates a variety of technical indicators, including RSI, Stochastic, MACD, Bollinger Bands, Williams %R, OBV, ADX, ATR, and the Relative Volatility Index, each with adjustable weights to fine-tune their influence on the composite scores.
Key Features
Customization : Users can select the "Standardization Type" (Normalized or Z-Score) to standardize indicator values, catering to different analysis preferences.
Composite Scores : The script calculates two main composite scores: the "Trend Reversal Composite" and the "Market Pulse Composite," each derived from a weighted sum of standardized indicator values.
Indicator Weighting : Each indicator's impact on the composite scores can be adjusted through user-defined weights, enabling personalized sensitivity settings.
Dynamic Visuals : The script plots the composite scores and their exponential moving averages (EMAs) on the chart, offering a clear visualization of the market's condition and trend reversals.
Signal Identification : It provides clear "go long" and "go short" signals based on the crossover and crossunder of the composite score and predefined thresholds, assisting in decision-making.
Utility and Originality
TRCI stands out due to its integrative approach, combining multiple indicators into a single composite index. This not only simplifies the analysis by providing a consolidated view of various signals but also enhances the decision-making process by aggregating the predictive power of individual indicators. Its flexibility in customization through adjustable weights and standardization types allows users to tailor the tool according to their trading style and market conditions.
Implementation and Usage
To utilize the TRCI effectively, traders should first experiment with the weights of different indicators based on their trading strategy and the market's volatility. The composite scores offer a straightforward interpretation: higher values may indicate potential buying opportunities, while lower values could signal selling points. The inclusion of EMAs further aids in smoothing out the signals, providing a more reliable indicator of trend direction.
Conclusion
The "Trend Reversal Composite Index" is a versatile and innovative tool for traders looking to streamline their technical analysis and enhance their decision-making process. Its combination of multiple indicators into composite scores, customizable through user-defined weights, makes it a valuable addition to any trader's toolkit.