Trend IntensityThis indicator uses 5 & 65 EMA to gauge intensity of a trend. It is useful for determining a trends newness & strength.
To calculate Trend Intensity, we simply divide the value of the 5 EMA by 65 EMA.
The indicator uses data from previous 500 bars to automatically calculate the minimum bullish and bearish intensity value, individual to each stock.
When a stock's current intensity is above the minimum bullish intensity value determined from its historical data, the indicator will color the area between the 5 & 65 EMA as Green, indicating an environment favoring Longs.
Similarly, when the stock's current intensity is below the minimum bearish intensity value, the indicator will color the area red, indicating an environment favoring shorts.
Lastly, when the stock is not trading above or below the minimum bullish or bearish intensity respectively, the indicator will color the area yellow, indicating slowing down of momentum or intensity, a choppy sideways environment or change of a trend.
Trend Intensity Indicator is inspired & modeled on the same concept by Mr. Pradeep Bonde(Stockbee).
Trend

Adaptive Gaussian Moving AverageThe Adaptive Gaussian Moving Average (AGMA) is a versatile technical indicator that combines the concept of a Gaussian Moving Average (GMA) with adaptive parameters based on market volatility. The indicator aims to provide a smoothed trend line that dynamically adjusts to different market conditions, offering a more responsive analysis of price movements.
Calculation:
The AGMA is calculated by applying a weighted moving average based on a Gaussian distribution. The length parameter determines the number of bars considered for the calculation. The adaptive parameter enables or disables the adaptive feature. When adaptive is true, the sigma value, which represents the standard deviation, is dynamically calculated using the standard deviation of the closing prices over the volatilityPeriod. When adaptive is false, a user-defined fixed value for sigma can be input.
Interpretation:
The AGMA generates a smoothed line that follows the trend of the price action. When the AGMA line is rising, it suggests an uptrend, while a declining line indicates a downtrend. The adaptive feature allows the indicator to adjust its sensitivity based on market volatility, making it more responsive during periods of high volatility and less sensitive during low volatility conditions.
Potential Uses in Strategies:
-- Trend Identification : Traders can use the AGMA to identify the direction of the prevailing trend. Buying opportunities may arise when the price is above the AGMA line during an uptrend, while selling opportunities may be considered when the price is below the AGMA line during a downtrend.
-- Trend Confirmation : The AGMA can be used in conjunction with other technical indicators or trend-following strategies to confirm the strength and sustainability of a trend. A strong and steady AGMA line can provide additional confidence in the prevailing trend.
-- Volatility-Based Strategies : Traders can utilize the adaptive feature of the AGMA to build volatility-based strategies. By adjusting the sigma value based on market volatility, the indicator can dynamically adapt to changing market conditions, potentially improving the accuracy of entry and exit signals.
Limitations:
-- Lagging Indicator : Like other moving averages, the AGMA is a lagging indicator that relies on historical price data. It may not provide timely signals during rapidly changing market conditions or sharp price reversals.
-- Whipsaw in Sideways Markets : During periods of low volatility or when the market is moving sideways, the AGMA may generate false signals or exhibit frequent crossovers around the price, leading to whipsaw trades.
-- Subjectivity of Parameters : The choice of length, adaptive parameters, and volatility period requires careful consideration and customization based on individual preferences and trading strategies. Traders need to adjust these parameters to suit the specific market and timeframe they are trading.
Overall, the Adaptive Gaussian Moving Average can be a valuable tool in trend identification and confirmation, especially when combined with other technical analysis techniques. However, traders should exercise caution, conduct thorough analysis, and consider the indicator's limitations when incorporating it into their trading strategies.

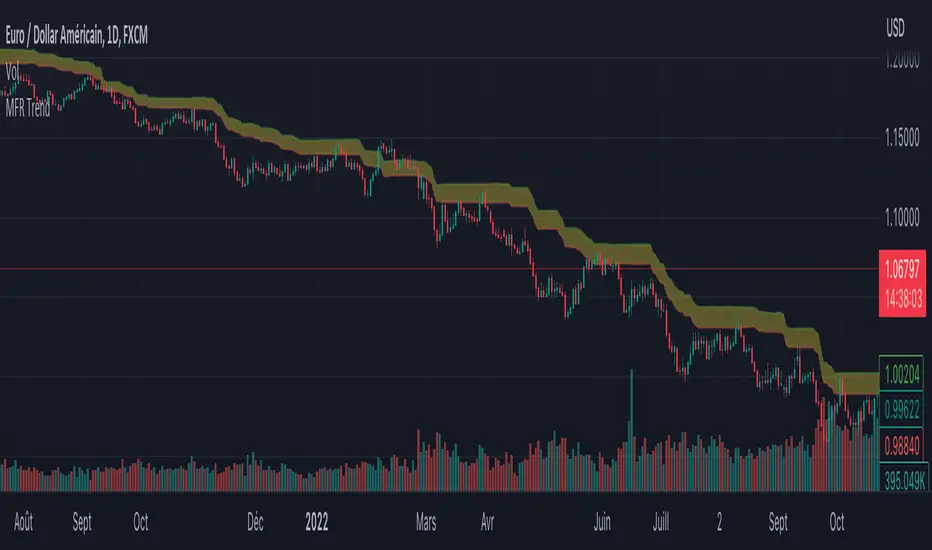
Myfractalrange TrendHello Traders!
This is our main addition to MFR TradingView account: Myfractalrange Trend.
Many Trend signals exist out there, each trader has at some point created its own.
At Myfractalrange, we have developed a proprietary formula based on Price, Volume and Volatility.
Before going into how subscribers can use the Trend script, let't have a look at the different data point provided one by one:
- Bullish Trend: If the price of the asset is above this value, the asset is considered to be Bullish Trend. Default colour is green
- Bearish Trend : If the price of the asset is below this value, the asset is considered to be Bearish Trend. Default colour is red
- Neutral Trend: If the price of the asset is between the value of the Bullish Trend and the value of the Bearish Trend, the asset is considered to be Neutral Trend. Default colour is yellow
How does the script work?
The provided script is proprietary, so while the specific calculations and data sources cannot be disclosed, here is a broad explanation on how it works:
- It will retrieve the relevant data from the asset, could be volume, close, high, low, etc.
- The script will then check the length for the trend calculation of this specific asset and compute the Trend line
- From the value of this Trend line, we will then generate the "bullish" and "bearish" values
- The script will then plot the Bullish and Bearish values on the chart, the area between both being set as the Neutral area
How to use trend when trading?
When trading, understanding and utilising trends can be valuable for making informed trading decisions. Here are some key ways to use trends in trading:
- Trend Identification: Identifying the presence and direction of a trend is crucial
- Trend Following: One common trading strategy is trend following, which involves trading in the direction of the prevailing trend. In an uptrend, traders may look for opportunities to buy or go long, while in a downtrend, they may seek opportunities to sell or go short. Trend following strategies assume that trends are more likely to continue than reverse, and traders aim to capitalise on sustained price movements
- Trend Reversals: Identifying potential trend reversals is another approach. Traders may look for signs that a trend is losing momentum or showing signs of exhaustion. Traders may then consider taking contrarian positions or closing existing trades.
- Timing Entries and Exits: Trends can help with timing entry and exit points. Traders often aim to enter trades at favourable points within a trend, such as during pullbacks in an uptrend or rallies in a downtrend. This allows them to potentially capture favourable risk-to-reward ratios
- Risk Management: Incorporating trend analysis into risk management is crucial. Traders can set stop-loss orders or trailing stops based on the trend, aiming to protect profits or limit losses if the trend reverses. Position sizing can also be adjusted based on the strength or duration of a trend, with larger positions taken in strong, well-established trends
- Multiple Time Frame Analysis: Examining trends across different time frames can provide a broader perspective. Traders can look for alignment in trends across shorter-term and longer-term charts to gain confidence in their trading decisions. For example, a Trend on a daily chart may align with a Trend on a hourly chart, reinforcing the potential trading opportunity
The Myfractalrange Trend signal can be used for all the possibilities listed above
Here is an example of a Bullish Trend pattern: BTFD set up
Here is an example of a Bearish Trend pattern: STFR set up
Why use Trend in combination with other indicators, such as Hurst and probable Range?
Using Trend in combination with Hurst exponent and probable Range can provide traders with a more comprehensive view of market dynamics and potential trading opportunities. Here's how the three concepts can complement each other:
- Trend Analysis: Trend analysis helps identify the prevailing direction of the market. It provides insights into whether the market is in an uptrend (Bullish), downtrend (Bearish), or sideways consolidation (Neutral). Trend analysis helps traders align their positions with the dominant market direction, increasing the likelihood of successful trades
- Hurst exponent: Hurst exponent is a measure of the persistence or mean reversion characteristics of a time series. It provides insights into the strength and sustainability of price movements. Hurst momentum analysis helps traders understand whether the market is exhibiting trending behaviour or mean-reverting behaviour. It can help identify potential reversals or continuation patterns in the price action.
- Probable Range: The Range refers to the expected price range within which an asset is likely to fluctuate, in our case the MFR Ranges (normal and longer-term). It helps traders set realistic profit targets and stop-loss levels. By combining the probable range with the trend and the Hurst Exponent, traders can better gauge the potential extent of price movements and make more informed decisions regarding entry and exit points.
How to use these tools together?
- Confirmation and Confluence: Combining Trend with Hurst & Range can provide confirmation and confluence signals. For instance, when the trend analysis indicates an uptrend, Hurst confirms strong positive momentum and Range confirms the upside potential, it provides a stronger signal for potential bullish trades
- Timing Entries and Exits: The combination of trend analysis, Hurst and Range can assist in timing entry and exit points. For example, when trend analysis indicates an uptrend, traders can look for bullish signals from Hurst value and low of the MFR Range to identify potential entry points during pullbacks or periods of consolidation. Conversely, in a downtrend, bearish signals from Hurst at the top of the MFR Range can guide traders in identifying potential short-selling opportunities during corrective rallies
- Risk Management: The integration of trend analysis with Hurst and Range can also aid in risk management. Traders can adjust their stop-loss levels and profit targets based on the strength of the trend, its strength and its Range. Tighter stop-loss levels can be set when both trend analysis, Hurst value and Range are aligned, indicating a higher probability of trend continuation. Conversely, wider stop-loss levels may be used when conflicting signals or weakening trends are observed
By combining Trend analysis, Hurst exponent and MFR probable Range, traders can gain a more comprehensive understanding of the market's behaviour and make more informed trading decisions.
It's important to note that while Trend is a useful tool, it should not be relied upon solely for making trading decisions. It's recommended to use it in conjunction with other technical analysis tools and consider other factors such as market conditions, risk management, and fundamental analysis. Remember that the momentum indicator is just one tool among many, and it's important to consider other factors such as volume, momentum, volatility, and overall market conditions when making trading decisions. Additionally, using stop-loss orders and proper risk management techniques is crucial to mitigate potential losses.
We hope that you will find these explanations useful, please contact us by private message for access.
Enjoy!
DISCLAIMER: No sharing, copying, reselling, modifying, or any other forms of use are authorised. This script is strictly for individual use and educational purposes only. This is not financial or investment advice. Investments are always made at your own risk and are based on your personal judgement. Myfractalrange is not responsible for any losses you may incur. Please invest wisely.
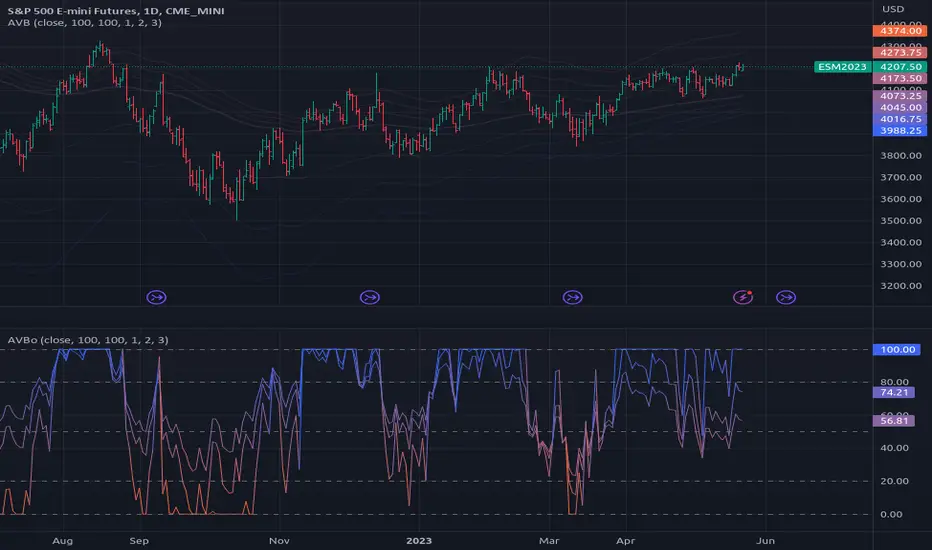
Average Variation Bands OscillatorSimilar to how a donchian% of channel helps to visualize trend and volatility, this tool helps identify those same characteristics, if the oscillator is generally above the 50 mark, it is considered to be trending upwards, and the reverse if it is generally bellow 50.
Vola2vola Volatility indicatorHello everyone!
For those who remember vola2vola volatility script, we are excited to bring it back within the Myfractalrange Tradingview account!
As you know, Volatility is very important to assets and many people use it to trade. This tool automate the calculation of the volatility of every asset as well as provide an estimated value of its "Trend" and "Trade".
The idea in this script is to allow users to have an idea of the current volatility regime of the asset he is monitoring: Is its volatility Bullish or Bearish Trend, Bearish or Bullish Trade? Is its volatility compressed to a previous minimum value? Is it about to experience a spike in volatility? Let's dig together into how this tool works and how you could integrate it into your trading shall we?
What are the data provided by the script, let see one by one:
- Volatility: The value of what vola2vola calls the "synthetic" volatility of the asset is calculated using a custom formula based on the VIXFIX formula. Default colour is blue
- Trade : Trade is generated using an arbitrary and fixed look back period, it acts as a short-term trend. It will give the user the possibility to know if the volatility of the asset is still trending short-term or not. Default colour is black
- Trend: Trend is also generated using an arbitrary and fixed look back period (20 times the one used for Trade), it acts as a longer-term trend. It works the same way as Trade and will give the user the possibility to know if the volatility of the asset is trending a longer-term basis or not. Default colours are: red when the Trend of the volatility of the asset is Bearish and green when the Trend of the volatility of the asset is Bullish
- 52-weeks high & low: Based on the highest and lowest value of Volatility in the past 52 weeks, a 52-weeks high and a 52-weeks low will be marked. These values usually acts as Resistance and Support for volatility. Default colour is black and they are in dotted lines
Here are some of the questions you need to know the answer to before using this script:
- How do you define a "Bullish/Bearish volatility Trade"? Volatility is Bullish Trade is when Volatility is above Trade and it is Bearish Trade when volatility is below Trade
- How do you define a "Bullish/Bearish volatility Trend"? Volatility is Bullish Trend is when Volatility is above Trend and it is Bearish Trend when volatility is below Trend
- On which time frame should i use this script? You want to use the Daily time frame. Although, for short term moves in the volatility space, users could monitor the Hourly timeframe
Understanding the volatility of an asset, along with the bullish or bearish nature of its Trade and Trend, is crucial for investors. Assets with decreasing volatility tend to appreciate in value, while those with increasing volatility tend to depreciate. Therefore, we recommend investors be aware of the volatility situation of the asset they are holding in their portfolio.
Here are the different scenarios that you will encounter on a Daily timeframe and how to interpret them:
- Volatility is below Trade & Trend and Volatility is Bearish Trade and Trend: It is the most Bullish set up for the price of an asset
- Volatility is above Trade & Trend and Volatility is Bullish Trade and Trend: It is the most Bearish set up for the price of an asset
- Any other set up suggests uncertainty, caution is therefore recommended
These are some cases that you could experience while using this script:
1) Bearish Volatility set up on a daily timeframe:
In this example using SPY, when its Volatility is Bearish Trend on a daily timeframe, the price of SPY tends to appreciate
2) Bullish Volatility set up on a daily timeframe:
In this example using SPY, when its Volatility is Bullish Trend on a daily timeframe, the price of SPY tends to depreciate
We hope that you will find these explanations useful, please contact us by private message for access.
Enjoy!
DISCLAIMER: No sharing, copying, reselling, modifying, or any other forms of use are authorised. This script is strictly for individual use and educational purposes only. This is not financial or investment advice. Investments are always made at your own risk and are based on your personal judgement. Myfractalrange is not responsible for any losses you may incur. Please invest wisely.

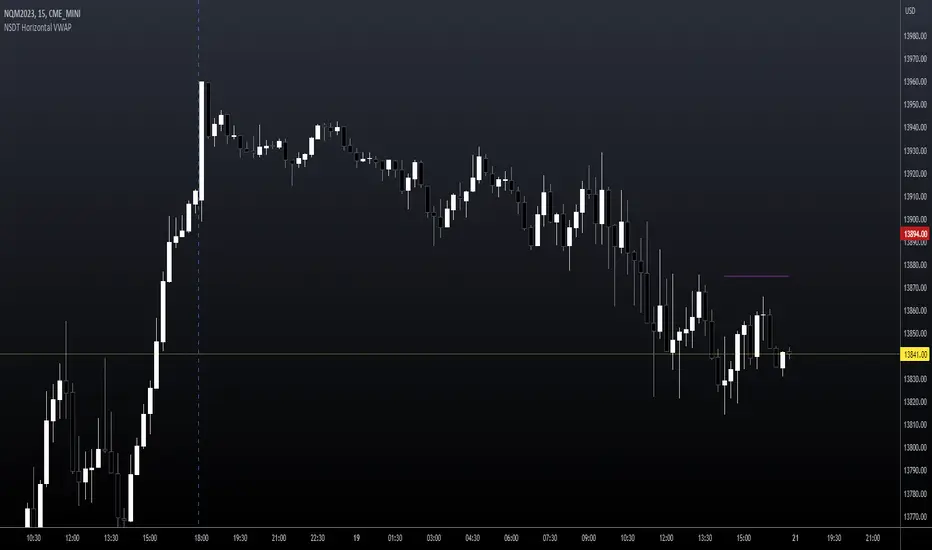
NSDT Horizontal VWAPThis script plots VWAP as a horizontal line starting at the most recent candle and extending backwards for a period of 10 to make it easier to see. (default is 10 but can be changed to fit your needs)
You may only want to see where VWAP is currently and not need to see the entire day. Helps keep the chart clean.
Colors and line settings can all be modified.
You can show the original VWAP plot as well for reference.
What Is the Volume-Weighted Average Price (VWAP)?
The volume-weighted average price (VWAP) is a technical analysis indicator used on intraday charts that resets at the start of every new trading session.
It's a trading benchmark that represents the average price a security has traded at throughout the day, based on both volume and price.
VWAP is important because it provides traders with pricing insight into both the trend and value of a security.
Cumulative TICK Trend[Pt]Cumulative TICK Trend indicator is a comprehensive trading tool that uses TICK data to define the market's cumulative trend. Trend is shown on ATR EMA bands, which is overlaid on the price chart. Cumulative TICK shown on the bottom pane is for reference only.
Main features of the Cumulative TICK Trend Indicator include:
Selectable TICK Source: You have the flexibility to choose your preferred TICK source from the following options, depending on the market you trade: USI:TICK, USI:TICKQ, USI:TICKI, and USI:TICKA.
TICK Data Type: Select the type of TICK data to use, options include: Close, Open, hl2, ohlc4, hlc3.
Simple Moving Average (SMA): You can choose to apply an SMA on the calculated Cumulative TICK values with a customizable length.
Average True Range (ATR) Bands: It provides the option to display ATR bands with adjustable settings. This includes the ATR period, EMA period, source for the ATR calculation, and the ATR multiplier for the upper band.
Trend Color Customization: You can customize the color of the bull and bear trends according to your preference.
Smooth Line Option: This setting allows you to smooth the ATR Bands with a customizable length.
How it Works:
This indicator accumulates TICK data during market hours (9:30-16:00) as per the New York time zone and resets at the start of a new session or the end of the regular session. This cumulative TICK value is then used to determine the trend.
The trend is defined as bullish if the SMA of cumulative TICK is equal to or greater than zero and bearish if it's less than zero. Additionally, this indicator plots the ATR bands, which can be used as volatility measures. The Upper ATR Band and Lower ATR Band can be made smoother using the SMA, according to the trader's preference.
The plot includes two parts for each trend: a stronger color (Red for bear, Green for bull) when the trend is ongoing, and a lighter color when the trend seems to be changing.
Remember, this tool is intended to be used as part of a comprehensive trading strategy. Always ensure you are managing risk appropriately and consulting various data sources to make informed trading decisions.

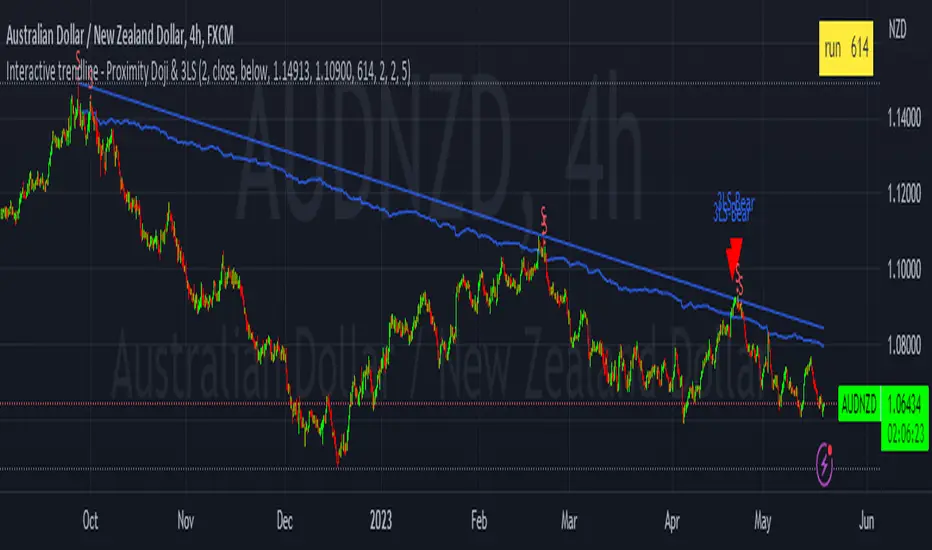
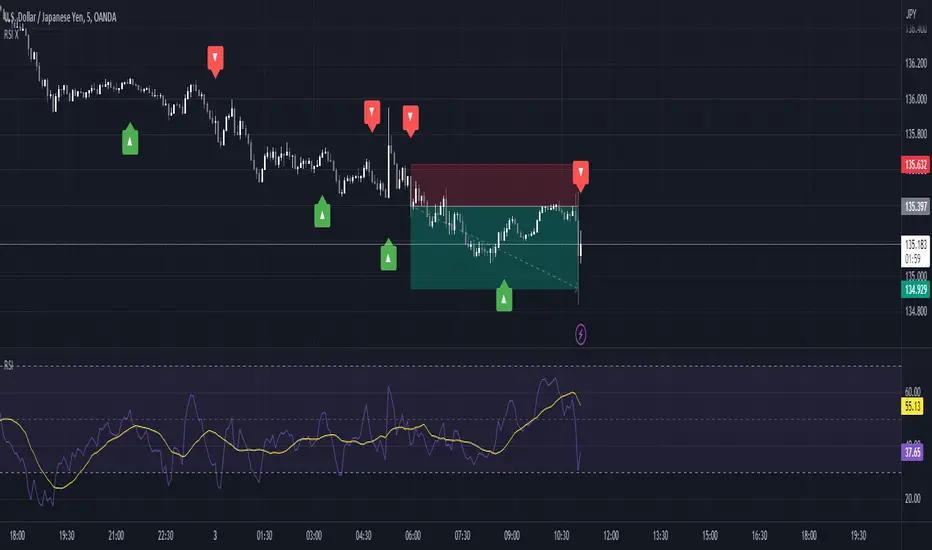
Interactive trendline - Proximity Doji & 3LSThis script was developed with Blockhead305 (seriously talented) and uses 1) the Three Line Strike from The Moving Average as well as 2) an original doji script written for me and 3) the Interactive Trendline as developed by Blockhead305. The basic premise is that should a doji or Three Line Strike occur within a customizable ATR distance from your trendline, an on-chart notification will appear or you could set an alarm to warn you if this has happened.
How to set this up:
Step 1 - Find a a trend
Step 2 - Identify the candles that touches the trendline
Step 3 - Click on the indicator
Step 4 - Set the X1 and Y1 coordinates for the start of the trend
Step 5 - Set the X2 and Y2 coordinates for the last relevant candle of the trend
Step 6 - Write the number in the yellow box down (in this case 880)
Step 7 - Open the settings of the indicator
Enter the number from the yellow box into the box titled "Run" - Press "OK"
Step 8 - Chart should/could now show Buy/Sell Signals for the Dojis and/or Bullish or Bearish Three Line Strikes
Notes
1. If your trendline is bearish (X1/Y1 is higher than X2/Y2) only bearish signals will appear and vice versa
2. You can change the ATR multiples from trendline in the settings - I prefer 2 (which is also the default)
3. You can toggle Big Engulfing and/or Three Line Strike on or off (exact functionality as per The Moving Average functionality)
4. You can construct the type of doji you would like to see at the bottom of the settings screen - I prefer the following settings:
Dominant Wick Multiple - 2
Recessive Wick Multiple - 2
Body Multiple - 5
5. I place my SL above last high (shorts) or last low (longs) but could also use the trendline for this
6. I use TP with RRR off 1:2 but much more is obviously possible.
7. ONLY ONE INTERACTIVE TRENDLINE CAN BE USED ON THE SAME CHART
8. THE NUMBER IN THE YELLOW BOX IS RELEVANT TO THE TIMEFRAME THAT THE TRENDLINE WAS CREATED ON. IF YOU CHANGE
TIMEFRAMES IT WILL NOT WORK
Happy to receive constructive criticism and/or suggestions for improvements on the settings.
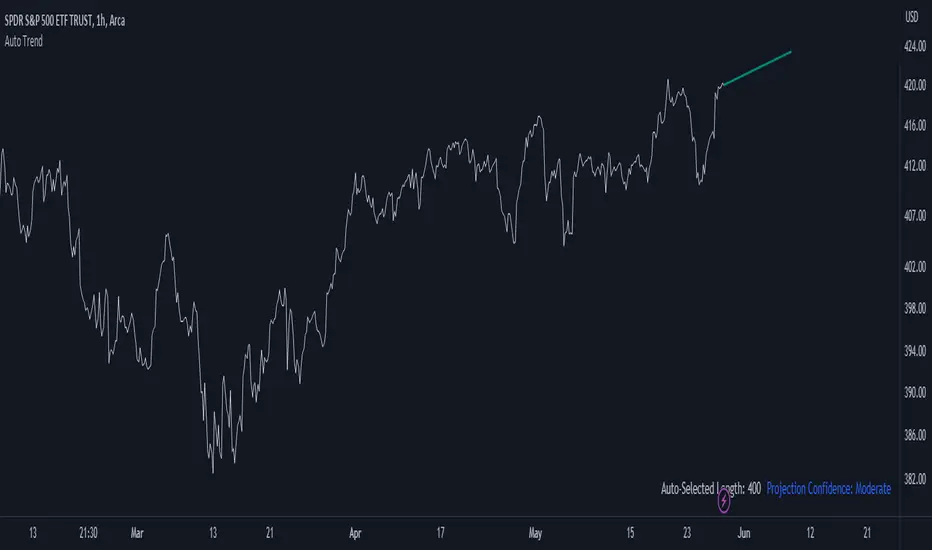
Auto Trend ProjectionAuto Trend Projection is an indicator designed to automatically project the short-term trend based on historical price data. It utilizes a dynamic calculation method to determine the slope of the linear regression line, which represents the trend direction. The indicator takes into account multiple length inputs and calculates the deviation and Pearson's R values for each length.
Using the highest Pearson's R value, Auto Trend Projection identifies the optimal length for the trend projection. This ensures that the projected trend aligns closely with the historical price data.
The indicator visually displays the projected trend using trendlines. These trendlines extend into the future, providing a visual representation of the potential price movement in the short term. The color and style of the trendlines can be customized according to user preferences.
Auto Trend Projection simplifies the process of trend analysis by automating the projection of short-term trends. Traders and investors can use this indicator to gain insights into potential price movements and make informed trading decisions.
Please note that Auto Trend Projection is not a standalone trading strategy but a tool to assist in trend analysis. It is recommended to combine it with other technical analysis tools and indicators for comprehensive market analysis.
Overall, Auto Trend Projection offers a convenient and automated approach to projecting short-term trends, empowering traders with valuable insights into the potential price direction.
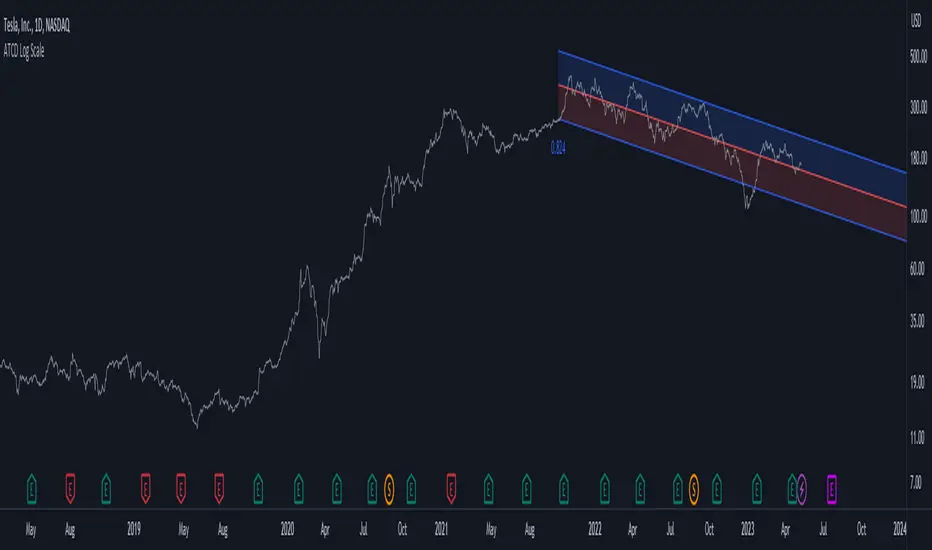
Strongest TrendlineUnleashing the Power of Trendlines with the "Strongest Trendline" Indicator.
Trendlines are an invaluable tool in technical analysis, providing traders with insights into price movements and market trends. The "Strongest Trendline" indicator offers a powerful approach to identifying robust trendlines based on various parameters and technical analysis metrics.
When using the "Strongest Trendline" indicator, it is recommended to utilize a logarithmic scale . This scale accurately represents percentage changes in price, allowing for a more comprehensive visualization of trends. Logarithmic scales highlight the proportional relationship between prices, ensuring that both large and small price movements are given due consideration.
One of the notable advantages of logarithmic scales is their ability to balance price movements on a chart. This prevents larger price changes from dominating the visual representation, providing a more balanced perspective on the overall trend. Logarithmic scales are particularly useful when analyzing assets with significant price fluctuations.
In some cases, traders may need to scroll back on the chart to view the trendlines generated by the "Strongest Trendline" indicator. By scrolling back, traders ensure they have a sufficient historical context to accurately assess the strength and reliability of the trendline. This comprehensive analysis allows for the identification of trendline patterns and correlations between historical price movements and current market conditions.
The "Strongest Trendline" indicator calculates trendlines based on historical data, requiring an adequate number of data points to identify the strongest trend. By scrolling back and considering historical patterns, traders can make more informed trading decisions and identify potential entry or exit points.
When using the "Strongest Trendline" indicator, a higher Pearson's R value signifies a stronger trendline. The closer the Pearson's R value is to 1, the more reliable and robust the trendline is considered to be.
In conclusion, the "Strongest Trendline" indicator offers traders a robust method for identifying trendlines with significant predictive power. By utilizing a logarithmic scale and considering historical data, traders can unleash the full potential of this indicator and gain valuable insights into price trends. Trendlines, when used in conjunction with other technical analysis tools, can help traders make more informed decisions in the dynamic world of financial markets.

Volatility Adjusted ADX (VADX)I sincerely wish to express my heartfelt gratitude to the vast community of coders on TradingView who have previously crafted various Average Directional Index (ADX) scripts. Their innovative approaches have laid a solid foundation, and I'm incredibly grateful for their inspiring work. In essence, their accomplishments have ignited the creative spark that led to the development of the Volatility Adjusted ADX (VADX) script.
VADX is not your run-of-the-mill script. It distinguishes itself from the myriad of ADX indicators on TradingView due to its unique volatility-adjustment mechanism. The primary purpose of this script is to augment the ADX's ability to quantify trend strength by introducing a layer of sensitivity to volatility shifts through the Average True Range (ATR). The interaction between these two crucial market measurements is where the novelty lies.
While the standard ADX does an excellent job of diagnosing the trend's vigor, its evaluation can sometimes be skewed when markets oscillate between periods of high and low volatility. Integrating the ATR – a reliable indicator of market volatility – into the ADX calculation mitigates this limitation, resulting in a more robust, volatility-adjusted trend strength measurement.
The specifics of the mathematical adjustment, our secret ingredient, will remain undisclosed for proprietary reasons. Nevertheless, I assure you that it creates a dynamic and balanced interplay between the trend strength and volatility, enabling a more nuanced understanding of the market.
The VADX script is user-friendly and includes three main inputs: ADX Smoothing, DI Length, and ATR Length. The ADX Smoothing parameter refines the ADX calculation, DI Length determines the period for the Directional Movement System calculation, and the ATR Length sets the period for the Average True Range.
Using this indicator is as easy as pie. After adding it to your chart, VADX will manifest itself as a separate panel beneath your price chart. When the VADX is escalating, it indicates that the strength of the trend is intensifying. Conversely, a declining VADX suggests diminishing trend strength. Two horizontal lines at the 25 and 75 levels provide a simple interpretation guide – they denote weak and strong trend phases, respectively.
This robust indicator is adaptable and can be effectively applied across multiple markets - from stocks, forex, and futures to cryptocurrencies. It also delivers valuable insights on any timeframe. However, as with any new indicator, I highly recommend initial testing and optimization to match your unique trading style and objectives.
To wrap up, the VADX indicator sets itself apart with its novel volatility adjustment, a feature not commonly found in existing TradingView scripts. This distinctive capability affords traders a more comprehensive view of the trend's strength by accounting for market volatility, adding an extra layer of depth to traditional ADX interpretation. I sincerely hope that this script enriches your trading arsenal and assists you in navigating the market with enhanced precision. As always, happy trading!

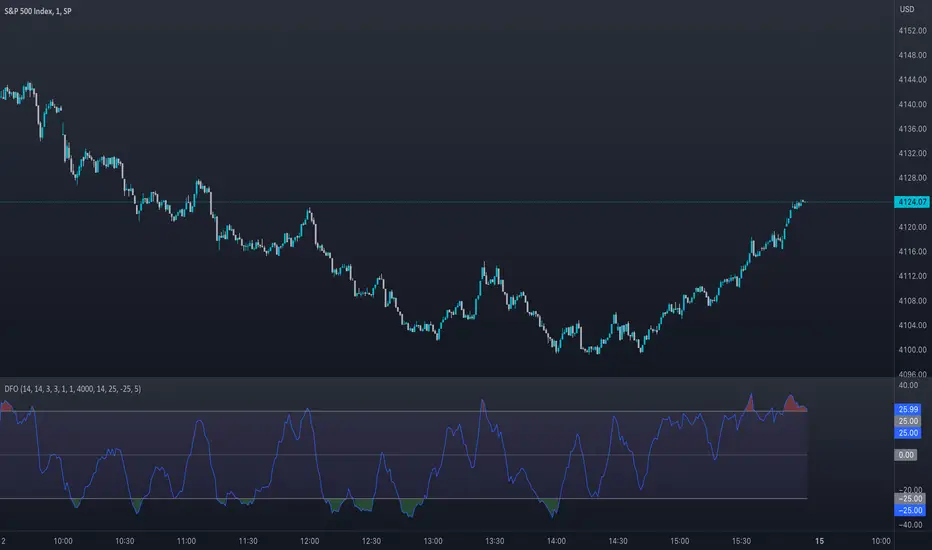
Dynamic Fusion Oscillator (DFO)The Dynamic Fusion Oscillator (DFO) is a uniquely crafted trading indicator that amalgamates the power of the Relative Strength Index (RSI) and the Stochastic Oscillator into a single, comprehensive tool. It provides traders with a more nuanced analysis of market momentum and overbought or oversold conditions. The DFO's distinctiveness lies in its ability to leverage the strengths of both RSI and Stochastic Oscillator, offering a more robust reading of market conditions. Moreover, it does so by offering a weighted approach, which combines the standardized values of both indicators. This flexibility in adjusting the weight of each component enhances its adaptability to different market scenarios, making it a versatile tool in a trader's arsenal. The following sections will delve into the intricacies of the DFO, demonstrating its advantages, usage, and applicability across various market conditions.
Differences from Existing Scripts:
The Dynamic Fusion Oscillator (DFO) is unique from other trading indicators as it combines the strengths of two popular technical analysis tools: the Relative Strength Index (RSI) and the Stochastic Oscillator. This fusion results in a dynamic, weighted oscillator that provides a more comprehensive view of the market's momentum and overbought or oversold conditions.
Usage and Market Conditions:
DFO can be used across different markets, including stocks, forex, commodities, and cryptocurrencies. It is designed to perform well in varying market conditions - trending or ranging. However, like any other technical indicator, it is advised to use it in conjunction with other technical analysis tools and not rely solely on it for making trading decisions.
Importance of Combining RSI and Stochastic Oscillator:
The RSI and Stochastic Oscillator are both momentum indicators, but they have their individual strengths and weaknesses. The RSI excels at identifying overbought and oversold conditions, while the Stochastic Oscillator is adept at predicting price reversals. By combining these two into a single oscillator, we can benefit from the strengths of both while minimizing their weaknesses. This fusion results in a more robust indicator that offers better signal quality and reliability.
Input Explanations:
RSI Length : This determines the number of periods used to calculate the RSI. A smaller value will make the RSI more sensitive to price changes, while a larger value will smooth out the RSI line.
Stochastic Length, Smooth K, Smooth D : These are parameters for calculating the Stochastic Oscillator. Length is the observation period, Smooth K is the smoothing factor for the %K line, and Smooth D is the smoothing factor for the %D line.
RSI Weight, Stochastic Weight : These determine the weights of the RSI and the Stochastic Oscillator in the final calculation. Increasing the weight of one will make the oscillator more sensitive to that component.
Standardization Length : This is the number of periods used to calculate the moving average and standard deviation for standardization purposes.
MA Length : This determines the number of periods used to calculate the moving average of the oscillator.
Upper Band Value, Lower Band Value : These set the maximum and minimum values for the oscillator. Signals are generated when the oscillator crosses these thresholds.
Number of periods above the band for alert condition : This sets the number of periods the oscillator stays above the band to trigger an alert.
Alert Conditions:
Alerts are generated under the following conditions:
Bullish Signal : An alert is generated when the Moving Average (MA) crosses above the Oscillator. This can be seen as a potential bullish signal indicating an upward price trend.
Bearish Signal : An alert is generated when the MA crosses below the Oscillator. This can be seen as a potential bearish signal indicating a downward price trend.
Oscillator above/below upper/lower band : Alerts are also generated when the oscillator has been above the upper band or below the lower band for a specified number of periods. This could signal overbought or oversold conditions, respectively. These signals can help traders identify potential reversal points in the market.
These alerts can help traders by providing timely signals for potential trading opportunities. However, they should be used as part of a comprehensive trading strategy that also takes into account other technical and fundamental factors.
Ultimate Trend LineThe "Ultimate Trend Line" indicator, designed for overlay on financial charts, calculates and plots a global trend line. It works by first allowing users to input several parameters such as different lengths for up to 21 groups, a multiplier that defines the deviation from the linear regression line for calculating the upper and lower bands, and a color for the fill.
Using these inputs, it calculates the upper and lower bands for each length group based on a multiple of the standard deviation from the linear regression line. It then averages these bands to define the global trend line, which is plotted on the graph.
Although the code includes commented-out lines for plotting each individual upper and lower band, the indicator as it stands only displays the overall average trend line. The line's color and linewidth can be adjusted according to user preferences.
This indicator can be effectively used on both logarithmic and linear scales. This versatility allows it to be adaptable to various types of financial charts and trading styles, providing a flexible tool for users to assess and visualize trend patterns across different market conditions and time frames. It maintains its accuracy and relevance, regardless of the scale used, thus making it a comprehensive solution for trend line analysis in diverse scenarios.
It's important to note that the "Ultimate Trend Line" indicator requires a substantial amount of historical data to function properly. If insufficient historical data is available, the indicator may not display accurately or at all. This issue is particularly prevalent when using larger time units, such as weekly or monthly charts, where the available data may not stretch back far enough to satisfy the requirements of the indicator. As such, users should ensure they are operating on a time scale and data set that provides adequate historical depth for the reliable operation of this indicator.

Advanced Trend Channel Detection (Log Scale)The Advanced Trend Channel Detection (Log Scale) indicator is designed to identify the strongest trend channels using logarithmic scaling. It does this by calculating the highest Pearson's R value among all length inputs and then determining which length input to use for the selected slope, average, and intercept. The script then draws the upper and lower deviation lines on the chart based on the selected slope, average, and intercept, and optionally displays the Pearson's R value.
To use this indicator, you will need to switch to logarithmic scale. There are several advantages to using logarithmic scale over regular scale. Firstly, logarithmic scale provides a better visualization of data that spans multiple orders of magnitude by compressing large ranges of values into a smaller space. Secondly, logarithmic scale can help to minimize the impact of outliers, making it easier to identify patterns and trends in the data. Finally, logarithmic scale is often utilized in scientific contexts as it can reveal relationships between variables that may not be visible on a linear scale.
If the trend channel does not appear on the chart, it may be necessary to scroll back to view historical data. The indicator uses past price data to calculate the trend channel, so if there is not enough historical data visible on the chart, the indicator may not be able to identify the trend channel. In this case, the user should adjust the chart's timeframe or zoom out to view more historical data. Additionally, the indicator may need to be recalibrated if there is a significant shift in market conditions or if the selected length input is no longer appropriate.
Artharjan Daily Weekly Price Trend IndicatorHi,
Artharjan Daily Weekly Price Trend Indicator is created to identify whether the current market price is with respect to previous Daily High and Low as well as Previous Weekly High and Low
If the price is above previous Day High a Green Square is plotted above the Candle, if the Price is inside the Previous Day Range then a Gray Square is Plotted above the Candle, and if the Price is below the previous day low then a Red Square is plotted above the candle.
Similarly If the price is above previous Week's High a Green Circle is plotted below the Candle, if the Price is inside the Previous Week's Range then a Gray Circle is Plotted below the Candle, and if the Price is below the previous Week's low then a Red Circle is plotted below the candle.
The idea here is to identify the trend, trend changes (Reversals) and initiate either a long or short positing purely based on price action.
For illustration purpose, If suppose you have entered the trade when you see a Green Square above and a Green Circle Below, hold on to the trade as long as the Green circle below does not turn into a Red Circle. It means the Weekly trend is Bullish and Daily trend may change more frequently, but you may hold on to your position unless and until the weekly Trend changes.
Also if may help to Book your profits in a timely manner, lets say you are in a long trade and you keep seeing Green Square at the top of the candle, the moment you see a Gray or a red Square at the top you may exit your long position. Obviously trader needs to use his brains to enter a position at right location on the chart and ride that position using this indicator.
I hope everyone would find this simple indicator very useful.
Regards
Rahul Desai
@Artharjan

SuperBollingerTrend (Expo)█ Overview
The SuperBollingerTrend indicator is a combination of two popular technical analysis tools, Bollinger Bands, and SuperTrend. By fusing these two indicators, SuperBollingerTrend aims to provide traders with a more comprehensive view of the market, accounting for both volatility and trend direction. By combining trend identification with volatility analysis, the SuperBollingerTrend indicator provides traders with valuable insights into potential trend changes. It recognizes that high volatility levels often accompany stronger price momentum, which can result in the formation of new trends or the continuation of existing ones.
█ How Volatility Impacts Trends
Volatility can impact trends by expanding or contracting them, triggering trend reversals, leading to breakouts, and influencing risk management decisions. Traders need to analyze and monitor volatility levels in conjunction with trend analysis to gain a comprehensive understanding of market dynamics.
█ How to use
Trend Reversals: High volatility can result in more dramatic price fluctuations, which may lead to sharp trend reversals. For example, a sudden increase in volatility can cause a bullish trend to transition into a bearish one, or vice versa, as traders react to significant price swings.
Volatility Breakouts: Volatility can trigger breakouts in trends. Breakouts occur when the price breaks through a significant support or resistance level, indicating a potential shift in the trend. Higher volatility levels can increase the likelihood of breakouts, as they indicate stronger market momentum and increased buying or selling pressure. This indicator triggers when the volatility increases, and if the price is near a key level when the indicator alerts, it might trigger a great trend.
█ Features
Peak Signal Move
The indicator calculates the peak price move for each ZigZag and displays it under each signal. This highlights how much the market moved between the signals.
Average ZigZag Move
All price moves between two signals are stored, and the average or the median is calculated and displayed in a table. This gives traders a great idea of how much the market moves on average between two signals.
Take Profit
The Take Profit line is placed at the average or the median price move and gives traders a great idea of what they can expect in average profit from the latest signals.
-----------------
Disclaimer
The information contained in my Scripts/Indicators/Ideas/Algos/Systems does not constitute financial advice or a solicitation to buy or sell any securities of any type. I will not accept liability for any loss or damage, including without limitation any loss of profit, which may arise directly or indirectly from the use of or reliance on such information.
All investments involve risk, and the past performance of a security, industry, sector, market, financial product, trading strategy, backtest, or individual's trading does not guarantee future results or returns. Investors are fully responsible for any investment decisions they make. Such decisions should be based solely on an evaluation of their financial circumstances, investment objectives, risk tolerance, and liquidity needs.
My Scripts/Indicators/Ideas/Algos/Systems are only for educational purposes!

RSI Trending with DivergencesThis script uses the RSI and RSI divergences to mark signals where the rsi is both below/above the 50, below/above its moving average, and where the last regular or hidden divergence matches that state. The RSI is built into the indicator, so you don't need it in your bottom pane if you don't want it, I just put one there for illustrative purposes. Please note it will not print the same signal consecutively, as it is meant to show an overall direction, not the in and out fluctuations. I suggest using it in conjunction with some moving averages so you can ignore signals not in the trend.
Trend Reversal Probability CalculatorThe "Trend Reversal Probability Calculator" is a TradingView indicator that calculates the probability of a trend reversal based on the crossover of multiple moving averages and the rate of change (ROC) of their slopes. This indicator is designed to help traders identify potential trend reversals by providing signals when the short-term moving averages start to slope in the opposite direction of the long-term moving average.
To use the indicator, simply add it to your TradingView chart and adjust the input parameters according to your preferences. The input parameters include the length of the moving averages, the ROC length (trend sensitivity), and the reversal sensitivity (signal percentage).
The indicator calculates the ROC of the moving averages and determines if the short-term moving averages are sloping in the opposite direction of the long-term moving average. The number of short-term moving averages that meet this condition is then counted, and the probability of a trend reversal is calculated based on the percentage of short-term moving averages that meet this condition.
When the probability of a trend reversal is high, a bullish or bearish signal is generated, depending on the direction of the reversal. The bullish signal is generated when the short-term moving averages start to slope upward, and the bearish signal is generated when the short-term moving averages start to slope downward.
Traders can use the "Trend Reversal Probability Calculator" to identify potential trend reversals and adjust their trading strategies accordingly. It is important to note that this indicator is not a guarantee of a trend reversal and should be used in conjunction with other technical analysis tools to make informed trading decisions.

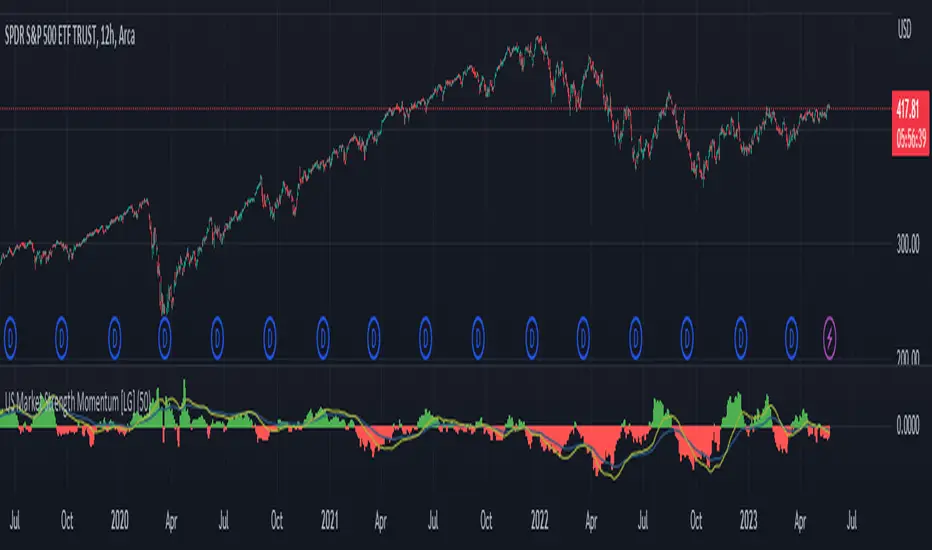
US Market Strength Momentum [LG]This indicator is designed to analyze the relative strength momentum of two US market indices, the Russell 2000 and S&P 500, by calculating their rate of change over a 21-bar period and comparing them. The difference between the average rate of change for IWM and SPY is then plotted as a histogram, with green bars indicating positive momentum and red bars indicating negative momentum.
The indicator also includes a moving average line, calculated over a 200-bar period, which is plotted on top of the histogram. This moving average helps to smooth out the data and provide a clearer picture of the longer-term trend.
In this indicator, the strength of the Russell 2000 compared to S&P 500 is seen as a gauge of market participants' risk tolerance. When Russell outperforms the S&P, market participants are assumed to be taking on greater risk in search of greater beta. When the S&P outperforms Russell, the assumption is that market participants are fleeing to safer assets (in regards to equities indices). The time frame the indicator is viewed on as well as the size of the rate of change delta dictates the strength of the trend.
SuperTrend with Chebyshev FilterModified Super Trend with Chebyshev Filter
The Modified Super Trend is an innovative take on the classic Super Trend indicator. This advanced version incorporates a Chebyshev filter, which significantly enhances its capabilities by reducing false signals and improving overall signal quality. In this post, we'll dive deep into the Modified Super Trend, exploring its history, the benefits of the Chebyshev filter, and how it effectively addresses the challenges associated with smoothing, delay, and noise.
History of the Super Trend
The Super Trend indicator, developed by Olivier Seban, has been a popular tool among traders since its inception. It helps traders identify market trends and potential entry and exit points. The Super Trend uses average true range (ATR) and a multiplier to create a volatility-based trailing stop, providing traders with a dynamic tool that adapts to changing market conditions. However, the original Super Trend has its limitations, such as the tendency to produce false signals during periods of low volatility or sideways trading.
The Chebyshev Filter
The Chebyshev filter is a powerful mathematical tool that makes an excellent addition to the Super Trend indicator. It effectively addresses the issues of smoothing, delay, and noise associated with traditional moving averages. Chebyshev filters are named after Pafnuty Chebyshev, a renowned Russian mathematician who made significant contributions to the field of approximation theory.
The Chebyshev filter is capable of producing smoother, more responsive moving averages without introducing additional lag. This is possible because the filter minimizes the worst-case error between the ideal and the actual frequency response. There are two types of Chebyshev filters: Type I and Type II. Type I Chebyshev filters are designed to have an equiripple response in the passband, while Type II Chebyshev filters have an equiripple response in the stopband. The Modified Super Trend allows users to choose between these two types based on their preferences.
Overcoming the Challenges
The Modified Super Trend addresses several challenges associated with the original Super Trend:
Smoothing: The Chebyshev filter produces a smoother moving average without introducing additional lag. This feature is particularly beneficial during periods of low volatility or sideways trading, as it reduces the number of false signals.
Delay: The Chebyshev filter helps minimize the delay between price action and the generated signal, allowing traders to make timely decisions based on more accurate information.
Noise Reduction: The Chebyshev filter's ability to minimize the worst-case error between the ideal and actual frequency response reduces the impact of noise on the generated signals. This feature is especially useful when using the true range as an offset for the price, as it helps generate more reliable signals within a reasonable time frame.
The Great Replacement
The Modified Super Trend with Chebyshev filter is an excellent replacement for the original Super Trend indicator. It offers significant improvements in terms of signal quality, responsiveness, and accuracy. By incorporating the Chebyshev filter, the Modified Super Trend effectively reduces the number of false signals during low volatility or sideways trading, making it a more reliable tool for identifying market trends and potential entry and exit points.
In-Depth Guide to the Modified Super Trend Settings
The Modified Super Trend with Chebyshev filter offers a wide range of settings that allow traders to fine-tune the indicator to suit their specific trading styles and objectives. In this section, we will discuss each setting in detail, explaining its purpose and how to use it effectively.
Source
The source setting determines the price data used for calculations. The default setting is hl2, which calculates the average of the high and low prices. You can choose other price data sources such as close, open, or ohlc4 (average of open, high, low, and close prices) based on your preference.
Up Color and Down Color
These settings control the color of the trend line when the market is in an uptrend (up_color) and a downtrend (down_color). You can customize these colors to your liking, making it easier to visually identify the current market trend.
Text Color
This setting controls the color of the text displayed on the chart when using labels to indicate trend changes. You can choose any color that contrasts well with your chart background for better readability.
Mean Length
The mean_length setting determines the length (number of bars) used for the Chebyshev moving average calculation. A shorter length will make the moving average more responsive to price changes, while a longer length will produce a smoother moving average. It is crucial to find the right balance between responsiveness and smoothness, as a too-short length may generate false signals, while a too-long length might produce lagging signals. The default value is 64, but you can experiment with different values to find the optimal setting for your trading strategy.
Mean Ripple
The mean_ripple setting influences the Chebyshev filter's ripple effect in the passband (Type I) or stopband (Type II). The ripple effect represents small oscillations in the frequency response, which can impact the moving average's smoothness. The default value is 0.01, but you can experiment with different values to find the best balance between smoothness and responsiveness.
Chebyshev Type: Type I or Type II
The style setting allows you to choose between Type I and Type II Chebyshev filters. Type I filters have an equiripple response in the passband, while Type II filters have an equiripple response in the stopband. Depending on your preference for smoothness and responsiveness, you can choose the type that best fits your trading style.
ATR Style
The atr_style setting determines the method used for calculating the Average True Range (ATR). By default (false), it uses the traditional high-low range. When set to true, it uses the absolute difference between the open and close prices. You can choose the method that works best for your trading strategy and the market you are trading.
ATR Length
The atr_length setting controls the length (number of bars) used for calculating the ATR. Similar to the mean_length, a shorter length will make the ATR more responsive to price changes, while a longer length will produce a smoother ATR. The default value is 64, but you can experiment with different values to find the optimal setting for your trading strategy.
ATR Ripple
The atr_ripple setting, like the mean_ripple, influences the ripple effect of the Chebyshev filter used in the ATR calculation. The default value is 0.05, but you can experiment with different values to find the best balance between smoothness and responsiveness.
Multiplier
The multiplier setting determines the factor by which the ATR is multiplied before being added
Super Trend Logic and Signal Optimization
The Modified Super Trend with Chebyshev filter is designed to minimize false signals and provide a clear indication of market trends. It does so by using a combination of moving averages, Average True Range (ATR), and a multiplier. In this section, we will discuss the Super Trend's logic, its ability to prevent false signals, and the early warning crosses added to the indicator.
Super Trend Logic
The Super Trend's logic is based on a combination of the Chebyshev moving average and ATR. The Chebyshev moving average is a smooth moving average that effectively filters out market noise, while the ATR is a measure of market volatility.
The Super Trend is calculated by adding or subtracting a multiple of the ATR from the Chebyshev moving average. The multiplier is a user-defined value that determines the distance between the trend line and the price action. A larger multiplier results in a wider channel, reducing the likelihood of false signals but potentially missing out on valid trend changes.
Preventing False Signals
The Super Trend is designed to minimize false signals by maintaining its trend direction until a significant change in the market occurs. In a downtrend, the trend line will only decrease in value, and in an uptrend, it will only increase. This helps prevent false signals caused by temporary price fluctuations or market noise.
When the price crosses the trend line, the Super Trend does not immediately change its direction. Instead, it employs a safety logic to ensure that the trend change is genuine. The safety logic checks if the new trend line (calculated using the updated moving average and ATR) is more extreme than the previous one. If it is, the trend line is updated; otherwise, the previous trend line is maintained. This mechanism further reduces the likelihood of false signals by ensuring that the trend line only changes when there is a significant shift in the market.
Early Warning Crosses
To provide traders with additional insight, the Modified Super Trend with Chebyshev filter includes early warning crosses. These crosses are plotted on the chart when the price crosses the trend line without the safety logic. Although these crosses do not necessarily indicate a trend change, they can serve as a valuable heads-up for traders to monitor the market closely and prepare for potential trend reversals.
In conclusion, the Modified Super Trend with Chebyshev filter offers a significant improvement over the original Super Trend indicator. By incorporating the Chebyshev filter, this modified version effectively addresses the challenges of smoothing, delay, and noise reduction while minimizing false signals. The wide range of customizable settings allows traders to tailor the indicator to their specific needs, while the inclusion of early warning crosses provides valuable insight into potential trend reversals.
Ultimately, the Modified Super Trend with Chebyshev filter is an excellent tool for traders looking to enhance their trend identification and decision-making abilities. With its advanced features, this indicator can help traders navigate volatile markets with confidence, making more informed decisions based on accurate, timely information.

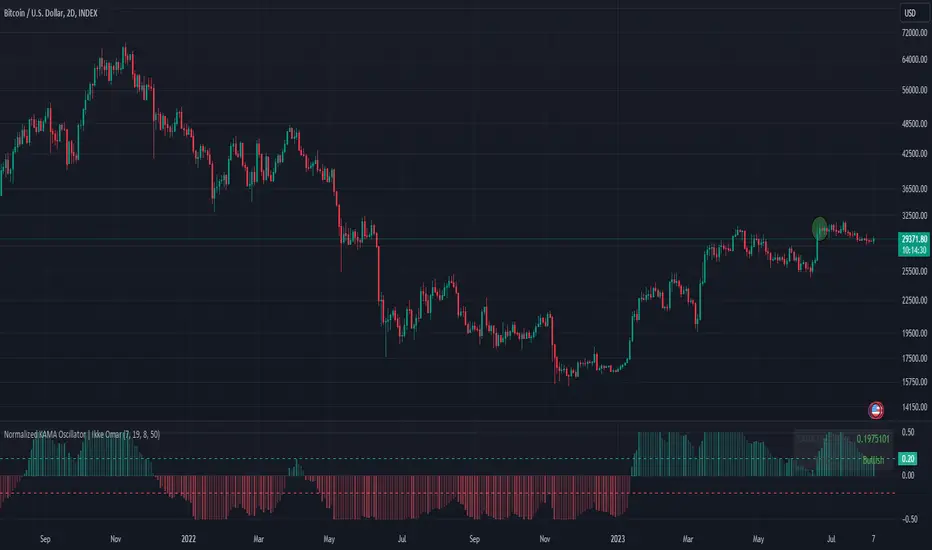
Normalized KAMA Oscillator | Ikke OmarThis indicator demonstrates the creation of a normalized KAMA (Kaufman Adaptive Moving Average) oscillator with a table display. I will explain how the code works, providing a step-by-step breakdown. This is personally made by me:)
Input Parameters:
fast_period and slow_period: Define the periods for calculating the KAMA.
er_period: Specifies the period for calculating the Efficiency Ratio.
norm_period: Determines the lookback period for normalizing the oscillator.
Efficiency Ratio (ER) Calculation:
Measures the efficiency of price changes over a specified period.
Calculated as the ratio of the absolute price change to the total price volatility.
Smoothing Constant Calculation:
Determines the smoothing constant (sc) based on the Efficiency Ratio (ER) and the fast and slow periods.
The formula accounts for the different periods to calculate an appropriate smoothing factor.
KAMA Calculation:
Uses the Exponential Moving Average (EMA) and the smoothing constant to compute the KAMA.
Combines the fast EMA and the adjusted price change to adapt to market conditions.
Oscillator Normalization:
Normalizes the oscillator values to a range between -0.5 and 0.5 for better visualization and comparison.
Determines the highest and lowest values of the KAMA within the specified normalization period.
Transforms the KAMA values into a normalized range.
By incorporating the Efficiency Ratio, smoothing constant, and normalization techniques, the indicator actually allows for the identification of trends on different timeframes, even in extreme market conditions.
The normalization makes it much more adaptive than if you were to just use a normal KAMA line. This way you actually get a lot more data by looking at the histogram, rather than just the KAMA line.
I essentially made the KAMA into an oscillator! Please ask if you want me to code another indicator
I hope you enjoyed this.
Please ask if you have any questions<3
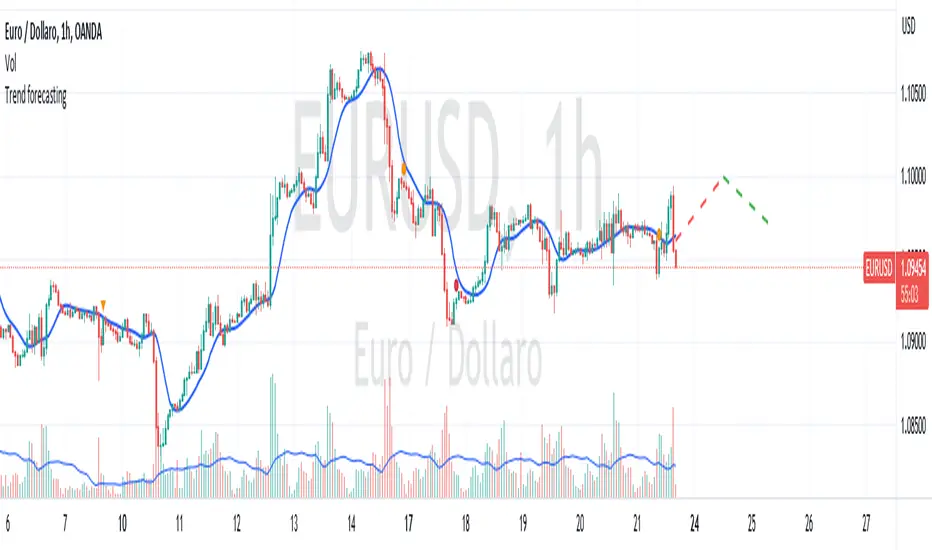
Trend forecasting by c00l75----------- ITALIANO -----------
Questo codice è uno script di previsione del trend creato solo a scopo didattico. Utilizza una media mobile esponenziale (EMA) e una media mobile di Hull (HMA) per calcolare il trend attuale e prevedere il trend futuro. Il codice utilizza anche una regressione lineare per calcolare il trend attuale e un fattore di smorzamento per regolare l’effetto della regressione lineare sulla previsione del trend. Infine il codice disegna due linee tratteggiate per mostrare la previsione del trend per i periodi futuri specificati dall’utente. Se ti piace l'idea mettimi un boost e lascia un commento!
----------- ENGLISH -----------
This code is a trend forecasting script created for educational purposes only. It uses an exponential moving average (EMA) and a Hull moving average (HMA) to calculate the current trend and forecast the future trend. The code also uses a linear regression to calculate the current trend and a damping factor to adjust the effect of the linear regression on the trend prediction. Finally, the code draws two dashed lines to show the trend prediction for future periods specified by the user. If you like the idea please put a boost and leave a comment!
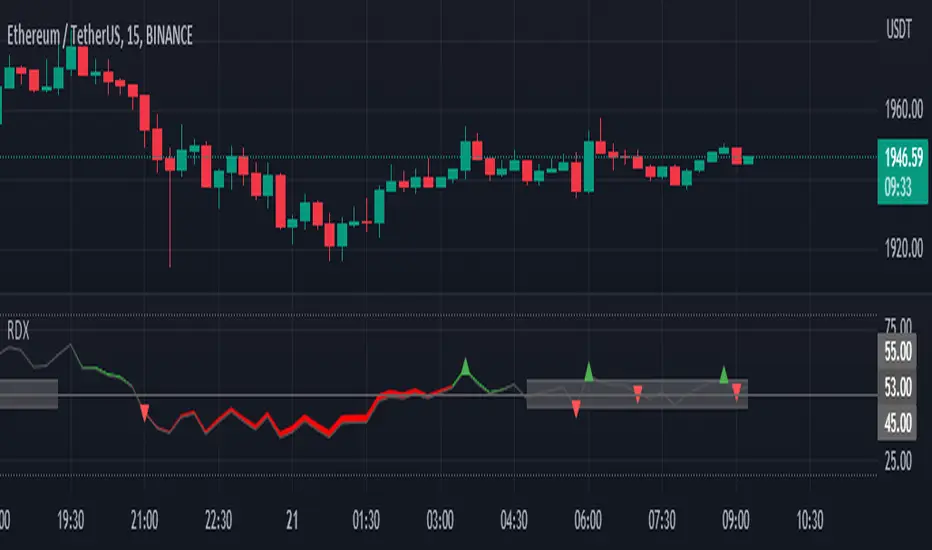
RDX Relative Directional IndexRDX Relative Directional Index, Strength + Direction + Trend. This indicator is the combination of RSI and DMI or ADX. RDX aims at providing Relative direction of the price along with strength of the trend. This acts as both RSI and Average Directional Index. as the strength grows the RSI line becomes wider and when there is high volatility and market fluctuation the line becomes thinner. Color decides the Direction. This indicator provides sideways detection of RSI signal.
RDX Width: This determines the strength of RSI and Strength of ADX, The strength grows RDX band grows wider, as strength decreases band shrinks and merge into the RSI line. for exact working simply disable RSI plot on the indicator. when there is no strength the RSI vanishes..
Technical:
RSI : with default 14 period
ADX : Default 14 period
RDX=RSI+(ADX-20)/5
Color Code:
Red: Down Direction
Green: Up Direction
Sideways:
A rectangular channel is plotted on RSI 50 Level
Oversold Overbought:
Oversold and Overbought Levels are plotted for normal RSI Oversold and Overbought detection.
Buy/Sell:
Buy sell signals from ADX crossover are plotted and its easy to determine
Strength + Direction + Trend in one go
Hope the community likes this...
Contibute for more ideas and indicators..