Liquidity Sweep Filter Strategy [AlgoAlpha X PineIndicators]This strategy is based on the Liquidity Sweep Filter developed by AlgoAlpha. Full credit for the concept and original indicator goes to AlgoAlpha.
The Liquidity Sweep Filter Strategy is a non-repainting trading system designed to identify liquidity sweeps, trend shifts, and high-impact price levels. It incorporates volume-based liquidation analysis, trend confirmation, and dynamic support/resistance detection to optimize trade entries and exits.
This strategy helps traders:
Detect liquidity sweeps where major market participants trigger stop losses and liquidations.
Identify trend shifts using a volatility-based moving average system.
Analyze volume distribution with a built-in volume profile visualization.
Filter noise by differentiating between major and minor liquidity sweeps.
How the Liquidity Sweep Filter Strategy Works
1. Trend Detection Using Volatility-Based Filtering
The strategy applies a volatility-adjusted moving average system to determine trend direction:
A central trend line is calculated using an EMA smoothed over a user-defined length.
Upper and lower deviation bands are created based on the average price deviation over multiple periods.
If price closes above the upper band, the strategy signals an uptrend.
If price closes below the lower band, the strategy signals a downtrend.
This approach ensures that trend shifts are confirmed only when price significantly moves beyond normal market fluctuations.
2. Liquidity Sweep Detection
Liquidity sweeps occur when price temporarily breaks key levels, triggering stop-loss liquidations or margin call events. The strategy tracks swing highs and lows, marking potential liquidity grabs:
Bearish Liquidity Sweeps – Price breaks a recent high, then reverses downward.
Bullish Liquidity Sweeps – Price breaks a recent low, then reverses upward.
Volume Integration – The strategy analyzes trading volume at each sweep to differentiate between major and minor sweeps.
Key levels where liquidity sweeps occur are plotted as color-coded horizontal lines:
Red lines indicate bearish liquidity sweeps.
Green lines indicate bullish liquidity sweeps.
Labels are displayed at each sweep, showing the volume of liquidated positions at that level.
3. Volume Profile Analysis
The strategy includes an optional volume profile visualization, displaying how trading volume is distributed across different price levels.
Features of the volume profile:
Point of Control (POC) – The price level with the highest traded volume is marked as a key area of interest.
Bounding Box – The profile is enclosed within a transparent box, helping traders visualize the price range of high trading activity.
Customizable Resolution & Scale – Traders can adjust the granularity of the profile to match their preferred time frame.
The volume profile helps identify zones of strong support and resistance, making it easier to anticipate price reactions at key levels.
Trade Entry & Exit Conditions
The strategy allows traders to configure trade direction:
Long Only – Only takes long trades.
Short Only – Only takes short trades.
Long & Short – Trades in both directions.
Entry Conditions
Long Entry:
A bullish trend shift is confirmed.
A bullish liquidity sweep occurs (price sweeps below a key level and reverses).
The trade direction setting allows long trades.
Short Entry:
A bearish trend shift is confirmed.
A bearish liquidity sweep occurs (price sweeps above a key level and reverses).
The trade direction setting allows short trades.
Exit Conditions
Closing a Long Position:
A bearish trend shift occurs.
The position is liquidated at a predefined liquidity sweep level.
Closing a Short Position:
A bullish trend shift occurs.
The position is liquidated at a predefined liquidity sweep level.
Customization Options
The strategy offers multiple adjustable settings:
Trade Mode: Choose between Long Only, Short Only, or Long & Short.
Trend Calculation Length & Multiplier: Adjust how trend signals are calculated.
Liquidity Sweep Sensitivity: Customize how aggressively the strategy identifies sweeps.
Volume Profile Display: Enable or disable the volume profile visualization.
Bounding Box & Scaling: Control the size and position of the volume profile.
Color Customization: Adjust colors for bullish and bearish signals.
Considerations & Limitations
Liquidity sweeps do not always result in reversals. Some price sweeps may continue in the same direction.
Works best in volatile markets. In low-volatility environments, liquidity sweeps may be less reliable.
Trend confirmation adds a slight delay. The strategy ensures valid signals, but this may result in slightly later entries.
Large volume imbalances may distort the volume profile. Adjusting the scale settings can help improve visualization.
Conclusion
The Liquidity Sweep Filter Strategy is a volume-integrated trading system that combines liquidity sweeps, trend analysis, and volume profile data to optimize trade execution.
By identifying key price levels where liquidations occur, this strategy provides valuable insight into market behavior, helping traders make better-informed trading decisions.
Key use cases for this strategy:
Liquidity-Based Trading – Capturing moves triggered by stop hunts and liquidations.
Volume Analysis – Using volume profile data to confirm high-activity price zones.
Trend Following – Entering trades based on confirmed trend shifts.
Support & Resistance Trading – Using liquidity sweep levels as dynamic price zones.
This strategy is fully customizable, allowing traders to adapt it to different market conditions, timeframes, and risk preferences.
Full credit for the original concept and indicator goes to AlgoAlpha.
Analisis Trend

Market Trend Levels Non-Repainting [BigBeluga X PineIndicators]This strategy is based on the Market Trend Levels Detector developed by BigBeluga. Full credit for the concept and original indicator goes to BigBeluga.
The Market Trend Levels Detector Strategy is a non-repainting trend-following strategy that identifies market trend shifts using two Exponential Moving Averages (EMA). It also detects key price levels and allows traders to apply multiple filters to refine trade entries and exits.
This strategy is designed for trend trading and enables traders to:
Identify trend direction based on EMA crossovers.
Detect significant market levels using labeled trend lines.
Use multiple filter conditions to improve trade accuracy.
Avoid false signals through non-repainting calculations.
How the Market Trend Levels Detector Strategy Works
1. Core Trend Detection Using EMA Crossovers
The strategy detects trend shifts using two EMAs:
Fast EMA (default: 12 periods) – Reacts quickly to price movements.
Slow EMA (default: 25 periods) – Provides a smoother trend confirmation.
A bullish crossover (Fast EMA crosses above Slow EMA) signals an uptrend , while a bearish crossover (Fast EMA crosses below Slow EMA) signals a downtrend .
2. Market Level Detection & Visualization
Each time an EMA crossover occurs, a trend level line is drawn:
Bullish crossover → A green line is drawn at the low of the crossover candle.
Bearish crossover → A purple line is drawn at the high of the crossover candle.
Lines can be extended to act as support and resistance zones for future price action.
Additionally, a small label (●) appears at each crossover to mark the event on the chart.
3. Trade Entry & Exit Conditions
The strategy allows users to choose between three trading modes:
Long Only – Only enters long trades.
Short Only – Only enters short trades.
Long & Short – Trades in both directions.
Entry Conditions
Long Entry:
A bullish EMA crossover occurs.
The trade direction setting allows long trades.
Filter conditions (if enabled) confirm a valid long signal.
Short Entry:
A bearish EMA crossover occurs.
The trade direction setting allows short trades.
Filter conditions (if enabled) confirm a valid short signal.
Exit Conditions
Long Exit:
A bearish EMA crossover occurs.
Exit filters (if enabled) indicate an invalid long position.
Short Exit:
A bullish EMA crossover occurs.
Exit filters (if enabled) indicate an invalid short position.
Additional Trade Filters
To improve trade accuracy, the strategy allows traders to apply up to 7 additional filters:
RSI Filter: Only trades when RSI confirms a valid trend.
MACD Filter: Ensures MACD histogram supports the trade direction.
Stochastic Filter: Requires %K line to be above/below threshold values.
Bollinger Bands Filter: Confirms price position relative to the middle BB line.
ADX Filter: Ensures the trend strength is above a set threshold.
CCI Filter: Requires CCI to indicate momentum in the right direction.
Williams %R Filter: Ensures price momentum supports the trade.
Filters can be enabled or disabled individually based on trader preference.
Dynamic Level Extension Feature
The strategy provides an optional feature to extend trend lines until price interacts with them again:
Bullish support lines extend until price revisits them.
Bearish resistance lines extend until price revisits them.
If price breaks a line, the line turns into a dotted style , indicating it has been breached.
This helps traders identify key levels where trend shifts previously occurred, providing useful support and resistance insights.
Customization Options
The strategy includes several adjustable settings :
Trade Direction: Choose between Long Only, Short Only, or Long & Short.
Trend Lengths: Adjust the Fast & Slow EMA lengths.
Market Level Extension: Decide whether to extend support/resistance lines.
Filters for Trade Confirmation: Enable/disable individual filters.
Color Settings: Customize line colors for bullish and bearish trend shifts.
Maximum Displayed Lines: Limit the number of drawn support/resistance lines.
Considerations & Limitations
Trend Lag: As with any EMA-based strategy, signals may be slightly delayed compared to price action.
Sideways Markets: This strategy works best in trending conditions; frequent crossovers in sideways markets can produce false signals.
Filter Usage: Enabling multiple filters may reduce trade frequency, but can also improve trade quality.
Line Overlap: If many crossovers occur in a short period, the chart may become cluttered with multiple trend levels. Adjusting the "Display Last" setting can help.
Conclusion
The Market Trend Levels Detector Strategy is a non-repainting trend-following system that combines EMA crossovers, market level detection, and customizable filters to improve trade accuracy.
By identifying trend shifts and key price levels, this strategy can be used for:
Trend Confirmation – Using EMA crossovers and filters to confirm trend direction.
Support & Resistance Trading – Identifying dynamic levels where price reacts.
Momentum-Based Trading – Combining EMA crossovers with additional momentum filters.
This strategy is fully customizable and can be adapted to different trading styles, timeframes, and market conditions.
Full credit for the original concept and indicator goes to BigBeluga.

Gradient Trend Filter STRATEGY [ChartPrime/PineIndicators]This strategy is based on the Gradient Trend Filter indicator developed by ChartPrime. Full credit for the concept and indicator goes to ChartPrime.
The Gradient Trend Filter Strategy is designed to execute trades based on the trend analysis and filtering system provided by the Gradient Trend Filter indicator. It integrates a noise-filtered trend detection system with a color-gradient visualization, helping traders identify trend strength, momentum shifts, and potential reversals.
How the Gradient Trend Filter Strategy Works
1. Noise Filtering for Smoother Trends
To reduce false signals caused by market noise, the strategy applies a three-stage smoothing function to the source price. This function ensures that trend shifts are detected more accurately, minimizing unnecessary trade entries and exits.
The filter is based on an Exponential Moving Average (EMA)-style smoothing technique.
It processes price data in three successive passes, refining the trend signal before generating trade entries.
This filtering technique helps eliminate minor fluctuations and highlights the true underlying trend.
2. Multi-Layered Trend Bands & Color-Based Trend Visualization
The Gradient Trend Filter constructs multiple trend bands around the filtered trend line, acting as dynamic support and resistance zones.
The mid-line changes color based on the trend direction:
Green for uptrends
Red for downtrends
A gradient cloud is formed around the trend line, dynamically shifting colors to provide early warning signals of trend reversals.
The outer bands function as potential support and resistance, helping traders determine stop-loss and take-profit zones.
Visualization elements used in this strategy:
Trend Filter Line → Changes color between green (bullish) and red (bearish).
Trend Cloud → Dynamically adjusts color based on trend strength.
Orange Markers → Appear when a trend shift is confirmed.
Trade Entry & Exit Conditions
This strategy automatically enters trades based on confirmed trend shifts detected by the Gradient Trend Filter.
1. Trade Entry Rules
Long Entry:
A bullish trend shift is detected (trend direction changes to green).
The filtered trend value crosses above zero, confirming upward momentum.
The strategy enters a long position.
Short Entry:
A bearish trend shift is detected (trend direction changes to red).
The filtered trend value crosses below zero, confirming downward momentum.
The strategy enters a short position.
2. Trade Exit Rules
Closing a Long Position:
If a bearish trend shift occurs, the strategy closes the long position.
Closing a Short Position:
If a bullish trend shift occurs, the strategy closes the short position.
The trend shift markers (orange diamonds) act as a confirmation signal, reinforcing the validity of trade entries and exits.
Customization Options
This strategy allows traders to adjust key parameters for flexibility in different market conditions:
Trade Direction: Choose between Long Only, Short Only, or Long & Short .
Trend Length: Modify the length of the smoothing function to adapt to different timeframes.
Line Width & Colors: Customize the visual appearance of trend lines and cloud colors.
Performance Table: Enable or disable the equity performance table that tracks historical trade results.
Performance Tracking & Reporting
A built-in performance table is included to monitor monthly and yearly trading performance.
The table calculates monthly percentage returns, displaying them in a structured format.
Color-coded values highlight profitable months (blue) and losing months (red).
Tracks yearly cumulative performance to assess long-term strategy effectiveness.
Traders can use this feature to evaluate historical performance trends and optimize their strategy settings accordingly.
How to Use This Strategy
Identify Trend Strength & Reversals:
Use the trend line and cloud color changes to assess trend strength and detect potential reversals.
Monitor Momentum Shifts:
Pay attention to gradient cloud color shifts, as they often appear before the trend line changes color.
This can indicate early momentum weakening or strengthening.
Act on Trend Shift Markers:
Use orange diamonds as confirmation signals for trend shifts and trade entry/exit points.
Utilize Cloud Bands as Support/Resistance:
The outer bands of the cloud serve as dynamic support and resistance, helping with stop-loss and take-profit placement.
Considerations & Limitations
Trend Lag: Since the strategy applies a smoothing function, entries may be slightly delayed compared to raw price action.
Volatile Market Conditions: In high-volatility markets, trend shifts may occur more frequently, leading to higher trade frequency.
Optimized for Trend Trading: This strategy is best suited for trending markets and may produce false signals in sideways (ranging) conditions.
Conclusion
The Gradient Trend Filter Strategy is a trend-following system based on the Gradient Trend Filter indicator by ChartPrime. It integrates noise filtering, trend visualization, and gradient-based color shifts to help traders identify strong market trends and potential reversals.
By combining trend filtering with a multi-layered cloud system, the strategy provides clear trade signals while minimizing noise. Traders can use this strategy for long-term trend trading, momentum shifts, and support/resistance-based decision-making.
This strategy is a fully automated system that allows traders to execute long, short, or both directions, with customizable settings to adapt to different market conditions.
Credit for the original concept and indicator goes to ChartPrime.

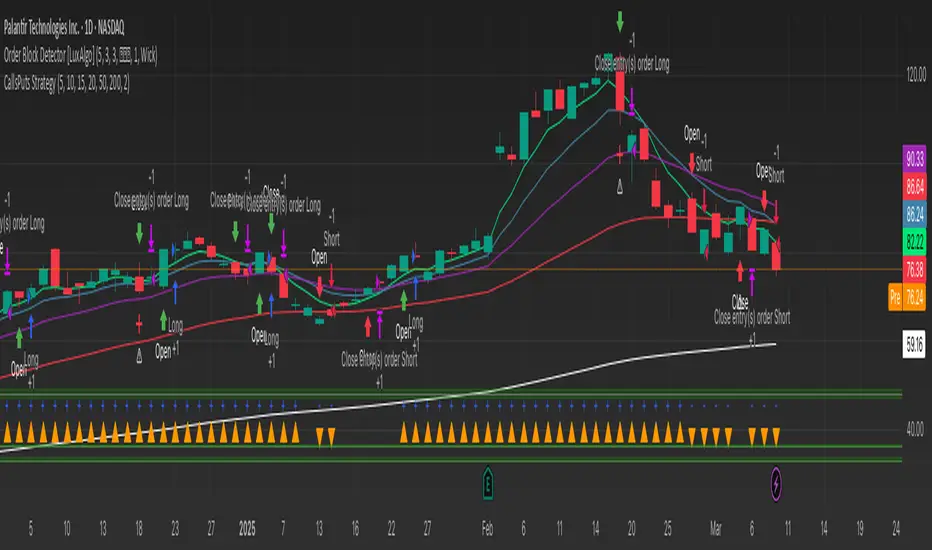
GRIM309 CallPut StrategyThis draws the 5, 10, 20, 50 and 200 EMA lines.
It creates suggestions of when to open and close call positions (GREEN) as well as open and close put positions (RED) it has a early warning system, and in case there is a spike between the last 5 positions it will signal close the position, this is optional (isWarning)
There is also a cooldown period, when set at 2 it means wait a position before initiating another, I did not like the position closing and then opening directly afterwards, you could cooldown for 3 and skip 2 candles or more etc. Set to 1 then it will open/close without cooling down.
Additionally the very bottom shows wether it is in an uptrend or downtrend currently (Yellow triangle)
Fibonacci-Only Strategy V2Fibonacci-Only Strategy V2
This strategy combines Fibonacci retracement levels with pattern recognition and statistical confirmation to identify high-probability trading opportunities across multiple timeframes.
Core Strategy Components:
Fibonacci Levels: Uses key Fibonacci retracement levels (19% and 82.56%) to identify potential reversal zones
Pattern Recognition: Analyzes recent price patterns to find similar historical formations
Statistical Confirmation: Incorporates statistical analysis to validate entry signals
Risk Management: Includes customizable stop loss (fixed or ATR-based) and trailing stop features
Entry Signals:
Long entries occur when price touches or breaks the 19% Fibonacci level with bullish confirmation
Short entries require Fibonacci level interaction, bearish confirmation, and statistical validation
All signals are visually displayed with color-coded markers and dashboard
Trading Method:
When a triangle signal appears, open a position on the next candle
Alternatively, after seeing a signal on a higher timeframe, you can switch to a lower timeframe to find a more precise entry point
Entry signals are clearly marked with visual indicators for easy identification
Risk Management Features:
Adjustable stop loss (percentage-based or ATR-based)
Optional trailing stops for protecting profits
Multiple take-profit levels for strategic position exit
Customization Options:
Timeframe selection (1m to Daily)
Pattern length and similarity threshold adjustment
Statistical period and weight configuration
Risk parameters including stop loss and trailing stop settings
This strategy is particularly well-suited for cryptocurrency markets due to their tendency to respect Fibonacci levels and technical patterns. Crypto's volatility is effectively managed through the customizable stop-loss and trailing-stop mechanisms, making it an ideal tool for traders in digital asset markets.
For optimal performance, this strategy works best on higher timeframes (30m, 1h and above) and is not recommended for low timeframe scalping. The Fibonacci pattern recognition requires sufficient price movement to generate reliable signals, which is more consistently available in medium to higher timeframes.
Users should avoid trading during sideways market conditions, as the strategy performs best during trending markets with clear directional movement. The statistical confirmation component helps filter out some sideways market signals, but it's recommended to manually avoid ranging markets for best results.

Vortex Sniper XVortex Sniper X – Trend-Following Strategy
🔹 Purpose
Vortex Sniper X is a trend-following strategy designed to identify strong market trends and enter trades in the direction of momentum. By combining multiple technical indicators, this strategy helps traders filter out false signals and only take trades with high confidence.
🔹 Indicator Breakdown
1️⃣ Vortex Indicator (Trend Direction & Strength)
Identifies the trend direction based on the relationship between VI+ and VI-.
Bullish Signal: VI+ crosses above VI-.
Bearish Signal: VI- crosses above VI+.
The wider the gap between VI+ and VI-, the stronger the trend’s momentum.
2️⃣ Relative Momentum Index (RMI – Momentum Confirmation)
Confirms whether price momentum supports the trend direction.
Long confirmation: RMI is rising and above the threshold.
Short confirmation: RMI is falling and below the threshold.
Filters out weak trends that lack sufficient momentum.
3️⃣ McGinley Dynamic (Trend Baseline Filter)
A dynamic moving average that adjusts to market volatility for smoother trend identification.
Long trades only if price is above the McGinley Dynamic.
Short trades only if price is below the McGinley Dynamic.
Prevents trading in choppy or sideways markets.
🔹 Strategy Logic & Trade Execution
✅ Entry Conditions
A trade is executed only when all three indicators confirm alignment:
Trend Confirmation: McGinley Dynamic defines the trend direction.
Vortex Signal: VI+ > VI- (bullish) or VI- > VI+ (bearish).
Momentum Confirmation: RMI must agree with the trend direction.
✅ Exit Conditions
Trend Reversal: If the opposite trade condition is met, the current position is closed.
Trend Weakness: If the trend weakens (detected via trend shifts), the position is exited.
🔹 Take-Profit System
The strategy follows a multi-stage profit-taking approach to secure gains:
Take Profit 1 (TP1): 50% of the position is closed at the first target.
Take Profit 2 (TP2): The remaining 50% is closed at the second target.
🔹 Risk Management (Important Notice)
🔴 This strategy does NOT include a stop-loss by default.
Trades rely on trend reversals or early exits to close positions.
Users should manually configure a stop-loss if risk management is required.
💡 Suggested risk management options:
Set a stop-loss at a recent swing high/low or an important support/resistance level.
Adjust position sizing according to personal risk tolerance.
🔹 Default Backtest Settings
To ensure realistic backtesting, the following settings are used:
Initial Capital: $1,000
Position Sizing: 10% of equity per trade
Commission: 0.05%
Slippage: 1 pip
Date Range: Can be adjusted for different market conditions
🔹 How to Use This Strategy
📌 To get the best results, follow these steps:
Apply the strategy to any TradingView chart.
Backtest before using it in live conditions.
Adjust the indicator settings as needed.
Set a manual stop-loss if required for your trading style.
Use this strategy in trending markets—avoid sideways conditions.
⚠️ Disclaimer
🚨 Trading involves risk. This strategy is for educational purposes only and should not be considered financial advice.
Past performance does not guarantee future results.
Users are responsible for managing their own risk.
Always backtest strategies before applying them in live trading.
🚀 Final Notes
Vortex Sniper X provides a structured approach to trend-following trading, ensuring:
✔ Multi-indicator confirmation for higher accuracy.
✔ Momentum-backed entries to avoid weak trends.
✔ Take-profit targets to secure gains.
✔ No repainting—historical performance aligns with live execution.
This strategy does not include a stop-loss, so users must apply their own risk management methods.

Optimized Auto-Detect Strategy (MA, ATR, Trend, RSI) Overview
This script is designed for traders seeking a trend-following approach that adapts to different currency pairs (e.g., EURUSD, NZDUSD, XAUUSD). It combines moving average crossovers with ATR-based stops, optional trend filters, and RSI filters to help reduce false signals and capture larger moves.
Key Features
1. Auto-Detect Logic
- Automatically applies different moving average periods and ATR multipliers based on the symbol (e.g., XAUUSD, EURUSD, NZDUSD).
- Makes it easy to switch charts without manually adjusting parameters each time.
2. ATR-Based Stop
- Uses the Average True Range (ATR) to set dynamic stop-loss levels, adapting to each market’s volatility.
3. Optional Trend Filter
- Filters out trades if price is below the 200 SMA for longs (and above for shorts), aiming to avoid choppy, range-bound markets.
4. Optional RSI Filter
- Only enters long if RSI is above a certain threshold (e.g., 50), or short if below another threshold, reducing entries during low momentum.
5. Partial Exit & Trailing/Break-Even
- Locks in partial profit at a chosen R:R (e.g., 1:1), then either trails the remaining position or moves the stop to break-even.
- This helps capture additional gains if the trend extends beyond the initial target.
6. Customizable Parameters
- You can toggle on/off each filter (Trend, RSI) and adjust the ATR multiplier, MA periods, partial exit levels, etc.
- Allows easy optimization for different pairs or timeframes.
How to Use
1. Add to Chart: Click “Add to chart” in the Pine Editor.
2. Configure Inputs: In the script’s settings, toggle the filters you want (Trend Filter, RSI Filter, etc.) and set your desired ATR multiplier, RSI thresholds, partial exit ratio, etc.
3. Strategy Tester: Check the performance under the “Strategy Tester” tab. Adjust parameters if needed.
4. Realistic Settings: Consider adding spreads/commissions in the “Properties” tab for more accurate backtests, especially if you trade pairs with higher spreads (like XAUUSD).
Disclaimer
No Guarantee: This script does not guarantee profits. Markets are unpredictable, and results may vary with market conditions.
For Educational Purposes: Always do your own research and forward testing. Past performance does not indicate future results.

Dual SuperTrend w VIX Filter - Strategy [presentTrading]Hey everyone! Haven't been here for a long time. Been so busy again in the past 2 months. I recently started working on analyzing the combination of trend strategy and VIX, but didn't get outstanding results after a few tries. Sharing this tool with all of you in case you have better insights.
█ Introduction and How it is Different
The Dual SuperTrend with VIX Filter Strategy combines traditional trend following with market volatility analysis. Unlike conventional SuperTrend strategies that focus solely on price action, this experimental system incorporates VIX (Volatility Index) as an adaptive filter to create a more context-aware trading approach. By analyzing where current volatility stands relative to historical norms, the strategy adjusts to different market environments rather than applying uniform logic across all conditions.
BTCUSD 6hr Long Short Performance
█ Strategy, How it Works: Detailed Explanation
🔶 Dual SuperTrend Core
The strategy uses two SuperTrend indicators with different sensitivity settings:
- SuperTrend 1: Length = 13, Multiplier = 3.5
- SuperTrend 2: Length = 8, Multiplier = 5.0
The SuperTrend calculation follows this process:
1. ATR = Average of max(High-Low, |High-PreviousClose|, |Low-PreviousClose|) over 'length' periods
2. UpperBand = (High+Low)/2 - (Multiplier * ATR)
3. LowerBand = (High+Low)/2 + (Multiplier * ATR)
Trend direction is determined by:
- If Close > previous LowerBand, Trend = Bullish (1)
- If Close < previous UpperBand, Trend = Bearish (-1)
- Otherwise, Trend = previous Trend
🔶 VIX Analysis Framework
The core innovation lies in the VIX analysis system:
1. Statistical Analysis:
- VIX Mean = SMA(VIX, 252)
- VIX Standard Deviation = StdDev(VIX, 252)
- VIX Z-Score = (Current VIX - VIX Mean) / VIX StdDev
2. **Volatility Bands:
- Upper Band 1 = VIX Mean + (2 * VIX StdDev)
- Upper Band 2 = VIX Mean + (3 * VIX StdDev)
- Lower Band 1 = VIX Mean - (2 * VIX StdDev)
- Lower Band 2 = VIX Mean - (3 * VIX StdDev)
3. Volatility Regimes:
- "Very Low Volatility": VIX < Lower Band 1
- "Low Volatility": Lower Band 1 ≤ VIX < Mean
- "Normal Volatility": Mean ≤ VIX < Upper Band 1
- "High Volatility": Upper Band 1 ≤ VIX < Upper Band 2
- "Extreme Volatility": VIX ≥ Upper Band 2
4. VIX Trend Detection:
- VIX EMA = EMA(VIX, 10)
- VIX Rising = VIX > VIX EMA
- VIX Falling = VIX < VIX EMA
Local performance:
🔶 Entry Logic Integration
The strategy combines trend signals with volatility filtering:
Long Entry Condition:
- Both SuperTrend 1 AND SuperTrend 2 must be bullish (trend = 1)
- AND selected VIX filter condition must be satisfied
Short Entry Condition:
- Both SuperTrend 1 AND SuperTrend 2 must be bearish (trend = -1)
- AND selected VIX filter condition must be satisfied
Available VIX filter rules include:
- "Below Mean + SD": VIX < Lower Band 1
- "Below Mean": VIX < VIX Mean
- "Above Mean": VIX > VIX Mean
- "Above Mean + SD": VIX > Upper Band 1
- "Falling VIX": VIX < VIX EMA
- "Rising VIX": VIX > VIX EMA
- "Any": No VIX filtering
█ Trade Direction
The strategy allows testing in three modes:
1. **Long Only:** Test volatility effects on uptrends only
2. **Short Only:** Examine volatility's impact on downtrends only
3. **Both (Default):** Compare how volatility affects both trend directions
This enables comparative analysis of how volatility regimes impact bullish versus bearish markets differently.
█ Usage
Use this strategy as an experimental framework:
1. Form a hypothesis about how volatility affects trend reliability
2. Configure VIX filters to test your specific hypothesis
3. Analyze performance across different volatility regimes
4. Compare results between uptrends and downtrends
5. Refine your volatility filtering approach based on results
6. Share your findings with the trading community
This framework allows you to investigate questions like:
- Are uptrends more reliable during rising or falling volatility?
- Do downtrends perform better when volatility is above or below its historical average?
- Should different volatility filters be applied to long vs. short positions?
█ Default Settings
The default settings serve as a starting point for exploration:
SuperTrend Parameters:
- SuperTrend 1 (Length=13, Multiplier=3.5): More responsive to trend changes
- SuperTrend 2 (Length=8, Multiplier=5.0): More selective filter requiring stronger trends
VIX Analysis Settings:
- Lookback Period = 252: Establishes a full market cycle for volatility context
- Standard Deviation Bands = 2 and 3 SD: Creates statistically significant regime boundaries
- VIX Trend Period = 10: Balances responsiveness with noise reduction
Default VIX Filter Selection:
- Long Entry: "Above Mean" - Tests if uptrends perform better during above-average volatility
- Short Entry: "Rising VIX" - Tests if downtrends accelerate when volatility is increasing
Feel Free to share your insight below!!!

TMA StrategyThe **TMA Strategy** is a trend-following strategy that leverages **Smoothed Moving Averages (SMMA)** and **candlestick patterns** to identify high-probability trading opportunities. It is designed for traders who want to capture strong trends while minimizing noise from short-term fluctuations.
**Key Features:**
✔ **Multiple Smoothed Moving Averages (SMMA):** Uses 21, 50, 100, and 200-period SMMAs to identify market trends and key support/resistance zones.
✔ **Candlestick Pattern Confirmation:** Incorporates **3-line strike** and **engulfing candle** patterns to confirm trade entries.
✔ **Dynamic Trend Filter:** A **2-period EMA** ensures that trades align with the dominant trend, reducing false signals.
✔ **Customizable Session Filter:** Allows users to enable/disable trading within specific market sessions (New York, London, Tokyo, etc.), ensuring trades are executed only during high-liquidity hours.
✔ **Risk Management:** Uses predefined exit conditions based on EMA/SMMA crossovers to lock in profits and minimize losses.
**Trading Logic:**
📌 **Long Entry:**
- Bullish Engulfing or 3-Line Strike pattern appears.
- Price is above the 200 SMMA.
- 2 EMA confirms an uptrend.
- Trade executes if session filter allows.
📌 **Short Entry:**
- Bearish Engulfing or 3-Line Strike pattern appears.
- Price is below the 200 SMMA.
- 2 EMA confirms a downtrend.
- Trade executes if session filter allows.
📌 **Exit Conditions:**
- Long trades exit when EMA(2) crosses **below** SMMA(200).
- Short trades exit when EMA(2) crosses **above** SMMA(200).
**Ideal Markets & Timeframes:**
✅ Best suited for **Forex, Stocks, and Crypto** markets.
✅ Works well on **higher timeframes (15m, 1H, 4H, Daily)** for stronger trend confirmation.
📢 **Disclaimer:**
This strategy is for educational purposes only. Backtest results do not guarantee future performance. Always use proper risk management and test in a demo account before live trading.
🚀 **Try the TMA Strategy now and enhance your trend-following approach!**

Destroyer LifeDestroyer Life Strategy - High-Frequency Long & Short Trading
Overview:
The Destroyer Life strategy is an advanced cryptocurrency trading algorithm designed for high-frequency execution on the 15-second timeframe. It combines CRT (Candle Range Trend) and Turtle Soup trading logic with multi-timeframe analysis to optimize entries and exits for both long and short trades. This strategy is specifically optimized for high-volatility crypto pairs, such as SOL/USD on MEXC, ensuring precise execution with minimal drawdown.
Key Features:
15-Second Timeframe Execution: Optimized for ultra-short-term trading.
Long & Short Strategy: Simultaneously identifies profitable buy and sell opportunities.
CRT & Turtle Soup Logic: Leverages price action patterns for enhanced trade accuracy.
Higher Timeframe Analysis (HTF): Incorporates liquidity zones, fair value gaps (FVG), and breaker blocks for context-aware trading.
Dynamic Position Sizing: Uses an adjustable leverage multiplier for risk-controlled trade sizing.
Commission Optimization: Ensures profitability even with trading fees.
Strict Risk Management: Implements exit conditions based on liquidity structure and trend reversals.
Strategy Performance (Backtested on SOL/USD - MEXC):
Overall Profitability: ~80% win rate in backtesting.
Net Profit: $3,151.12 (6.30% ROI).
Gross Profit: $3,795.68 (7.59%).
Gross Loss: $644.56 (1.29%).
Long Trades Profit: $1,459.05 (2.92%).
Short Trades Profit: $1,692.07 (3.38%).
Commission Paid: $924.82.
Minimum Trade Holding Period: 1-minute cooldown between trades.
Trading Logic:
Entry Conditions:
Long Trades: Triggered when the price enters a liquidity void and aligns with higher timeframe bullish bias.
Short Trades: Triggered when price approaches a resistance level with bearish higher timeframe confluence.
CRT & Turtle Soup Patterns: Identifies reversals by analyzing breakout and fake-out structures.
Exit Conditions:
Long Positions Close: Upon price exceeding a 3.88% profit threshold or reversing below an HTF structure.
Short Positions Close: Upon reaching a similar 3.88% threshold or showing strong bullish signals.
Dynamic Position Sizing:
Uses a leverage-based calculation that adapts trade size based on volatility.
Liquidity Awareness:
Tracks Mitigation Blocks (MB), Fair Value Gaps (FVG), Buy/Sell-Side Liquidity (BSL/SSL) to determine optimal execution.
Best Use Cases:
Scalpers & High-Frequency Traders: Those looking for rapid trade execution with short holding periods.
Crypto Traders Focused on Low Timeframes: Optimized for 15-second price action.
Traders Utilizing Liquidity Concepts: Built to exploit liquidity traps and inefficiencies.
Risks & Considerations:
High-Frequency Execution Requires Low Latency: Ensure your broker or exchange supports fast order execution.
Backtested Results May Vary: Real-time performance depends on market conditions.
Commission & Fees Impact Profits: Consider exchanges with low fees to maximize strategy efficiency.
Final Thoughts:
The Destroyer Life Strategy is designed for serious traders looking to take advantage of high-volatility markets with a structured, liquidity-based approach. By combining price action, liquidity concepts, and adaptive risk management, it provides a solid framework for executing high-probability trades on crypto markets.
🚀 Ready to take your trading to the next level? Try Destroyer Life today and dominate the markets!

Non-Repainting Renko Emulation Strategy [PineIndicators]Introduction: The Repainting Problem in Renko Strategies
Renko charts are widely used in technical analysis for their ability to filter out market noise and emphasize price trends. Unlike traditional candlestick charts, which are based on fixed time intervals, Renko charts construct bricks only when price moves by a predefined amount. This makes them useful for trend identification while reducing small fluctuations.
However, Renko-based trading strategies often fail in live trading due to a fundamental issue: repainting .
Why Do Renko Strategies Repaint?
Most trading platforms, including TradingView, generate Renko charts retrospectively based on historical price data. This leads to the following issues:
Renko bricks can change or disappear when new data arrives.
Backtesting results do not reflect real market conditions. Strategies may appear highly profitable in backtests because historical data is recalculated with hindsight.
Live trading produces different results than backtesting. Traders cannot know in advance whether a new Renko brick will form until price moves far enough.
Objective of the Renko Emulator
This script simulates Renko behavior on a standard time-based chart without repainting. Instead of using TradingView’s built-in Renko charting, which recalculates past bricks, this approach ensures that once a Renko brick is formed, it remains unchanged .
Key benefits:
No past bricks are recalculated or removed.
Trading strategies can execute reliably without false signals.
Renko-based logic can be applied on a time-based chart.
How the Renko Emulator Works
1. Parameter Configuration & Initialization
The script defines key user inputs and variables:
brickSize : Defines the Renko brick size in price points, adjustable by the user.
renkoPrice : Stores the closing price of the last completed Renko brick.
prevRenkoPrice : Stores the price level of the previous Renko brick.
brickDir : Tracks the direction of Renko bricks (1 = up, -1 = down).
newBrick : A boolean flag that indicates whether a new Renko brick has been formed.
brickStart : Stores the bar index at which the current Renko brick started.
2. Identifying Renko Brick Formation Without Repainting
To ensure that the strategy does not repaint, Renko calculations are performed only on confirmed bars.
The script calculates the difference between the current price and the last Renko brick level.
If the absolute price difference meets or exceeds the brick size, a new Renko brick is formed.
The new Renko price level is updated based on the number of bricks that would fit within the price movement.
The direction (brickDir) is updated , and a flag ( newBrick ) is set to indicate that a new brick has been formed.
3. Visualizing Renko Bricks on a Time-Based Chart
Since TradingView does not support live Renko charts without repainting, the script uses graphical elements to draw Renko-style bricks on a standard chart.
Each time a new Renko brick forms, a colored rectangle (box) is drawn:
Green boxes → Represent bullish Renko bricks.
Red boxes → Represent bearish Renko bricks.
This allows traders to see Renko-like formations on a time-based chart, while ensuring that past bricks do not change.
Trading Strategy Implementation
Since the Renko emulator provides a stable price structure, it is possible to apply a consistent trading strategy that would otherwise fail on a traditional Renko chart.
1. Entry Conditions
A long trade is entered when:
The previous Renko brick was bearish .
The new Renko brick confirms an upward trend .
There is no existing long position .
A short trade is entered when:
The previous Renko brick was bullish .
The new Renko brick confirms a downward trend .
There is no existing short position .
2. Exit Conditions
Trades are closed when a trend reversal is detected:
Long trades are closed when a new bearish brick forms.
Short trades are closed when a new bullish brick forms.
Key Characteristics of This Approach
1. No Historical Recalculation
Once a Renko brick forms, it remains fixed and does not change.
Past price action does not shift based on future data.
2. Trading Strategies Operate Consistently
Since the Renko structure is stable, strategies can execute without unexpected changes in signals.
Live trading results align more closely with backtesting performance.
3. Allows Renko Analysis Without Switching Chart Types
Traders can apply Renko logic without leaving a standard time-based chart.
This enables integration with indicators that normally cannot be used on traditional Renko charts.
Considerations When Using This Strategy
Trade execution may be delayed compared to standard Renko charts. Since new bricks are only confirmed on closed bars, entries may occur slightly later.
Brick size selection is important. A smaller brickSize results in more frequent trades, while a larger brickSize reduces signals.
Conclusion
This Renko Emulation Strategy provides a method for using Renko-based trading strategies on a time-based chart without repainting. By ensuring that bricks do not change once formed, it allows traders to use stable Renko logic while avoiding the issues associated with traditional Renko charts.
This approach enables accurate backtesting and reliable live execution, making it suitable for trend-following and swing trading strategies that rely on Renko price action.

[3Commas] Turtle StrategyTurtle Strategy
🔷 What it does: This indicator implements a modernized version of the Turtle Trading Strategy, designed for trend-following and automated trading with webhook integration. It identifies breakout opportunities using Donchian channels, providing entry and exit signals.
Channel 1: Detects short-term breakouts using the highest highs and lowest lows over a set period (default 20).
Channel 2: Acts as a confirmation filter by applying an offset to the same period, reducing false signals.
Exit Channel: Functions as a dynamic stop-loss (wait for candle close), adjusting based on market structure (default 10 periods).
Additionally, traders can enable a fixed Take Profit level, ensuring a systematic approach to profit-taking.
🔷 Who is it for:
Trend Traders: Those looking to capture long-term market moves.
Bot Users: Traders seeking to automate entries and exits with bot integration.
Rule-Based Traders: Operators who prefer a structured, systematic trading approach.
🔷 How does it work: The strategy generates buy and sell signals using a dual-channel confirmation system.
Long Entry: A buy signal is generated when the close price crosses above the previous high of Channel 1 and is confirmed by Channel 2.
Short Entry: A sell signal occurs when the close price falls below the previous low of Channel 1, with confirmation from Channel 2.
Exit Management: The Exit Channel acts as a trailing stop, dynamically adjusting to price movements. To exit the trade, wait for a full bar close.
Optional Take Profit (%): Closes trades at a predefined %.
🔷 Why it’s unique:
Modern Adaptation: Updates the classic Turtle Trading Strategy, with the possibility of using a second channel with an offset to filter the signals.
Dynamic Risk Management: Utilizes a trailing Exit Channel to help protect gains as trades move favorably.
Bot Integration: Automates trade execution through direct JSON signal communication with your DCA Bots.
🔷 Considerations Before Using the Indicator:
Market & Timeframe: Best suited for trending markets; higher timeframes (e.g., H4, D1) are recommended to minimize noise.
Sideways Markets: In choppy conditions, breakouts may lead to false signals—consider using additional filters.
Backtesting & Demo Testing: It is crucial to thoroughly backtest the strategy and run it on a demo account before risking real capital.
Parameter Adjustments: Ensure that commissions, slippage, and position sizes are set accurately to reflect real trading conditions.
🔷 STRATEGY PROPERTIES
Symbol: BINANCE:ETHUSDT (Spot).
Timeframe: 4h.
Test Period: All historical data available.
Initial Capital: 10000 USDT.
Order Size per Trade: 1% of Capital, you can use a higher value e.g. 5%, be cautious that the Max Drawdown does not exceed 10%, as it would indicate a very risky trading approach.
Commission: Binance commission 0.1%, adjust according to the exchange being used, lower numbers will generate unrealistic results. By using low values e.g. 5%, it allows us to adapt over time and check the functioning of the strategy.
Slippage: 5 ticks, for pairs with low liquidity or very large orders, this number should be increased as the order may not be filled at the desired level.
Margin for Long and Short Positions: 100%.
Indicator Settings: Default Configuration.
Period Channel 1: 20.
Period Channel 2: 20.
Period Channel 2 Offset: 20.
Period Exit: 10.
Take Profit %: Disable.
Strategy: Long & Short.
🔷 STRATEGY RESULTS
⚠️Remember, past results do not guarantee future performance.
Net Profit: +516.87 USDT (+5.17%).
Max Drawdown: -100.28 USDT (-0.95%).
Total Closed Trades: 281.
Percent Profitable: 40.21%.
Profit Factor: 1.704.
Average Trade: +1.84 USDT (+1.80%).
Average # Bars in Trades: 29.
🔷 How to Use It:
🔸 Adjust Settings:
Select your asset and timeframe suited for trend trading.
Adjust the periods for Channel 1, Channel 2, and the Exit Channel to align with the asset’s historical behavior. You can visualize these channels by going to the Style tab and enabling them.
For example, if you set Channel 2 to 40 with an offset of 40, signals will take longer to appear but will aim for a more defined trend.
Experiment with different values, a possible exit configuration is using 20 as well. Compare the results and adjust accordingly.
Enable the Take Profit (%) option if needed.
🔸Results Review:
It is important to check the Max Drawdown. This value should ideally not exceed 10% of your capital. Consider adjusting the trade size to ensure this threshold is not surpassed.
Remember to include the correct values for commission and slippage according to the symbol and exchange where you are conducting the tests. Otherwise, the results will not be realistic.
If you are satisfied with the results, you may consider automating your trades. However, it is strongly recommended to use a small amount of capital or a demo account to test proper execution before committing real funds.
🔸Create alerts to trigger the DCA Bot:
Verify Messages: Ensure the message matches the one specified by the DCA Bot.
Multi-Pair Configuration: For multi-pair setups, enable the option to add the symbol in the correct format.
Signal Settings: Enable the option to receive long or short signals (Entry | TP | SL), copy and paste the messages for the DCA Bots configured.
Alert Setup:
When creating an alert, set the condition to the indicator and choose "alert() function call only".
Enter any desired Alert Name.
Open the Notifications tab, enable Webhook URL, and paste the Webhook URL.
For more details, refer to the section: "How to use TradingView Custom Signals".
Finalize Alerts: Click Create, you're done! Alerts will now be sent automatically in the correct format.
🔷 INDICATOR SETTINGS
Period Channel 1: Period of highs and lows to trigger signals
Period Channel 2: Period of highs and lows to filter signals
Offset: Move Channel 2 to the right x bars to try to filter out the favorable signals.
Period Exit: It is the period of the Donchian channel that is used as trailing for the exits.
Strategy: Order Type direction in which trades are executed.
Take Profit %: When activated, the entered value will be used as the Take Profit in percentage from the entry price level.
Use Custom Test Period: When enabled signals only works in the selected time window. If disabled it will use all historical data available on the chart.
Test Start and End: Once the Custom Test Period is enabled, here you select the start and end date that you want to analyze.
Check Messages: Check Messages: Enable this option to review the messages that will be sent to the bot.
Entry | TP | SL: Enable this options to send Buy Entry, Take Profit (TP), and Stop Loss (SL) signals.
Deal Entry and Deal Exit: Copy and paste the message for the deal start signal and close order at Market Price of the DCA Bot. This is the message that will be sent with the alert to the Bot, you must verify that it is the same as the bot so that it can process properly.
DCA Bot Multi-Pair: You must activate it if you want to use the signals in a DCA Bot Multi-pair in the text box you must enter (using the correct format) the symbol in which you are creating the alert, you can check the format of each symbol when you create the bot.
👨🏻💻💭 We hope this tool helps enhance your trading. Your feedback is invaluable, so feel free to share any suggestions for improvements or new features you'd like to see implemented.
__
The information and publications within the 3Commas TradingView account are not meant to be and do not constitute financial, investment, trading, or other types of advice or recommendations supplied or endorsed by 3Commas and any of the parties acting on behalf of 3Commas, including its employees, contractors, ambassadors, etc.

Strategy SuperTrend SDI WebhookThis Pine Script™ strategy is designed for automated trading in TradingView. It combines the SuperTrend indicator and Smoothed Directional Indicator (SDI) to generate buy and sell signals, with additional risk management features like stop loss, take profit, and trailing stop. The script also includes settings for leverage trading, equity-based position sizing, and webhook integration.
Key Features
1. Date-based Trade Execution
The strategy is active only between the start and end dates set by the user.
times ensures that trades occur only within this predefined time range.
2. Position Sizing and Leverage
Uses leverage trading to adjust position size dynamically based on initial equity.
The user can set leverage (leverage) and percentage of equity (usdprcnt).
The position size is calculated dynamically (initial_capital) based on account performance.
3. Take Profit, Stop Loss, and Trailing Stop
Take Profit (tp): Defines the target profit percentage.
Stop Loss (sl): Defines the maximum allowable loss per trade.
Trailing Stop (tr): Adjusts dynamically based on trade performance to lock in profits.
4. SuperTrend Indicator
SuperTrend (ta.supertrend) is used to determine the market trend.
If the price is above the SuperTrend line, it indicates an uptrend (bullish).
If the price is below the SuperTrend line, it signals a downtrend (bearish).
Plots visual indicators (green/red lines and circles) to show trend changes.
5. Smoothed Directional Indicator (SDI)
SDI helps to identify trend strength and momentum.
It calculates +DI (bullish strength) and -DI (bearish strength).
If +DI is higher than -DI, the market is considered bullish.
If -DI is higher than +DI, the market is considered bearish.
The background color changes based on the SDI signal.
6. Buy & Sell Conditions
Long Entry (Buy) Conditions:
SDI confirms an uptrend (+DI > -DI).
SuperTrend confirms an uptrend (price crosses above the SuperTrend line).
Short Entry (Sell) Conditions:
SDI confirms a downtrend (+DI < -DI).
SuperTrend confirms a downtrend (price crosses below the SuperTrend line).
Optionally, trades can be filtered using crossovers (occrs option).
7. Trade Execution and Exits
Market entries:
Long (strategy.entry("Long")) when conditions match.
Short (strategy.entry("Short")) when bearish conditions are met.
Trade exits:
Uses predefined take profit, stop loss, and trailing stop levels.
Positions are closed if the strategy is out of the valid time range.
Usage
Automated Trading Strategy:
Can be integrated with webhooks for automated execution on supported trading platforms.
Trend-Following Strategy:
Uses SuperTrend & SDI to identify trend direction and strength.
Risk-Managed Leverage Trading:
Supports position sizing, stop losses, and trailing stops.
Backtesting & Optimization:
Can be used for historical performance analysis before deploying live.
Conclusion
This strategy is suitable for traders who want to automate their trading using SuperTrend and SDI indicators. It incorporates risk management tools like stop loss, take profit, and trailing stop, making it adaptable for leverage trading. Traders can customize settings, conduct backtests, and integrate it with webhooks for real-time trade execution. 🚀
Important Note:
This script is provided for educational and template purposes and does not constitute financial advice. Traders and investors should conduct their research and analysis before making any trading decisions.

is_strategyCorrection-Adaptive Trend Strategy (Open-Source)
Core Advantage: Designed specifically for the is_correction indicator, with full transparency and customization options.
Key Features:
Open-Source Code:
✅ Full access to the strategy logic – study how every trade signal is generated.
✅ Freedom to customize – modify entry/exit rules, risk parameters, or add new indicators.
✅ No black boxes – understand and trust every decision the strategy makes.
Built for is_correction:
Filters out false signals during market noise.
Works only in confirmed trends (is_correction = false).
Adaptable for Your Needs:
Change Take Profit/Stop Loss ratios directly in the code.
Add alerts, notifications, or integrate with other tools (e.g., Volume Profile).
For Developers/Traders:
Use the code as a template for your own strategies.
Test modifications risk-free on historical data.
How the Strategy Works:
Main Goal:
Automatically buys when the price starts rising and sells when it starts falling, but only during confirmed trends (ignoring temporary pullbacks).
What You See on the Chart:
📈 Up arrows ▼ (below the candle) = Buy signal.
📉 Down arrows ▲ (above the candle) = Sell signal.
Gray background = Market is in a correction (no trades).
Key Mechanics:
Buy Condition:
Price closes higher than the previous candle + is_correction confirms the main trend (not a pullback).
Example: Red candle → green candle → ▼ arrow → buy.
Sell Condition:
Price closes lower than the previous candle + is_correction confirms the trend (optional: turn off short-selling in settings).
Exit Rules:
Closes trades automatically at:
+0.5% profit (adjustable in settings).
-0.5% loss (adjustable).
Or if a reverse signal appears (e.g., sell signal after a buy).
User-Friendly Settings:
Sell – On (default: ON):
ON → Allows short-selling (selling when price falls).
OFF → Strategy only buys and closes positions.
Revers (default: OFF):
ON → Inverts signals (▼ = sell, ▲ = buy).
%Profit & %Loss:
Adjust these values (0-30%) to increase/decrease profit targets and risk.
Example Scenario:
Buy Signal:
Price rises for 3 days → green ▼ arrow → strategy buys.
Stop loss set 0.5% below entry price.
If price keeps rising → trade closes at +0.5% profit.
Correction Phase:
After a rally, price drops for 1 day → gray background → strategy ignores the drop (no action).
Stop Loss Trigger:
If price drops 0.5% from entry → trade closes automatically.
Key Features:
Correction Filter (is_correction):
Acts as a “noise filter” → avoids trades during temporary pullbacks.
Flexibility:
Disable short-selling, flip signals, or tweak profit/loss levels in seconds.
Transparency:
Open-source code → see exactly how every signal is generated (click “Source” in TradingView).
Tips for Beginners:
Test First:
Run the strategy on historical data (click the “Chart” icon in TradingView).
See how it performed in the past.
Customize It:
Increase %Profit to 2-3% for volatile assets like crypto.
Turn off Sell – On if short-selling confuses you.
Trust the Stop Loss:
Even if you think the price will rebound, the strategy will close at -0.5% to protect your capital.
Where to Find Settings:
Click the strategy name on the top-left of your chart → adjust sliders/toggles in the menu.
Русская Версия
Трендовая стратегия с открытым кодом
Главное преимущество: Полная прозрачность логики и адаптация под ваши нужды.
Особенности:
Открытый исходный код:
✅ Видите всю «кухню» стратегии – как формируются сигналы, когда открываются сделки.
✅ Меняйте правила – корректируйте тейк-профит, стоп-лосс или добавляйте новые условия.
✅ Никаких секретов – вы контролируете каждое правило.
Заточка под is_correction:
Игнорирует ложные сигналы в коррекциях.
Работает только в сильных трендах (is_correction = false).
Гибкая настройка:
Подстройте параметры под свой риск-менеджмент.
Добавьте свои индикаторы или условия для входа.
Для трейдеров и разработчиков:
Используйте код как основу для своих стратегий.
Тестируйте изменения на истории перед реальной торговлей.
Простыми словами:
Почему это удобно:
Открытый код = полный контроль. Вы можете:
Увидеть, как именно стратегия решает купить или продать.
Изменить правила закрытия сделок (например, поставить TP=2% вместо 1.5%).
Добавить новые условия (например, торговать только при высоком объёме).
Примеры кастомизации:
Новички: Меняйте только TP/SL в настройках (без кодинга).
Продвинутые: Добавьте RSI-фильтр, чтобы избегать перекупленности.
Разработчики: Встройте стратегию в свою торговую систему.
Как начать:
Скачайте код из TradingView.
Изучите логику в разделе strategy.entry/exit.
Меняйте параметры в блоке input.* (безопасно!).
Тестируйте изменения и оптимизируйте под свои цели.
Как работает стратегия:
Главная задача:
Автоматически покупает, когда цена начинает расти, и продаёт, когда падает. Но делает это «умно» — только когда рынок в основном тренде, а не во временном откате (коррекции).
Что видно на графике:
📈 Стрелки вверх ▼ (под свечой) — сигнал на покупку.
📉 Стрелки вниз ▲ (над свечой) — сигнал на продажу.
Серый фон — рынок в коррекции (не торгуем).
Как это работает:
Когда покупаем:
Если цена закрылась выше предыдущей и индикатор is_correction показывает «основной тренд» (не коррекция).
Пример: Была красная свеча → стала зелёная → появилась стрелка ▼ → покупаем.
Когда продаём:
Если цена закрылась ниже предыдущей и is_correction подтверждает тренд (опционально, можно отключить в настройках).
Когда закрываем сделку:
Автоматически при достижении:
+0.5% прибыли (можно изменить в настройках).
-0.5% убытка (можно изменить).
Или если появился противоположный сигнал (например, после покупки пришла стрелка продажи).
Настройки для чайников:
«Sell – On» (включено по умолчанию):
Если включено → стратегия будет продавать в шорт.
Если выключено → только покупки и закрытие позиций.
«Revers» (выключено по умолчанию):
Если включить → стратегия будет работать наоборот (стрелки ▼ = продажа, ▲ = покупка).
«%Profit» и «%Loss»:
Меняйте эти цифры (от 0 до 30), чтобы увеличить/уменьшить прибыль и риски.
Пример работы:
Сигнал на покупку:
Цена 3 дня растет → появляется зелёная стрелка ▼ → стратегия покупает.
Стоп-лосс ставится на 0.5% ниже цены входа.
Если цена продолжает расти → сделка закрывается при +0.5% прибыли.
Коррекция:
После роста цена падает на 1 день → фон становится серым → стратегия игнорирует это падение (не закрывает сделку).
Стоп-лосс:
Если цена упала на 0.5% от точки входа → сделка закрывается автоматически.
Важные особенности:
Фильтр коррекций (is_correction):
Это «защита от шума» — стратегия не реагирует на мелкие откаты, работая только в сильных трендах.
Гибкие настройки:
Можно запретить шорты, перевернуть сигналы или изменить уровни прибыли/убытка за 2 клика.
Прозрачность:
Весь код открыт → вы можете увидеть, как формируется каждый сигнал (меню «Исходник» в TradingView).
Советы для новичков:
Начните с теста:
Запустите стратегию на исторических данных (кнопка «Свеча» в окне TradingView).
Посмотрите, как она работала в прошлом.
Настройте под себя:
Увеличьте %Profit до 2-3%, если торгуете валюты.
Отключите «Sell – On», если не понимаете шорты.
Доверяйте стоп-лоссу:
Даже если кажется, что цена развернётся — стратегия закроет сделку при -0.5%, защитив ваш депозит.
Где найти настройки:
Кликните на название стратегии в верхнем левом углу графика → откроется меню с ползунками и переключателями.
Важно: Стратегия предоставляет «рыбу» – чтобы она стала «уловистой», адаптируйте её под свой стиль торговли!

Breakouts With Timefilter Strategy [LuciTech]This strategy captures breakout opportunities using pivot high/low breakouts while managing risk through dynamic stop-loss placement and position sizing. It includes a time filter to limit trades to specific sessions.
How It Works
A long trade is triggered when price closes above a pivot high, and a short trade when price closes below a pivot low.
Stop-loss can be set using ATR, prior candle high/low, or a fixed point value. Take-profit is based on a risk-reward multiplier.
Position size adjusts based on the percentage of equity risked.
Breakout signals are marked with triangles, and entry, stop-loss, and take-profit levels are plotted.
moving average filter: Bullish breakouts only trigger above the MA, bearish breakouts below.
The time filter shades the background during active trading hours.
Customization:
Adjustable pivot length for breakout sensitivity.
Risk settings: percentage risked, risk-reward ratio, and stop-loss type.
ATR settings: length, smoothing method (RMA, SMA, EMA, WMA).
Moving average filter (SMA, EMA, WMA, VWMA, HMA) to confirm breakouts.

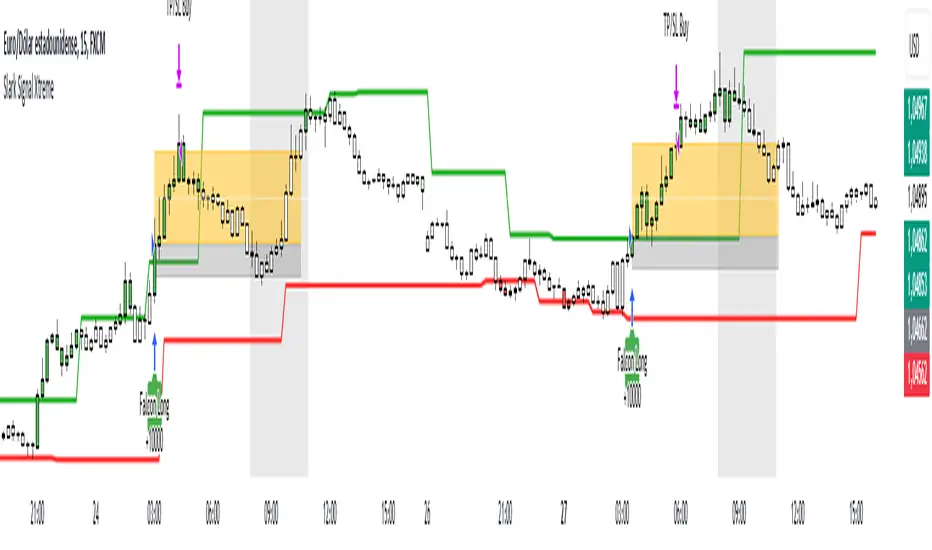
Slark Signal XtremeStrategy Description: Slark Signal Xtreme
The Slark Signal Xtreme is an innovative trading strategy designed to identify and capitalize on market opportunities by leveraging pivots, trend breakouts, and dynamic risk management. This strategy combines day-of-week and time filters with a ticks-based Stop Loss (SL) and Take Profit (TP) system, delivering customized signals and real-time alerts. Ideal for traders seeking a structured and highly customizable approach, Slark Signal Xtreme also incorporates advanced visual tools for efficient trade management.
Key Features:
Pivot- and Breakout-Based Signals: Utilizes pivot detection (highs/lows) combined with an ATR-based slope calculation to pinpoint trend changes and potential entry or exit points.
Dynamic Stop-Loss (SL) and Take-Profit (TP) Levels: Automatically calculates SL and TP based on the entry price and user-defined tick settings, adapting to volatility and optimizing risk management.
Time and Day Filters: Allows you to select specific days of the week and trading sessions during which signals are generated, avoiding low-liquidity periods or unwanted high volatility.
Customizable Risk Management: Lets you define the number of ticks for SL and TP, trading hours, initial capital, pyramiding, and commissions, tailoring the strategy to various risk profiles and assets.
Enhanced Visualization:
- SL and TP Boxes: Displays rectangular boxes on the chart indicating SL and TP levels, streamlining trade management.
- Candle Color Changes: Candles can be colored according to price position relative to pivot lines (bullish, bearish, or neutral).
- Session Highlight: Shades the chart background during the selected trading hours, providing immediate context on when the strategy is active.
Automated Alerts: Generates customizable alerts in TradingView whenever a buy or sell signal is triggered, detailing the timing, instrument, and SL/TP levels.
How the Strategy Works:
Technical Indicator Calculations:
- Pivot High/Low and Slope: Identifies price pivot points and calculates slope (based on ATR) to measure trend strength.
- Time and Day Filters: Signals only trigger within the specified days and hours, helping avoid undesirable market conditions.
Generating Buy and Sell Signals:
- Buy Signal (Long): Activated when price breaks above a downward pivot-based trendline or meets the condition for higher pivots.
- Sell Signal (Short): Activated when price breaks below an upward pivot-based trendline or meets the condition for lower pivots.
- Operation Conditions: Signals are only generated on selected days and during chosen trading hours, avoiding periods of low liquidity or excessive volatility.
Dynamic SL and TP Calculation:
- Stop-Loss (SL) and Take-Profit (TP): Determined by the entry price ± a user-defined number of ticks.
- SL and TP Visualization: Boxes are drawn on the chart from the entry price to SL/TP levels, enabling clear visual reference for trade management.
Order Execution and Alerts:
- Order Execution: When a signal is generated, Slark Signal Xtreme automatically opens a long or short position in TradingView’s backtesting environment.
- Alerts: Customizable alerts can be set up to provide real-time notifications (via TradingView or third-party integrations), offering essential details like instrument, time, SL/TP, etc.
Trade Management and Monitoring:
- Automatic Closure: Each trade is automatically closed upon reaching its SL or TP, ensuring disciplined risk control.
- Trade Summary: TradingView’s built-in reporting tools list all trades with cumulative results, simplifying performance evaluation.
Additional Visualization:
- Candle Coloring by Trend: Candles can be colored bullish, bearish, or neutral based on the pivot-driven trend detection.
- Operational Range Highlighting: The chart background is shaded during the permitted trading hours, clarifying when the strategy is active and enhancing visibility.
---
Strategy Properties (Important)
This backtest was conducted in TradingView under the following configuration:
Initial Capital: 1000 USD
Order Size: 10,000 contracts (adjust according to the traded asset)
Commission: 0.05 USD per order
Slippage: 1 tick
Pyramiding: 1 order
Price Verification for Limit Orders: 0 ticks
Recalculate on Every Tick & On Bar Close: Enabled
Bar Magnifier for Backtesting Precision: Enabled
These properties provide a realistic view of the strategy’s performance. However, default parameters may vary depending on each user or market:
Order Size: Should be calculated according to the asset traded and your desired risk level.
Commission and Slippage: Costs can vary by market and instrument; there is no universal default that guarantees realistic results.
All users are strongly recommended to adjust these properties within the script settings to match their own trading accounts and platforms, ensuring the most accurate backtest results.
---
Backtesting Results:
- Net Profit: +28.70
- Total Trades: 397
- Winning Trades: 138
- Win Rate: 34.76%
- Profit Factor: 1.07
- Sharpe Ratio: 1.25
- Sortino Ratio: 1.45
- Average Bars per Trade: 24
- Average Profit per Trade: 1.45
These numbers provide an overview of the strategy’s historical performance, demonstrating its potential for profitability given appropriate risk management.
---
Interpretation of Results:
- The strategy can be profitable despite a relatively modest win rate, thanks to a suitable risk-reward ratio.
- A profit factor of 1.07 indicates that total profits slightly exceed total losses.
- It is essential to monitor drawdown and ensure it aligns with your personal risk tolerance.
---
Risk Warning:
Trading leveraged financial instruments carries a high level of risk and may not be suitable for all investors. Before trading, carefully consider your investment objectives, experience level, and risk tolerance. Past performance does not guarantee future results. Always perform additional testing and adjust the strategy to your specific needs.
---
What Makes This Strategy Original?
Focus on Pivots and Time/Day Filters: Rather than purely relying on momentum indicators, Slark Signal Xtreme uses pivot-based signals and scheduling filters to capture higher-liquidity, directional market moves.
Dynamic Risk Management: Ticks-based SL/TP and customizable trading sessions enable precise adaptation to various markets and trading styles.
Advanced Visualization Tools: SL/TP boxes, candle coloring, and session highlights streamline market interpretation and facilitate real-time decision-making.
Seamless Alert Integration: Although native TradingView alerts are provided, it can be integrated with third-party messaging services (Telegram, Discord, etc.) for enhanced automation.
---
Additional Considerations
Continuous Testing and Optimization: Regularly backtest and fine-tune parameters (SL, TP, time filters, etc.) to accommodate changing market conditions.
Complementary Analysis: Combine this strategy with other technical or fundamental tools to confirm signals.
Rigorous Risk Management: Ensure SL/TP levels and position sizes conform to your overall risk management plan.
Updates and Support: Future updates and improvements may be released based on community feedback. For questions or suggestions, feel free to reach out.
---
Example Configuration
Assume you want to run Slark Signal Xtreme with these settings:
Trading Days: Monday to Friday
Trading Hours: 8:00 to 11:00 (exchange or broker time)
Stop Loss (SL) in Ticks: 100
Take Profit (TP) in Ticks: 300
SL/TP Box Extension: 20 bars
Initial Capital: 1000 USD
Risk per Trade: 1% of capital
Commissions & Slippage: 0.05 USD commission, 1 tick slippage
---
Conclusion
The Slark Signal Xtreme strategy delivers a robust and adaptable solution by merging pivots, time/day filters, flexible risk parameters, and advanced visualization. Its distinctive and customizable design makes it a powerful resource for traders aiming to diversify their methods and exploit trend breakouts under specific conditions. Fully compatible with TradingView, Slark Signal Xtreme can enhance your trading toolkit and foster a more systematic approach to your operations.
---
Final Disclaimer:
Financial markets are inherently volatile and pose significant risks. This strategy should be employed as part of a comprehensive trading plan and does not guarantee positive outcomes. Always consult a qualified financial advisor before making investment decisions. The use of Slark Signal Xtreme is solely at the user’s discretion, who must evaluate personal risk tolerance and financial objectives.
Trend Vanguard StrategyHow to Use:
Trend Vanguard Strategy is a multi-feature Pine Script strategy designed to identify market pivots, draw dynamic support/resistance, and generate trade signals via ZigZag breakouts. Here’s how it works and how to use it:
ZigZag Detection & Pivot Points
The script locates significant swing highs and lows using configurable Depth, Deviation, and Backstep values.
It then connects these pivots with lines (ZigZag) to highlight directional changes and prints labels (“Buy,” “Sell,” etc.) at key turning points.
Support & Resistance Trendlines
Pivot highs and lows are used to draw dashed S/R lines in real-time.
When price crosses these lines, the script triggers a breakout signal (long or short).
EMA Overlays
Up to four EMAs (with customizable lengths and colors) can be overlaid on the chart for added trend confirmation.
Enable/disable each EMA independently via the settings.
Repaint Option
Turning on “Smooth Indicator Lines” (repaint) uses future data to refine past pivots.
This can make historical signals look cleaner but does not reflect true historical conditions.
Turning it off ensures signals remain fixed once they appear.
Strategy Entries & Exits
On each new ZigZag “Buy” or “Sell” signal, the script closes any open position and flips to the opposite side (if desired).
Works with the built-in TradingView Strategy engine for backtesting.
Additional Inputs (Placeholders)
Volume Filter and RSI Filter settings exist but are not fully implemented in the current code. Future versions may incorporate these filters more directly.
How to Use
Add to Chart: Click “Indicators” → “Invite-Only Scripts” (or “My Scripts”) and select “Trend Vanguard Strategy.”
Configure Settings:
Adjust ZigZag Depth, Deviation, and Backstep to fine-tune pivot sensitivity.
Enable or disable each EMA to see how it aligns with market trends.
Toggle “Smooth Indicator Lines” on or off depending on whether you want repainting.
Backtest and Forward Test:
Use TradingView’s “Strategy Tester” tab to review hypothetical performance.
Remember that repainting can alter past signals if enabled.
Monitor Live:
Watch for breakout triangles or ZigZag labels to identify potential reversal or breakout trades in real time.
Disclaimer: This script is purely educational and not financial advice. Always combine it with sound risk management and thorough analysis. Enjoy exploring the script, and feel free to experiment with the different settings to match your trading style!

IronBot v4IronBot v4 – Trading Strategy Overview
1. Quick Context
IronBot v4 is a trading strategy designed for users who want a simple yet effective approach to reading the markets. It uses a combination of Fibonacci retracement levels, custom logic triggers, and innovative modules (EMA validation, Iron Impulse Shield and Iron Auto Volume Detector) to identify potential entry and exit points, strengthening the strategy’s detection of sudden market volatility or shifts in trading volume.
2. Theoretical Details
Fibonacci Analysis
The script identifies recent market highs and lows, then calculates key Fibonacci levels (high- and low-based). These levels can help confirm potential reversals or trends.
EMA Option
When enabled, the exponential moving average (EMA) offers additional validation for trade entries. If the current price remains above a certain EMA threshold, long positions may be favored; conversely, if it stays below the EMA, short positions may be initiated.
IIS (Iron Impulse Shield)
IIS helps to filter out risky trades by measuring recent price shocks or surges. If an extreme movement is detected, the strategy may temporarily disable longs or shorts to avoid false signals.
IAVD (Iron Auto Volume Detector)
This functionality automatically detects the average market volume over a defined period (regardless of the market, since it relies on real data). When entering a position, it ensures that overall volume is high enough to confirm a genuinely active, robust market. By providing an additional filter, it can strengthen the decision-making process whenever the market’s participation level is in question.
Panel
IronBot v4 displays a real-time backtest panel that summarizes the selected configuration (including the current pair, analysis window, enabled filters), as well as showing net profit, applicable exchange fees, country taxes, and the final net balance. This gives traders an immediate overview of strategy performance and risk metrics.
What Pinescript Adds Visually
The script plots:
Fibonacci levels (highlighting potential reversal zones)
Trend lines indicating bullish (green) or bearish (red) lean
Optional EMA line
Optional Fibonacci forecast lines for anticipating future moves
Automatic labeling of entry, take-profit, and stop-loss levels, indicating the profit percentage of each trade.
3. Explanation of Inputs
The strategy exposes multiple inputs that can be toggled or configured by the user:
Analysis Window : Dictates how many bars to consider for high/low calculations and the fib retracement thresholds.
TRADES
Display TP/SL: For displaying Take profits and Stop loss.
Display Forecast: When enabled, this feature calculates and projects possible future Fibonacci retracements using historical data, helping traders anticipate potential upcoming trade setups.
Leverage: Only used for the Panel and not for trades. Lets you amplify your position size; higher leverage increases potential gains but also heightens risk. TradingView strategy is using properties for doing this.
Exchange Maker Fees & Exchange Taker Fees: Only used for the Panel and not for trades. Define the percentage cost applied by your exchange for maker and taker trades, respectively. These fees are accounted for in final profit calculations of the Panel.
Country Tax: Only used for the Panel and not for trades. Specifies a tax percentage to be deducted from net profits.
STOP LOSS and TAKE PROFITS
Stop-Loss & Take-Profit Parameters: Controls the percentage distances at which the strategy will exit positions. Additionally, you can configure up to four distinct take-profit levels (TP1 through TP4). Each level should be higher target than the previous one, and you can assign a specific percentage of the total position to close at each TP, ensuring the sum equals 100%. A break-even feature is also available when multiple TPs are used.
EMA
EMA (Exponential Moving Average) Option: When enabled, the strategy opens long trades only if the current price is above the specified EMA length, and opens short trades only if it is below that threshold.
PANELS
Show Panel: For displaying the backtest integrated panel.
IRON IMPULSE SHIELD (IIS)
IIS (Iron Impulse Shield) Option: When enabled, IIS continuously monitors recent price volatility depending on the analysis window set. If the market experiences an extreme surge or drop beyond a specified threshold, IIS temporarily blocks new long or short positions.
IRON AUTO VOLUME DETECTOR (IAVD)
IAVD (Iron Auto Volume Detector) Option: When enabled, it continuously measures the average market volume over a special period, irrespective of the specific trading pair. This ensures that IronBot v4 focuses on markets with robust participation, reducing the likelihood of entering trades during low-liquidity conditions.
By changing these values, IronBot v4 reacts differently to market structure and risk management requirements. Stop-loss and take-profit levels will adjust accordingly, while advanced filters (like EMA or IIS) influence when trades can open.
4. TradingView Strategy Properties
IronBot v4 uses the built-in TradingView “strategy” functionality. In particular:
Order Placement: The code calls strategy.entry() and strategy.close() for direct orders, ensuring signals are sent immediately (no limit orders are used). This helps connect with exchange signal bots for automated execution.
Initial Capital: The code uses initial capital defined in properties for calculating Net balance in the integrated panel.
On bar close: This strategy fill orders on bar close.
Pyramiding: This strategy can take only 1 successive trade in the same direction
Be careful to configure your leverage input depending on your strategy properties.
5. Visualization
5. Purpose & Disclaimer
This script is for educational purposes only and does not constitute financial advice. Past performance does not guarantee future results. Always confirm your own risk tolerance and consult a financial professional before placing live trades. Trading leveraged products can involve substantial risk of loss.

Neon Momentum Waves StrategyIntroduction
The Neon Momentum Waves Strategy is a momentum-based indicator designed to help traders visualize potential shifts in market direction. It builds upon a MACD-style calculation while incorporating an enhanced visual representation of momentum waves. This approach may assist traders in identifying areas of increasing or decreasing momentum, potentially aligning with market trends or reversals.
How It Works
This strategy is based on a modified MACD (Moving Average Convergence Divergence) method, calculating the difference between two Exponential Moving Averages (EMAs). The momentum wave represents this difference, while an additional smoothing line (signal line) helps highlight potential momentum shifts.
Key Components:
Momentum Calculation:
Uses a fast EMA (12-period) and a slow EMA (26-period) to measure short-term and long-term momentum.
A signal line (20-period EMA of the MACD difference) smooths fluctuations.
The histogram (momentum wave) represents the divergence between the MACD value and the signal line.
Interpreting Momentum Changes:
Momentum Increasing: When the histogram rises above the zero line, it may indicate strengthening upward movement.
Momentum Decreasing: When the histogram moves below the zero line, it may signal a weakening trend or downward momentum.
Potential Exhaustion Points: Users can define custom threshold levels (default: ±10) to highlight when momentum is significantly strong or weak.
Visual Enhancements:
The neon glow effect is created by layering multiple plots with decreasing opacity, enhancing the clarity of momentum shifts.
Aqua-colored waves highlight upward momentum, while purple waves represent downward momentum.
Horizontal reference lines mark the zero line and user-defined thresholds to improve interpretability.
How It Differs from Traditional Indicators
Improved Visualization: Unlike standard MACD histograms, this approach provides clearer visual cues using a neon-style wave format.
Customizable Thresholds: Rather than relying solely on MACD crossovers, users can adjust sensitivity settings to better suit their trading style.
Momentum-Based Approach: The strategy is focused on visualizing shifts in momentum strength, rather than predicting price movements.
Potential Use Cases
Momentum Trend Awareness: Helps traders identify periods where momentum appears to be strengthening or fading.
Market Structure Analysis: May complement other indicators to assess whether price action aligns with momentum changes.
Flexible Timeframe Application: Can be used across different timeframes, depending on the trader’s strategy.
Important Considerations
This strategy is purely momentum-based and does not incorporate volume, fundamental factors, or price action confirmation.
Momentum shifts do not guarantee price direction changes—they should be considered alongside broader market context.
The strategy may perform differently in trending vs. ranging markets, so adjustments in sensitivity may be needed.
Risk management is essential—traders should apply proper stop-losses and position sizing techniques in line with their risk tolerance.
Conclusion
The Neon Momentum Waves Strategy provides a visually enhanced method of tracking momentum, allowing traders to observe potential changes in market strength. While not a predictive tool, it serves as a complementary indicator that may help traders in momentum-based decision-making. As with any technical tool, it should be used as part of a broader strategy that considers multiple factors in market analysis.

SuperTrend AI Oscillator StrategySuperTrend AI Oscillator Strategy
Overview
This strategy is a trend-following approach that combines the SuperTrend indicator with oscillator-based filtering.
By identifying market trends while utilizing oscillator-based momentum analysis, it aims to improve entry precision.
Additionally, it incorporates a trailing stop to strengthen risk management while maximizing profits.
This strategy can be applied to various markets, including Forex, Crypto, and Stocks, as well as different timeframes. However, its effectiveness varies depending on market conditions, so thorough testing is required.
Features
1️⃣ Trend Identification Using SuperTrend
The SuperTrend indicator (a volatility-adjusted trend indicator based on ATR) is used to determine trend direction.
A long entry is considered when SuperTrend turns bullish.
A short entry is considered when SuperTrend turns bearish.
The goal is to capture clear trend reversals and avoid unnecessary trades in ranging markets.
2️⃣ Entry Filtering with an Oscillator
The Super Oscillator is used to filter entry signals.
If the oscillator exceeds 50, it strengthens long entries (indicating strong bullish momentum).
If the oscillator drops below 50, it strengthens short entries (indicating strong bearish momentum).
This filter helps reduce trades in uncertain market conditions and improves entry accuracy.
3️⃣ Risk Management with a Trailing Stop
Instead of a fixed stop loss, a SuperTrend-based trailing stop is implemented.
The stop level adjusts automatically based on market volatility.
This allows profits to run while managing downside risk effectively.
4️⃣ Adjustable Risk-Reward Ratio
The default risk-reward ratio is set at 1:2.
Example: A 1% stop loss corresponds to a 2% take profit target.
The ratio can be customized according to the trader’s risk tolerance.
5️⃣ Clear Trade Signals & Visual Support
Green "BUY" labels indicate long entry signals.
Red "SELL" labels indicate short entry signals.
The Super Oscillator is plotted in a separate subwindow to visually assess trend strength.
A real-time trailing stop is displayed to support exit strategies.
These visual aids make it easier to identify entry and exit points.
Trading Parameters & Considerations
Initial Account Balance: Default is $7,000 (adjustable).
Base Currency: USD
Order Size: 10,000 USD
Pyramiding: 1
Trading Fees: $0.94 per trade
Long Position Margin: 50%
Short Position Margin: 50%
Total Trades (M5 Timeframe): 1,032
Visual Aids for Clarity
This strategy includes clear visual trade signals to enhance decision-making:
Green "BUY" labels for long entries
Red "SELL" labels for short entries
Super Oscillator plotted in a subwindow with a 50 midline
Dynamic trailing stop displayed for real-time trend tracking
These visual aids allow traders to quickly identify trade setups and manage positions with greater confidence.
Summary
The SuperTrend AI Oscillator Strategy is developed based on indicators from Black Cat and LuxAlgo.
By integrating high-precision trend analysis with AI-based oscillator filtering, it provides a strong risk-managed trading approach.
Important Notes
This strategy does not guarantee profits—performance varies based on market conditions.
Past performance does not guarantee future results. Markets are constantly changing.
Always test extensively with backtesting and demo trading before using it in live markets.
Risk management, position sizing, and market conditions should always be considered when trading.
Conclusion
This strategy combines trend analysis with momentum filtering, enhancing risk management in trading.
By following market trends carefully, making precise entries, and using trailing stops, it seeks to reduce risk while maximizing potential profits.
Before using this strategy, be sure to test it thoroughly via backtesting and demo trading, and adjust the settings to match your trading style.

ChronoSync | QuantEdgeB Introducing ChronoSync by QuantEdgeB
🛠️ Overview
ChronoSync is a multi-layered universal strategy designed for adaptability across various assets, timeframes, and market conditions. By integrating five high-quality indicators, it generates a dynamic, aggregated signal that enhances decision-making and optimizes performance in trending and mean-reverting environments.
📊 Key Strengths
✔️ Multi-indicator fusion for enhanced accuracy
✔️ Built-in adaptive filtering techniques
✔️ Works across varied market regimes
✔️ Provides quantifiable, rule-based signals
_____
✨ Key Features
🔹 Universal Signal Aggregation
Combines five complementary indicators to form a balanced, adaptive signal, ensuring robust performance across different market conditions.
🔹 Advanced Filtering Techniques
Utilizes Gaussian smoothing, average true range and standard deviation filtering, indicator normalization, and other non-lagging filters to refine trend detection and minimize noise.
🔹 Dynamic Market Adaptation
Employs percentile-based filtering and normalization techniques, allowing it to adjust dynamically to volatility shifts.
🔹 Modular & Customizable
Each indicator can be toggled independently, allowing traders to fine-tune the strategy based on their specific market outlook.
_____
📊 How It Works & Signal Generation
⚙ Multi-Layer Signal Aggregation: ChronoSync calculates individual trend signals from five indicators, combining their outputs into a Final Strategy Score to determine trade signals.
✅ Long Entry: Triggered when the aggregated final score surpasses the long threshold
❌ Short Entry (Cash Mode): Triggered when the final signal falls below the short threshold
🎨 Color Visualization: Changes dynamically to reflect market conditions
🔹 Volatility Adaptable: Traders can adjust the long and short signal thresholds to fine-tune sensitivity to volatility—wider thresholds reduce false signals in choppy markets, while narrower thresholds increase responsiveness in high-momentum trends.
🖥️ Dashboard & Signal Display:
• Displays individual indicator values and final aggregation score
• Signals (Long / Cash) appear directly on the chart when the label display is turned on
• Customizable visual settings to match user preferences
______
👥 Who is this for?
✔ Swing & Medium-Term Traders → Ideal for multi-day to multi-week trades.
✔Long-Term Investors & Trend Followers – Designed for traders and investors with a months-to-years horizon who seek to capture market trends on a cycle basis.
✔ Quantitative Traders → Structured, rules-based approach for systematic execution
_____
📊 Expanded Explanation : How the Five Indicators Work Together in ChronoSync
The ChronoSync strategy is built upon five carefully selected indicators, each fulfilling a crucial role in trend detection, volatility adaptation, and signal refinement. The synergy between these components ensures that signals are both robust and adaptable to different market conditions.
🔗 The Five-Indicator Synergy
Each indicator plays a specific role in the trend-following system, working together to enhance the strength, reliability, and adaptability of trade signals:
1️⃣ VIDYA ATR Gaussian Filter → Noise-Reduced Trend Detection
✔ What it Does:
The VIDYA ATR Gaussian Filter combines a volatility-adjusted moving average (VIDYA) with Gaussian smoothing to enhance trend clarity while minimizing market noise.
✔ Why It's Important:
• VIDYA dynamically adjusts to price fluctuations, ensuring smoother trend signals.
• Gaussian filtering eliminates erratic price movements that could otherwise trigger false entries/exits.
• By applying ATR filtering, the indicator remains adaptive to different volatility environments.
✔ How It Works With Others:
• Works in tandem with Kijun ATR & Dual SD Kijun to confirm long-term price trends while filtering out market noise.
• Enhances signal stability by reducing whipsaws in choppy conditions.
2️⃣ Kijun ATR & Dual SD Kijun → Trend Confirmation & Volatility Filtering
✔ What it Does:
The Kijun ATR and Dual SD Kijun components combine trend structure with volatility adjustments to capture sustained price moves.
✔ Why It's Important:
• The Kijun ATR dynamically adjusts to price swings, allowing the system to filter out market noise and identify valid breakout conditions.
• The Dual SD Kijun introduces an extra layer of confirmation by incorporating a standard deviation-based volatility filter to assess trend strength.
✔ How It Works With Others:
• Confirms trends initiated by VIDYA ATR Gaussian Filter, ensuring signals are based on structural price movements rather than short-term fluctuations.
• Complements PRC-ALMA Adaptive Bands in detecting price deviations and trend shifts.
3️⃣ VIDYA Loop Function → Iterative Trend Reinforcement
✔ What it Does:
The VIDYA Loop Function applies a recursive method to track sustained trends, using a loop-based iterative calculation.
✔ Why It's Important:
• Identifies persistent trends by aggregating historical VIDYA changes over a defined loop window.
• Helps eliminate short-lived price movements by smoothing trend signals over time.
✔ How It Works With Others:
• Enhances Bollinger Bands % SD by providing an additional trend strength confirmation.
• Strengthens Kijun ATR signals by filtering out weak or temporary price movements.
4️⃣ PRC-ALMA Adaptive Bands → Mean Reversion & Trend Filtering
✔ What it Does:
The PRC-ALMA Adaptive Bands combine a percentile-based ranking system with an adaptive smoothing function (ALMA) to define overbought/oversold zones within trend movements.
✔ Why It's Important:
• Adaptive percentile-based ranking ensures the indicator adjusts to market shifts dynamically.
• ALMA filtering ensures non-lagging trend detection, reducing delays in trade signals.
• Acts as a contrarian filter for trend exhaustion signals.
✔ How It Works With Others:
• Complements VIDYA ATR & Kijun ATR by refining trend-following entries.
• Provides mean-reverting insights to balance aggressive trend-following signals.
5️⃣ Bollinger Bands % SD → Volatility Expansion & Trend Strength Evaluation
✔ What it Does:
The Bollinger Bands % SD indicator measures price positioning relative to standard deviation bounds, helping assess volatility-driven trend strength.
✔ Why It's Important:
• Measures price movements relative to historical volatility thresholds.
• Helps determine when price action is statistically stretched (i.e., strong trend moves vs. mean-reverting pullbacks).
• Allows dynamic market adaptation, ensuring that signals remain relevant across different volatility phases.
✔ How It Works With Others:
• Enhances PRC-ALMA by confirming whether a price move is an actual breakout or a short-term deviation.
• Validates VIDYA ATR & Kijun ATR signals by ensuring the trend has sufficient strength to continue.
The ChronoSync strategy ensures a balanced fusion of trend-following and volatility adaptation. Each component adds a distinct layer of analysis, reducing false signals and improving robustness:
✅ Trend Identification → VIDYA ATR, Kijun ATR, & Dual SD Kijun
✅ Noise Reduction & Trend Confirmation → VIDYA Loop Function & Gaussian Smoothing
✅ Volatility Adaptation & Overbought/Oversold Conditions → PRC-ALMA Adaptive Bands & Bollinger Bands % SD
This multi-layered approach ensures that no single indicator dominates the strategy, allowing it to adapt dynamically to various market conditions.
📌 Conclusion
ChronoSync is a universal trend aggregation strategy, built on adaptive multi-indicator filtering and robust risk management. Designed for dynamic market conditions, it offers a rule-based, quantifiable approach to trend identification. Whether used as a standalone trading system or an auxiliary confirmation tool, it provides a scientific, data-driven edge for traders navigating volatile markets.
🔹 Disclaimer: Past performance is not indicative of future results. No trading strategy can guarantee success in financial markets.
🔹 Strategic Advice: Always backtest, optimize, and align parameters with your trading objectives and risk tolerance before live trading.

[3Commas] HA & MAHA & MA
🔷What it does: This tool is designed to test a trend-following strategy using Heikin Ashi candles and moving averages. It enters trades after pullbacks, aiming to let profits run once the risk-to-reward ratio reaches 1:1 while securing the position.
🔷Who is it for: It is ideal for traders looking to compare final results using fixed versus dynamic take profits by adjusting parameters and trade direction—a concept applicable to most trading strategies.
🔷How does it work: We use moving averages to define the market trend, then wait for opposite Heikin Ashi candles to form against it. Once these candles reverse in favor of the trend, we enter the trade, using the last swing created by the pullback as the stop loss. By applying the breakeven ratio, we protect the trade and let it run, using the slower moving average as a trailing stop.
A buy signal is generated when:
The previous candle is bearish (ha_bear ), indicating a pullback.
The fast moving average (ma1) is above the slow moving average (ma2), confirming an uptrend.
The current candle is bullish (ha_bull), showing trend continuation.
The Heikin Ashi close is above the fast moving average (ma1), reinforcing the bullish bias.
The real price close is above the open (close > open), ensuring bullish momentum in actual price data.
The signal is confirmed on the closed candle (barstate.isconfirmed) to avoid premature signals.
dir is undefined (na(dir)), preventing repeated signals in the same direction.
A sell signal is generated when:
The previous candle is bullish (ha_bull ), indicating a temporary upward move before a potential reversal.
The fast moving average (ma1) is below the slow moving average (ma2), confirming a downtrend.
The current candle is bearish (ha_bear), showing trend continuation to the downside.
The Heikin Ashi close is below the fast moving average (ma1), reinforcing bearish pressure.
The real price close is below the open (close < open), confirming bearish momentum in actual price data.
The signal is confirmed after the candle closes (barstate.isconfirmed), avoiding premature entries.
dir is undefined (na(dir)), preventing consecutive signals in the same direction.
In simple terms, this setup looks for trend continuation after a pullback, confirming entries with both Heikin Ashi and real price action, supported by moving average alignment to avoid false signals.
If the price reaches a 1:1 risk-to-reward ratio, the stop will be moved to the entry point. However, if the slow moving average surpasses this level, it will become the new exit point, acting as a trailing stop
🔷Why It’s Unique
Easily visualizes the benefits of using risk-to-reward ratios when trading instead of fixed percentages.
Provides a simple and straightforward approach to trading, embracing the "keep it simple" concept.
Offers clear visualization of DCA Bot entry and exit points based on user preferences.
Includes an option to review the message format before sending signals to bots, with compatibility for multi-pair and futures contract pairs.
🔷 Considerations Before Using the Indicator
⚠️Very important: The indicator must be used on charts with real price data, such as Japanese candlesticks, line charts, etc. Do not use it on Heikin Ashi charts, as this may lead to unrealistic results.
🔸Since this is a trend-following strategy, use it on timeframes above 4 hours, where market noise is reduced and trends are clearer. Also, carefully review the statistics before using it, focusing on pairs that tend to have long periods of well-defined trends.
🔸Disadvantages:
False Signals in Ranges: Consolidating markets can generate unreliable signals.
Lagging Indicator: Being based on moving averages, it may react late to sudden price movements.
🔸Advantages:
Trend Focused: Simplifies the identification of trending markets.
Noise Reduction: Uses Heikin Ashi candles to identify trend continuation after pullbacks.
Broad Applicability: Suitable for forex, crypto, stocks, and commodities.
🔸The strategy provides a systematic way to analyze markets but does not guarantee successful outcomes. Use it as an additional tool rather than relying solely on an automated system.
Trading results depend on various factors, including market conditions, trader discipline, and risk management. Past performance does not ensure future success, so always approach the market cautiously.
🔸Risk Management: Define stop-loss levels, position sizes, and profit targets before entering any trade. Be prepared for potential losses and ensure your approach aligns with your overall trading plan.
🔷 STRATEGY PROPERTIES
Symbol: BINANCE:BTCUSDT (Spot).
Timeframe: 4h.
Test Period: All historical data available.
Initial Capital: 10000 USDT.
Order Size per Trade: 1% of Capital, you can use a higher value e.g. 5%, be cautious that the Max Drawdown does not exceed 10%, as it would indicate a very risky trading approach.
Commission: Binance commission 0.1%, adjust according to the exchange being used, lower numbers will generate unrealistic results. By using low values e.g. 5%, it allows us to adapt over time and check the functioning of the strategy.
Slippage: 5 ticks, for pairs with low liquidity or very large orders, this number should be increased as the order may not be filled at the desired level.
Margin for Long and Short Positions: 100%.
Indicator Settings: Default Configuration.
MA1 Length: 9.
MA2 Length: 18.
MA Calculations: EMA.
Take Profit Ratio: Disable. Ratio 1:4.
Breakeven Ratio: Enable, Ratio 1:1.
Strategy: Long & Short.
🔷 STRATEGY RESULTS
⚠️Remember, past results do not guarantee future performance.
Net Profit: +324.88 USDT (+3.25%).
Max Drawdown: -81.18 USDT (-0.78%).
Total Closed Trades: 672.
Percent Profitable: 35.57%.
Profit Factor: 1.347.
Average Trade: +0.48 USDT (+0.48%).
Average # Bars in Trades: 13.
🔷 HOW TO USE
🔸 Adjust Settings:
The default values—MA1 (9) and MA2 (18) with EMA calculation—generally work well. However, you can increase these values, such as 20 and 40, to better identify stronger trends.
🔸 Choose a Symbol that Typically Trends:
Select an asset that tends to form clear trends. Keep in mind that the Strategy Tester results may show poor performance for certain assets, making them less suitable for sending signals to bots.
🔸 Experiment with Ratios:
Test different take profit and breakeven ratios to compare various scenarios—especially to observe how the strategy performs when only the trade is protected.
🔸This is an example of how protecting the trade works: once the price moves in favor of the position with a 1:1 risk-to-reward ratio, the stop loss is moved to the entry price. If the Slow MA surpasses this level, it will act as a trailing stop, aiming to follow the trend and maximize potential gains.
🔸In contrast, in this example, for the same trade, if we set a take profit at a 1:3 risk-to-reward ratio—which is generally considered a good risk-reward relationship—we can see how a significant portion of the upward move is left on the table.
🔸Results Review:
It is important to check the Max Drawdown. This value should ideally not exceed 10% of your capital. Consider adjusting the trade size to ensure this threshold is not surpassed.
Remember to include the correct values for commission and slippage according to the symbol and exchange where you are conducting the tests. Otherwise, the results will not be realistic.
If you are satisfied with the results, you may consider automating your trades. However, it is strongly recommended to use a small amount of capital or a demo account to test proper execution before committing real funds.
🔸Create alerts to trigger the DCA Bot:
Verify Messages: Ensure the message matches the one specified by the DCA Bot.
Multi-Pair Configuration: For multi-pair setups, enable the option to add the symbol in the correct format.
Signal Settings: Enable whether you want to receive long or short signals (Entry | TP | SL), copy and paste the the messages for the DCA Bots configured.
Alert Setup:
When creating an alert, set the condition to the indicator and choose "alert() function call only.
Enter any desired Alert Name.
Open the Notifications tab, enable Webhook URL, and paste the Webhook URL.
For more details, refer to the section: "How to use TradingView Custom Signals".
Finalize Alerts: Click Create, you're done! Alerts will now be sent automatically in the correct format.
🔷 INDICATOR SETTINGS
MA 1: Fast MA Length
MA 2: Slow MA Length
MA Calc: MA's Calculations (SMA,EMA, RMA,WMA)
TP Ratio: This is the take profit ratio relative to the stop loss, where the trade will be closed in profit.
BE Ratio: This is the breakeven ratio relative to the stop loss, where the stop loss will be updated to breakeven or if the MA2 is greater than this level.
Strategy: Order Type direction in which trades are executed.
Use Custom Test Period: When enabled signals only works in the selected time window. If disabled it will use all historical data available on the chart.
Test Start and End: Once the Custom Test Period is enabled, here you select the start and end date that you want to analyze.
Check Messages: Enable the table to review the messages to be sent to the bot.
Entry | TP | SL: Enable this options to send Buy Entry, Take Profit (TP), and Stop Loss (SL) signals.
Deal Entry and Deal Exit : Copy and paste the message for the deal start signal and close order at Market Price of the DCA Bot. This is the message that will be sent with the alert to the Bot, you must verify that it is the same as the bot so that it can process properly so that it executes and starts the trade.
DCA Bot Multi-Pair: You must activate it if you want to use the signals in a DCA Bot Multi-pair in the text box you must enter (using the correct format) the symbol in which you are creating the alert, you can check the format of each symbol when you create the bot.
👨🏻💻💭 We hope this tool helps enhance your trading. Your feedback is invaluable, so feel free to share any suggestions for improvements or new features you'd like to see implemented.
__
The information and publications within the 3Commas TradingView account are not meant to be and do not constitute financial, investment, trading, or other types of advice or recommendations supplied or endorsed by 3Commas and any of the parties acting on behalf of 3Commas, including its employees, contractors, ambassadors, etc.

Dollar Cost Averaging (DCA) | FractalystWhat's the purpose of this strategy?
The purpose of dollar cost averaging (DCA) is to grow investments over time using a disciplined, methodical approach used by many top institutions like MicroStrategy and other institutions.
Here's how it functions:
Dollar Cost Averaging (DCA): This technique involves investing a set amount of money regularly, regardless of market conditions. It helps to mitigate the risk of investing a large sum at a peak price by spreading out your investment, thus potentially lowering your average cost per share over time.
Regular Contributions: By adding money to your investments on a pre-determined frequency and dollar amount defined by the user, you take advantage of compounding. The script will remind you to contribute based on your chosen schedule, which can be weekly, bi-weekly, monthly, quarterly, or yearly. This systematic approach ensures that your returns can earn their own returns, much like interest on savings but potentially at a higher rate.
Technical Analysis: The strategy employs a market trend ratio to gauge market sentiment. It calculates the ratio of bullish vs bearish breakouts across various timeframes, assigning this ratio a percentage-based score to determine the directional bias. Once this score exceeds a user-selected percentage, the strategy looks to take buy entries, signaling a favorable time for investment based on current market trends.
Fundamental Analysis: This aspect looks at the health of the economy and companies within it to determine bullish market conditions. Specifically, we consider:
Specifically, it considers:
Interest Rate: High interest rates can affect borrowing costs, potentially slowing down economic growth or making stocks less attractive compared to fixed income.
Inflation Rate: Inflation erodes purchasing power, but moderate inflation can be a sign of a healthy economy. We look for investments that might benefit from or withstand inflation.
GDP Rate: GDP growth indicates the overall health of the economy; we aim to invest in sectors poised to grow with the economy.
Unemployment Rate: Lower unemployment typically signals consumer confidence and spending power, which can boost certain sectors.
By integrating these elements, the strategy aims to:
Reduce Investment Volatility: By spreading out your investments, you're less impacted by short-term market swings.
Enhance Growth Potential: Using both technical and fundamental filters helps in choosing investments that are more likely to appreciate over time.
Manage Risk: The strategy aims to balance the risk of market timing by investing consistently and choosing assets wisely based on both economic data and market conditions.
----
What are Regular Contributions in this strategy?
Regular Contributions involve adding money to your investments on a pre-determined frequency and dollar amount defined by the user. The script will remind you to contribute based on your chosen schedule, which can be weekly, bi-weekly, monthly, quarterly, or yearly. This systematic approach ensures that your returns can earn their own returns, much like interest on savings but potentially at a higher rate.
----
How do regular contributions enhance compounding and reduce timing risk?
Enhances Compounding: Regular contributions leverage the power of compounding, where returns on investments can generate their own returns, potentially leading to exponential growth over time.
Reduces Timing Risk: By investing regularly, the strategy minimizes the risk associated with trying to time the market, spreading out the investment cost over time and potentially reducing the impact of volatility.
Automated Reminders: The script reminds users to make contributions based on their chosen schedule, ensuring consistency and discipline in investment practices, which is crucial for long-term success.
----
How does the strategy integrate technical and fundamental analysis for investors?
A: The strategy combines technical and fundamental analysis in the following manner:
Technical Analysis: It uses a market trend ratio to determine the directional bias by calculating the ratio of bullish vs bearish breakouts. Once this ratio exceeds a user-selected percentage threshold, the strategy signals to take buy entries, optimizing the timing within the given timeframe(s).
Fundamental Analysis: This aspect assesses the broader economic environment to identify sectors or assets that are likely to benefit from current economic conditions. By understanding these fundamentals, the strategy ensures investments are made in assets with strong growth potential.
This integration allows the strategy to select investments that are both technically favorable for entry and fundamentally sound, providing a comprehensive approach to investment decisions in the crypto, stock, and commodities markets.
----
How does the strategy identify market structure? What are the underlying calculations?
Q: How does the strategy identify market structure?
A: The strategy identifies market structure by utilizing an efficient logic with for loops to pinpoint the first swing candle that features a pivot of 2. This marks the beginning of the break of structure, where the market's previous trend or pattern is considered invalidated or changed.
What are the underlying calculations for identifying market structure?
A: The underlying calculations involve:
Identifying Swing Points: The strategy looks for swing highs (marked with blue Xs) and swing lows (marked with red Xs). A swing high is identified when a candle's high is higher than the highs of the candles before and after it. Conversely, a swing low is when a candle's low is lower than the lows of the candles before and after it.
Break of Structure (BOS):
Bullish BOS: This occurs when the price breaks above the swing high level of the previous structure, indicating a potential shift to a bullish trend.
Bearish BOS: This happens when the price breaks below the swing low level of the previous structure, signaling a potential shift to a bearish trend.
Structural Liquidity and Invalidation:
Structural Liquidity: After a break of structure, liquidity levels are updated to the first swing high in a bullish BOS or the first swing low in a bearish BOS.
Structural Invalidation: If the price moves back to the level of the first swing low before the bullish BOS or the first swing high before the bearish BOS, it invalidates the break of structure, suggesting a potential reversal or continuation of the previous trend.
This method provides users with a technical approach to filter market regimes, offering an advantage by minimizing the risk of overfitting to historical data, which is often a concern with traditional indicators like moving averages.
By focusing on identifying pivotal swing points and the subsequent breaks of structure, the strategy maintains a balance between sensitivity to market changes and robustness against historical data anomalies, ensuring a more adaptable and potentially more reliable market analysis tool.
What entry criteria are used in this script?
The script uses two entry models for trading decisions: BreakOut and Fractal.
Underlying Calculations:
Breakout: The script records the most recent swing high by storing it in a variable. When the price closes above this recorded level, and all other predefined conditions are satisfied, the script triggers a breakout entry. This approach is considered conservative because it waits for the price to confirm a breakout above the previous high before entering a trade. As shown in the image, as soon as the price closes above the new candle (first tick), the long entry gets taken. The stop-loss is initially set and then moved to break-even once the price moves in favor of the trade.
Fractal: This method involves identifying a swing low with a period of 2, which means it looks for a low point where the price is lower than the two candles before and after it. Once this pattern is detected, the script executes the trade. This is an aggressive approach since it doesn't wait for further price confirmation. In the image, this is represented by the 'Fractal 2' label where the script identifies and acts on the swing low pattern.
----
How does the script calculate trend score? What are the underlying calculations?
Market Trend Ratio: The script calculates the ratio of bullish to bearish breakouts. This involves:
Counting Bullish Breakouts: A bullish breakout is counted when the price breaks above a recent swing high (as identified in the strategy's market structure analysis).
Counting Bearish Breakouts: A bearish breakout is counted when the price breaks below a recent swing low.
Percentage-Based Score: This ratio is then converted into a percentage-based score:
For example, if there are 10 bullish breakouts and 5 bearish breakouts in a given timeframe, the ratio would be 10:5 or 2:1. This could be translated into a score where 66.67% (10/(10+5) * 100) represents the bullish trend strength.
The score might be calculated as (Number of Bullish Breakouts / Total Breakouts) * 100.
User-Defined Threshold: The strategy uses this score to determine when to take buy entries. If the trend score exceeds a user-defined percentage threshold, it indicates a strong enough bullish trend to justify a buy entry. For instance, if the user sets the threshold at 60%, the script would look for a buy entry when the trend score is above this level.
Timeframe Consideration: The calculations are performed across the timeframes specified by the user, ensuring the trend score reflects the market's behavior over different periods, which could be daily, weekly, or any other relevant timeframe.
This method provides a quantitative measure of market trend strength, helping to make informed decisions based on the balance between bullish and bearish market movements.
What type of stop-loss identification method are used in this strategy?
This strategy employs two types of stop-loss methods: Initial Stop-loss and Trailing Stop-Loss.
Underlying Calculations:
Initial Stop-loss:
ATR Based: The strategy uses the Average True Range (ATR) to set an initial stop-loss, which helps in accounting for market volatility without predicting price direction.
Calculation:
- First, the True Range (TR) is calculated for each period, which is the greatest of:
- Current Period High - Current Period Low
- Absolute Value of Current Period High - Previous Period Close
- Absolute Value of Current Period Low - Previous Period Close
- The ATR is then the moving average of these TR values over a specified period, typically 14 periods by default. This ATR value can be used to set the stop-loss at a distance from the entry price that reflects the current market volatility.
Swing Low Based:
For this method, the stop-loss is set based on the most recent swing low identified in the market structure analysis. This approach uses the lowest point of the recent price action as a reference for setting the stop-loss.
Trailing Stop-Loss:
The strategy uses structural liquidity and structural invalidation levels across multiple timeframes to adjust the stop-loss once the trade is profitable. This method involves:
Detecting Structural Liquidity: After a break of structure, the liquidity levels are updated to the first swing high in a bullish scenario or the first swing low in a bearish scenario. These levels serve as potential areas where the price might find support or resistance, allowing the stop-loss to trail the price movement.
Detecting Structural Invalidation: If the price returns to the level of the first swing low before a bullish break of structure or the first swing high before a bearish break of structure, it suggests the trend might be reversing or invalidating, prompting the adjustment of the stop-loss to lock in profits or minimize losses.
By using these methods, the strategy dynamically adjusts the initial stop-loss based on market volatility, helping to protect against adverse price movements while allowing for enough room for trades to develop. The ATR-based stop-loss adapts to the current market conditions by considering the volatility, ensuring that the stop-loss is not too tight during volatile periods, which could lead to premature exits, nor too loose during calm markets, which might result in larger losses. Similarly, the swing low based stop-loss provides a logical exit point if the market structure changes unfavorably.
Each market behaves differently across various timeframes, and it is essential to test different parameters and optimizations to find out which trailing stop-loss method gives you the desired results and performance. This involves backtesting the strategy with different settings for the ATR period, the distance from the swing low, and how the trailing stop-loss reacts to structural liquidity and invalidation levels.
Through this process, you can tailor the strategy to perform optimally in different market environments, ensuring that the stop-loss mechanism supports the trade's longevity while safeguarding against significant drawdowns.
What type of break-even and take profit identification methods are used in this strategy? What are the underlying calculations?
For Break-Even:
Percentage (%) Based:
Moves the initial stop-loss to the entry price when the price reaches a certain percentage above the entry.
Calculation:
Break-even level = Entry Price * (1 + Percentage / 100)
Example:
If the entry price is $100 and the break-even percentage is 5%, the break-even level is $100 * 1.05 = $105.
Risk-to-Reward (RR) Based:
Moves the initial stop-loss to the entry price when the price reaches a certain RR ratio.
Calculation:
Break-even level = Entry Price + (Initial Risk * RR Ratio)
For TP
- You can choose to set a take profit level at which your position gets fully closed.
- Similar to break-even, you can select either a percentage (%) or risk-to-reward (RR) based take profit level, allowing you to set your TP1 level as a percentage amount above the entry price or based on RR.
What's the day filter Filter, what does it do?
The day filter allows users to customize the session time and choose the specific days they want to include in the strategy session. This helps traders tailor their strategies to particular trading sessions or days of the week when they believe the market conditions are more favorable for their trading style.
Customize Session Time:
Users can define the start and end times for the trading session.
This allows the strategy to only consider trades within the specified time window, focusing on periods of higher market activity or preferred trading hours.
Select Days:
Users can select which days of the week to include in the strategy.
This feature is useful for excluding days with historically lower volatility or unfavorable trading conditions (e.g., Mondays or Fridays).
Benefits:
Focus on Optimal Trading Periods:
By customizing session times and days, traders can focus on periods when the market is more likely to present profitable opportunities.
Avoid Unfavorable Conditions:
Excluding specific days or times can help avoid trading during periods of low liquidity or high unpredictability, such as major news events or holidays.
What tables are available in this script?
- Summary: Provides a general overview, displaying key performance parameters such as Net Profit, Profit Factor, Max Drawdown, Average Trade, Closed Trades and more.
Total Commission: Displays the cumulative commissions incurred from all trades executed within the selected backtesting window. This value is derived by summing the commission fees for each trade on your chart.
Average Commission: Represents the average commission per trade, calculated by dividing the Total Commission by the total number of closed trades. This metric is crucial for assessing the impact of trading costs on overall profitability.
Avg Trade: The sum of money gained or lost by the average trade generated by a strategy. Calculated by dividing the Net Profit by the overall number of closed trades. An important value since it must be large enough to cover the commission and slippage costs of trading the strategy and still bring a profit.
MaxDD: Displays the largest drawdown of losses, i.e., the maximum possible loss that the strategy could have incurred among all of the trades it has made. This value is calculated separately for every bar that the strategy spends with an open position.
Profit Factor: The amount of money a trading strategy made for every unit of money it lost (in the selected currency). This value is calculated by dividing gross profits by gross losses.
Avg RR: This is calculated by dividing the average winning trade by the average losing trade. This field is not a very meaningful value by itself because it does not take into account the ratio of the number of winning vs losing trades, and strategies can have different approaches to profitability. A strategy may trade at every possibility in order to capture many small profits, yet have an average losing trade greater than the average winning trade. The higher this value is, the better, but it should be considered together with the percentage of winning trades and the net profit.
Winrate: The percentage of winning trades generated by a strategy. Calculated by dividing the number of winning trades by the total number of closed trades generated by a strategy. Percent profitable is not a very reliable measure by itself. A strategy could have many small winning trades, making the percent profitable high with a small average winning trade, or a few big winning trades accounting for a low percent profitable and a big average winning trade. Most mean-reversion successful strategies have a percent profitability of 40-80% but are profitable due to risk management control.
BE Trades: Number of break-even trades, excluding commission/slippage.
Losing Trades: The total number of losing trades generated by the strategy.
Winning Trades: The total number of winning trades generated by the strategy.
Total Trades: Total number of taken traders visible your charts.
Net Profit: The overall profit or loss (in the selected currency) achieved by the trading strategy in the test period. The value is the sum of all values from the Profit column (on the List of Trades tab), taking into account the sign.
- Monthly: Displays performance data on a month-by-month basis, allowing users to analyze performance trends over each month and year.
- Weekly: Displays performance data on a week-by-week basis, helping users to understand weekly performance variations.
- UI Table: A user-friendly table that allows users to view and save the selected strategy parameters from user inputs. This table enables easy access to key settings and configurations, providing a straightforward solution for saving strategy parameters by simply taking a screenshot with Alt + S or ⌥ + S.
User-input styles and customizations:
Please note that all background colors in the style are disabled by default to enhance visualization.
How to Use This Strategy to Create a Profitable Edge and Systems?
Choose Your Strategy mode:
- Decide whether you are creating an investing strategy or a trading strategy.
Select a Market:
- Choose a one-sided market such as stocks, indices, or cryptocurrencies.
Historical Data:
- Ensure the historical data covers at least 10 years of price action for robust backtesting.
Timeframe Selection:
- Choose the timeframe you are comfortable trading with. It is strongly recommended to use a timeframe above 15 minutes to minimize the impact of commissions/slippage on your profits.
Set Commission and Slippage:
- Properly set the commission and slippage in the strategy properties according to your broker/prop firm specifications.
Parameter Optimization:
- Use trial and error to test different parameters until you find the performance results you are looking for in the summary table or, preferably, through deep backtesting using the strategy tester.
Trade Count:
- Ensure the number of trades is 200 or more; the higher, the better for statistical significance.
Positive Average Trade:
- Make sure the average trade is above zero.
(An important value since it must be large enough to cover the commission and slippage costs of trading the strategy and still bring a profit.)
Performance Metrics:
- Look for a high profit factor, and net profit with minimum drawdown.
- Ideally, aim for a drawdown under 20-30%, depending on your risk tolerance.
Refinement and Optimization:
- Try out different markets and timeframes.
- Continue working on refining your edge using the available filters and components to further optimize your strategy.
What makes this strategy original?
Incorporation of Fundamental Analysis:
This strategy integrates fundamental analysis by considering key economic indicators such as interest rates, inflation, GDP growth, and unemployment rates. These fundamentals help in assessing the broader economic health, which in turn influences sector performance and market trends. By understanding these economic conditions, the strategy can identify sectors or assets that are likely to thrive, ensuring investments are made in environments conducive to growth. This approach allows for a more informed investment decision, aligning technical entries with fundamentally strong market conditions, thus potentially enhancing the strategy's effectiveness over time.
Technical Analysis Without Classical Methods:
The strategy's technical analysis diverges from traditional methods like moving averages by focusing on market structure through a trend score system.
Instead of using lagging indicators, it employs a real-time analysis of market trends by calculating the ratio of bullish to bearish breakouts. This provides several benefits:
Immediate Market Sentiment: The trend score system reacts more dynamically to current market conditions, offering insights into the market's immediate sentiment rather than historical trends, which can often lag behind real-time changes.
Reduced Overfitting: By not relying on moving averages or similar classical indicators, the strategy avoids the common pitfall of overfitting to historical data, which can lead to poor performance in new market conditions. The trend score provides a fresh perspective on market direction, potentially leading to more robust trading signals.
Clear Entry Signals: With the trend score, entry decisions are based on a clear percentage threshold, making the strategy's decision-making process straightforward and less subjective than interpreting moving average crossovers or similar signals.
Regular Contributions and Reminders:
The strategy encourages regular investments through a system of predefined frequency and amount, which could be weekly, bi-weekly, monthly, quarterly, or yearly. This systematic approach:
Enhances Compounding: Regular contributions leverage the power of compounding, where returns on investments can generate their own returns, potentially leading to exponential growth over time.
Reduces Timing Risk: By investing regularly, the strategy minimizes the risk associated with trying to time the market, spreading out the investment cost over time and potentially reducing the impact of volatility.
Automated Reminders: The script reminds users to make contributions based on their chosen schedule, ensuring consistency and discipline in investment practices, which is crucial for long-term success.
Long-Term Wealth Building:
Focused on long-term wealth accumulation, this strategy:
Promotes Patience and Discipline: By emphasizing regular contributions and a disciplined approach to both entry and risk management, it aligns with the principles of long-term investing, discouraging impulsive decisions based on short-term market fluctuations.
Diversification Across Asset Classes: Operating across crypto, stocks, and commodities, the strategy provides diversification, which is a key component of long-term wealth building, reducing risk through varied exposure.
Growth Over Time: The strategy's design to work with the market's natural growth cycles, supported by fundamental analysis, aims for sustainable growth rather than quick profits, aligning with the goals of investors looking to build wealth over decades.
This comprehensive approach, combining fundamental insights, innovative technical analysis, disciplined investment habits, and a focus on long-term growth, offers a unique and potentially effective pathway for investors seeking to build wealth steadily over time.
Terms and Conditions | Disclaimer
Our charting tools are provided for informational and educational purposes only and should not be construed as financial, investment, or trading advice. They are not intended to forecast market movements or offer specific recommendations. Users should understand that past performance does not guarantee future results and should not base financial decisions solely on historical data.
Built-in components, features, and functionalities of our charting tools are the intellectual property of @Fractalyst Unauthorized use, reproduction, or distribution of these proprietary elements is prohibited.
- By continuing to use our charting tools, the user acknowledges and accepts the Terms and Conditions outlined in this legal disclaimer and agrees to respect our intellectual property rights and comply with all applicable laws and regulations.
