X48 - Strategy | BreakOut & Consecutive (11in1) + Alert | V.1.2================== Read This First Before Use This Strategy ==============
*********** Please be aware that this strategy is not a guarantee of success and may lead to losses.
*********** Trading involves risk and you should always do your own research before making any decisions.
================= Thanks Source Script and Explain This Strategy ===================
► Description
Write a detailed and meaningful description that allows users to understand how your script is original, what it does, how it does it and how to use it
This Strategy Are Combine Strategy and Indicators Alert Function For Systematic Trading User.
Strategy List, Thanks For Original Source Script , From Tradingview Build-in Script From fmzquant Github
// Channel BreakOut Strategy : Calculate BreakOut Zone For Buy and Sell.
// Consecutive Bars UP/Down Strategy : The consecutive bars up/down strategy is a trading strategy used to identify potential buy and sell signals in the stock market. This strategy involves looking for a series of bars (or candles) that are either all increasing or all decreasing in price. If the bars are all increasing, it can be a signal to buy, and if the bars are all decreasing, it can be a signal to sell. This strategy can be used on any timeframe, from a daily chart to an intraday chart.
// 15m Range Length SD : Range Of High and Low Candle Price and Lookback For Calculate Buy and Sell.
Indicators Are Simple Source Script (Almost I'm Chating With CHAT-GPT and Convert pinescript V4 to V5 again for complete almost script and combine after)
// SwingHigh and SwingLow Plot For SL (StopLoss by Last Swing).
// Engulfing and 3 Candle Engulfing Plot.
// Stochastic RSI for Plot and Fill Background Paint and Plot TEXT For BULL and BEAR TREND.
// MA TYPE MODE are plot 2 line of MA Type (EMA, SMA, HMA, WMA, VWMA) for Crossover and Crossunder.
// Donchian Fans MODE are Plot Dot Line With Triangle Degree Bull Trend is Green Plot and Bear Trend is Red Plot.
// Ichimoku Cloud Are Plot Cloud A-B For Bull and Bear Trend.
// RSI OB and OS for TEXT PLOT 'OB' , 'OS' you will know after OB and OS, you can combo with other indicators that's make you know what's the similar trend look like?
// MACD for Plot Diamond when MACD > 0 and MACD < 0, you can combo with other indicators that's make you know what's the similar trend look like?
Alert Can Alert Sent When Buy and Sell or TP and SL, you can adjust text to alert sent by your self or use default setting.
========== Let'e Me Explain How To Use This Strategy =============
========== Properties Setting ==========
// Capital : Default : 1,000 USDT For Alot Of People Are Beginner Investor = It's Capital Your Cash For Investment
// Ordersize : Default Are Setting 5% / Order We Call Compounded
========== INPUT Setting ==========
// First Part Use Must Choose Checkbox For Use of Strategy and Choose TP/SL by Swing or % (can choose both)
// In Detail Of Setting Are Not Too Much, Please Read The Header Of Setting Before Change The Value
// For The Indicator In List You Want To Add Just Check ✅ From MODE Setting, It's Show On Your Chart
// You Can Custom TP/SL % You Want
========== ##### No trading strategy is guaranteed to be 100% successful. ###### =========
For Example In My Systematic Trading
Select 1/3 Strategy Setting TP/SL % Match With Timeframe TP Long Are Not Set It's Can 161.8 - 423.6% but Short Position Are Not Than 100% Just Fine From Your Aset
Choose Indicators For Make Sure Trend and Strategy are the same way like Strategy are Long Position but MACD and Sto background is bear. that's mean this time not open position.
Donchian Fans is Simple Support and Ressistant If You Don't Know How To Plot That's, This indicator plot a simple for you ><.
Make Sure With Engulfing and 3 Candle Engulfing If You Don't Know, What's The Engulfing, This Indicator are plot for you too ><.
For a Big Trend You can use Ichimoku Cloud For Check Trend, Candle Upper Than Cloud or Lower Than Cloud for Bull and Bear Trend.
Analisis Trend

Extended Price Volume Trend Strategy : EducationalThe Extended Price Volume Trend (EPVT) is a technical indicator that is used to identify potential trend changes and measure the strength of a trend. In this strategy, we combine the EPVT with other indicators to create a trading system that aims to capture trend reversals and momentum shifts.
The EPVT indicator is calculated by taking the cumulative volume and multiplying it by the percentage change in price. We then find the highest and lowest values of this indicator over a certain period of time to determine the baseline. The difference between the EPVT and the baseline is then plotted on a chart to create the EPVT line.
To use this indicator for trading, we look for crossovers of the EPVT line with zero. When the EPVT crosses above zero, it indicates that buying pressure is increasing, and we may consider taking a long position. Conversely, when the EPVT crosses below zero, it indicates that selling pressure is increasing, and we may consider taking a short position.
To further refine our trading signals, we use three take-profit levels, which we set as a percentage of the current EPVT value. We also use a simple moving average to provide additional confirmation of trend changes.
In summary, the EPVT trading strategy is a technical analysis-based approach to trading that aims to identify potential trend reversals and momentum shifts. By combining the EPVT indicator with other technical tools, we can create a comprehensive trading system that provides clear entry and exit signals for both long and short positions. Please note that this strategy is for educational purposes only and should not be taken as financial advice.

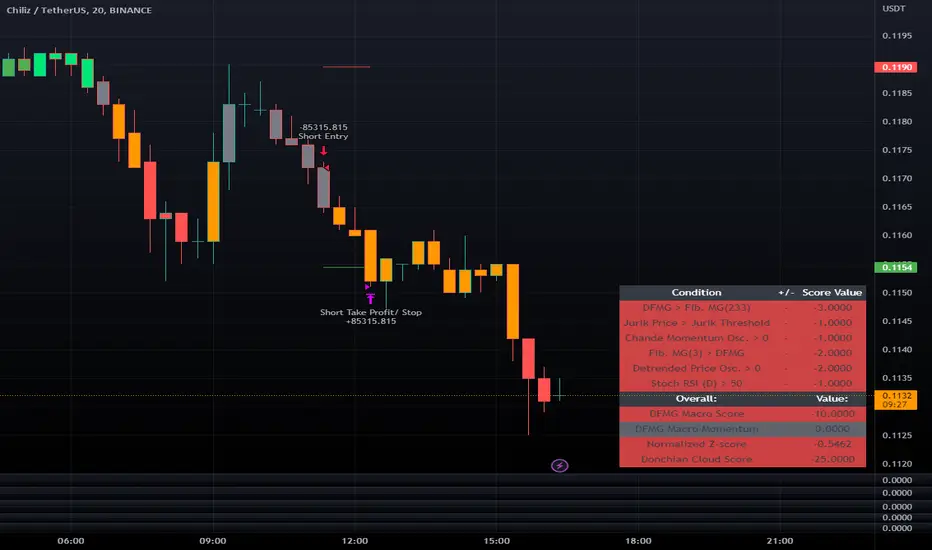
LeafAlgo Premium Macro StrategiesA "macro score", as defined here, is created by giving various weights to different signals and adding them together to get one smooth score. Positive or negative values are assigned to each of the signals depending on if the statement is true or false (e.g. DPO > 0: +1, DPO < 0: -1). This manner of strategy allows for a subset of the available signals to be present at one time as opposed to every technical signal having to be active in order for a long/short signal to trigger.
This strategy contains SIX different macro score strategies -- "Base DFMA", "Base DFMG", "Ichimoku", "TSI", "Donchian DFMA", and "Donchian DFMG". These strategies have the signals and weights pre-determined in the code. The "Base DFMA" strategy is based on our Democratic Fibonacci Moving Average (DFMA) indicator; the "Donchian DFMA" is the same as the base DFMA strategy, but with a signal from our Donchian Cloud Score indicator as added confluence. The "Base DFMG" strategy is based on our Democratic Fibonacci McGinley Dynamics (DFMG) indicator; the "Donchian DFMG" is the same, but with the Donchian Cloud Score as added confluence. The "Ichimoku" strategy is based on the major sub-indicators found within an Ichimoku Cloud in addition to our Donchian Cloud Score. The "TSI" strategy is based on the True Strength Index.
The ability to select your strategy of choice can be found at the top of the strategy settings under "Strategy Options", then in the drop-down menu labeled "Strategy Choice".
The DFMA - Democratic Fibonacci Moving Average - is a separate indicator that we have released that takes 10 different Fibonacci MAs (lengths of 3 to 233, at Fibonacci intervals) and averages them to form the DFMA line. This helps by creating a consensus on the trend based on moving averages alone. Crossovers of the DFMA with the various Fib MA lengths as well as a cross of the price source and these lines can provide adequate long and short signals. In the two DFMA strategies, the heaviest weights have been given to crosses of the DFMA line/Fib MA (233) as well as the crosses of the Fib MA (3)/DFMA. Additionally, there are thresholds for DPO ( Detrended Price Oscillator , above or below 0), CMO ( Chande Momentum Oscillator , above or below 0), Jurik Volatility Bands (above or below 0), and Stoch RSI (above or below 50). These four signals hold a lighter weight than the MA cross signals. The macro score itself ranges between -10 and 10. In addition to the macro score line, a momentum line (sourced by the macro score itself) has been included. A crossover/crossunder of the macro score and the macro momentum line is included into the long/short signal syntax in addition to a threshold for the macro score.
The DFMG - Democratic Fibonacci McGinley Dynamics - is a separate indicator that we have released that takes 10 different Fibonacci McGinley Dynamic liness (lengths of 3 to 233, at Fibonacci intervals) and averages them to form the DFMG line. This helps by creating a consensus on the trend based on moving averages alone. Crossovers of the DFMG with the various Fib MG lengths as well as a cross of the price source and these lines can provide adequate long and short signals. This strategy has the signals and weights pre-determined in the code. Heaviest weights have been given to crosses of the DFMG line/ McGinley (233) as well as the crosses of the McGinley (3)/DFMG. Additionally, there are thresholds for DPO ( Detrended Price Oscillator , above or below 0), CMO ( Chande Momentum Oscillator , above or below 0), Jurik Volatility Bands (above or below 0), and Stoch RSI (above or below 50). These four signals hold a lighter weight than the McGinley cross signals. The macro score itself ranges between -10 and 10. In addition to the macro score line, a momentum line (sourced by the macro score itself) has been included. A crossover/crossunder of the macro score and the macro momentum line is included into the long/short signal syntax in addition to a threshold for the macro score.
For the Ichimoku macro score, five signals were considered and weighted equally:
- Kijun-sen < Ichimoku Source
- Tenkan-sen < Ichimoku Source
- Kijun-sen > Chikou-span
- Tenkan-sen > Kijun-sen
- Senkou Span A > Senkou Span B
In addition to these factors, the Ichimoku strategy utilizes the Donchian Cloud Score in the long and short entry signals. Thus, the Donchian Cloud settings are applicable to this strategy.
For the True Strength Index strategy, the heaviest weights have been given to various TSI signals, including a crossover/crossunder of TSI signal and TSI value, a threshold for the TSI Signal (above or below 0), and a crossover/crossunder of the CMO ( Chande Momentum Oscillator ) and the TSI signal line. Additionally, there are thresholds for DPO ( Detrended Price Oscillator , above or below 0), Jurik Volatility Bands (above or below 0), and Stoch RSI (above or below 50). These three signals hold a lighter weight than the three TSI signals. The macro score itself ranges between -10 and 10. In addition to the macro score line, a momentum line (sourced by the macro score itself) has been included. A crossover/crossunder of the macro score and the macro momentum line is included into the long/short signal syntax in addition to a threshold for the macro score.
The Donchian Cloud Score is derived from a set of 5 Donchian channels (upper, lower, and basis plotted) defaulted to lengths of 25, 50, 100, 150, and 200. A set of conditions associated with the channels aims to determine ranging versus trending markets. Weights are given to these conditions accordingly, then tallied up to determine the "cloud score", ranging between -25 and 25. In general, a ranging market is determined by a cloud score between -10 and 10, while a positive trending market has a score higher than 10 and a negative trending market has a score lower than -10. That said, long and short thresholds similar to the macro score itself are included in the user settings and set to a default of 5 or -5. The cloud score is plotted as a line in the underlay with coloration reflecting ranging or trending markets (green color above the long threshold, gray between the thresholds, and red below the short threshold). The cloud score is incorporated into the strategy syntax for long and short positions in that the score must be above or below the set threshold for a trade to be placed. A breakdown for the Donchian scoring is as follows:
- Broke the 25-length DC (DC(25)) upper band in the previous 3 bars - +1 if true, 0 if false
- Broke the DC(50) upper band in the previous 3 bars - +2 if true, 0 if false
- Broke the DC(100) upper band in the previous 3 bars - +3 if true, 0 if false
- Broke the DC(150) upper band in the previous 3 bars - +4 if true, 0 if false
- Broke the DC(200) upper band in the previous 3 bars - +5 if true, 0 if false
- Broke the DC(25) lower band in the previous 3 bars - -1 if true, 0 if false
- Broke the DC(50) lower band in the previous 3 bars - -2 if true, 0 if false
- Broke the DC(100) lower band in the previous 3 bars - -3 if true, 0 if false
- Broke the DC(150) lower band in the previous 3 bars - -4 if true, 0 if false
- Broke the DC(200) lower band in the previous 3 bars - -5 if true, 0 if false
- DC(25) basis line above the DC(50) basis line - +1 if true, -1 if false
- DC(25) basis line above the DC(100) basis line - +1 if true, -1 if false
- DC(25)basis line above the DC(150) basis line - +1 if true, -1 if false
- DC(25) basis line above the DC(200) basis line - +1 if true, -1 if false
- DC(50) basis line above the DC(100) basis line - +1 if true, -1 if false
- DC(50) basis line above the DC(150) basis line - +1 if true, -1 if false
- DC(50) basis line above the DC(200) basis line - +1 if true, -1 if false
- DC(100) basis line above the DC(150) basis line - +1 if true, -1 if false
- DC(100) basis line above the DC(200) basis line - +1 if true, -1 if false
- DC(150) basis line above the DC(200) basis line - +1 if true, -1 if false
Thresholds for both the respective macro score and the Donchian Cloud score have been included. Entry signals for each strategy require the score to be >= the respective thresholds for longs and <= the respective thresholds for shorts.
Additionally, a normalized z-score has been included. The z-score does not affect the entry and exit signals, however, it is displayed on the chart in the form of bar coloration. The z-score has been normalized to a range of -1 to +1. A z-score under -0.60 is displayed as a red bar color, a score between -0.60 and -0.2 is displayed as an orange bar color, a score between -0.2 and 0.2 is displayed as a gray bar color, a score between 0.2 and 0.6 is displayed as a lime bar color, and a score over 0.6 is displayed in green.
Data for each respective strategy will be displayed in an overlaid table. This includes the factors that comprise the macro score of choice, the values of each signal that adds up to the macro score, the macro score itself, the value of the momentum line of the macro score, the normalized z-score value, and the Donchian Cloud score (if applicable). Green coloration notes bullish sentiment within the signals or values, gray coloration is neutral, and red coloration notes bearish sentiment.
Take profit, stop loss, and trailing percentages are also included, found at the bottom of the Input tab under “TT and TTP” as well as “Stop Loss”. The take profit and stop loss levels will be reflected as green and red lines respectively on the chart as they occur. Make sure to understand the TP/SL ratio that you desire before use, as the desired hit rate/profitability percentage will be affected accordingly. The option for adding in a trailing stop has also been included, with options to choose between an ATR-based trail or a percentage-based trail. This strategy does NOT guarantee future returns. Apply caution in trading regardless of discretionary or algorithmic. Understand the concepts of risk/reward and the intricacies of each strategy choice before utilizing them in your personal trading.
Profitview/Pineconnector Settings:
If you wish to utilize Profitview’s automation system, find the included “Profitview Settings” under the Input tab of the strategy settings menu. If not, skip this section entirely as it can be left blank. Options will be “OPEN LONG TITLE”, “OPEN SHORT TITLE”, “CLOSE LONG TITLE”, and “CLOSE SHORT TITLE”. If you wished to trade SOL, for example, you would put “SOL LONG”, “SOL SHORT”, “SOL CLOSE LONG”, and “SOL CLOSE SHORT” in these areas. Within your Profitview extension, ensure that your Alerts all match these titles. To set an alert for use with Profitview, go to the “Alerts” tab in TradingView, then create an alert. Make sure that your desired asset and timeframe are currently displayed on your screen when creating the alert. Under the “Condition” option of the alert, select the strategy, then select the expiration time. If using TradingView Premium, this can be open-ended. Otherwise, select your desired expiration time and date. This can be updated whenever desired to ensure the strategy does not expire. Under “Alert actions”, nothing necessarily needs to be selected unless so desired. Leave the “Alert name” option empty. For the “Message”, delete the generated message and replace it with {{strategy.order.alert_message}} and nothing else. If using Pineconnector, follow the same directions for setting up an alert, but use the ",buy,,risk=" syntax as noted in the tooltips.
BankNifty 5min Supertrend Based StrategyBankNifty 5min Supertrend Based Strategy, Intraday.
Work Best at 5mint chart on BankNifty.
The strategy is designed to trade using the Supertrend indicator with session-based rules, and risk management. It allows for customization through input variables and aims to provide a clear visual representation of the Supertrend by changing the color .
The script also includes input variables for the trading session and date range, which allows the trader to specify the time period in which they want the strategy to run. The session variable specifies the start and end times of the trading session, which in this case is set to the Indian trading session from 9:15 am to 3:10 pm.
The strategy starts by defining input variables such as the session time, start and end date for the backtesting, the length of the ATR, and the Supertrend factor. It also includes options for delay at session start and stop loss points and trail percentage .
The code then checks if the current time is within the specified session and date range . If it is, the Supertrend and its direction are calculated using the defined input variables. The strategy then waits for N numbers of candles (defined by the User) to form at the start of every session i.e. 09:15 AM before entering a trade.
The entry and exit conditions for long and short trades are defined based on the change in the Supertrend direction and the number of candles formed at the session start i.e. 09:15 AM . After that, it takes entry and exit for long and short trades on the change in the Supertrend direction . Stop-loss and trailing stop-loss are also defined based on the input variables.
Stop-loss (Defined by the user) is fixed points either below or above the Entry Price for Long and Short entries.
The Supertrend plot is displayed with changing colors depending on the direction. Finally, the strategy closes all trades at the end of the session if there are any open trades.
Overall, this strategy aims to trade with the Supertrend indicator using session-based rules and risk management.
However, as with any trading strategy, it is important to thoroughly test it before using it in live trading .

8 Day Run - Momentum StrategyInspired by Linda Bradford Raschke.
Entry criteria:
This strategy is used to capture momentum effects on the daily periodicities. Once prices have had a run of 8 or more consecutive closes above or below the 5-period simple moving average the strategy is primed to trade.
It will then enter a short on the first close above the 5sma after a run of 8 or more closes below the 5sma (it will enter a long when the price closes below the 5sma after a run of 8 or more closes above the 5sma).
Exit criteria:
All trades are exited on the first close back above/ below the 5sma.

Minervini Pullback Strategy_Trend-Template QualifierGeneral Description and Unique Features of this Script
Introducing the ultimate trend-following (long-only) strategy that offers a unique feature you won't find anywhere else!
1. Our script/strategy utilizes Mark Minervini's Trend-Template as a qualifier for identifying stocks and other financial securities in confirmed uptrends. Mark Minervini, a 3x US Investment Champion, developed the Trend-Template, which covers eight different and independent characteristics that can be adjusted and optimized in this trend-following strategy to ensure the best results. The strategy will only trigger buy-signals in case the optimized qualifiers are being met.
2. Our strategy is based on supply/demand balance in the market, making it timeless and effective across all timeframes. Whether you're day trading using 1- or 5-min charts or swing-trading using daily charts, this strategy can be applied and works very well.
3. We also incorporate technical indicators such as RSI and MACD to identify low-risk pullback entries in the context of confirmed uptrends. By doing so, the risk profile of this strategy and drawdowns are being reduced to an absolute minimum, giving you peace of mind while trading.
Minervini’s Trend-Template and the ‘Stage-Analysis’ of the Markets
This strategy is a so-called 'long-only' strategy. This means that we only take long positions, short positions are not considered.
The best market environment for such strategies are periods of stable upward trends in the so-called stage 2 - uptrend.
In stable upward trends, we increase our market exposure and risk.
In sideways markets and downward trends or bear markets, we reduce our exposure very quickly or go 100% to cash and wait for the markets to recover and improve. This allows us to avoid major losses and drawdowns.
This simple rule gives us a significant advantage over most undisciplined traders and amateurs!
'The Trend is your Friend'. This is a very old but true quote.
What's behind it???
• 98% of stocks made their biggest gains in a Phase 2 upward trend.
• If a stock is in a stable uptrend, this is evidence that larger institutions are buying the stock sustainably.
• By focusing on stocks that are in a stable uptrend, the chances of profit are significantly increased.
• In a stable uptrend, investors know exactly what to expect from further price developments. This makes it possible to locate low-risk entry points.
The goal is not to buy at the lowest price – the goal is to buy at the right price!
Each stock goes through the same maturity cycle – it starts at stage 1 and ends at stage 4
Stage 1 – Neglect Phase – Consolidation
Stage 2 – Progressive Phase – Accumulation
Stage 3 – Topping Phase – Distribution
Stage 4 – Downtrend – Capitulation
This strategy focuses on identifying stocks in confirmed stage 2 uptrends. This in itself gives us an advantage over long-term investors and less professional traders.
By focusing on stocks in a stage 2 uptrend, we avoid losses in downtrends (stage 4) or less profitable consolidation phases (stages 1 and 3). We are fully invested and put our money to work for us, and we are fully invested when stocks are in their stage 2 uptrends.
But how can we use technical chart analysis to find stocks that are in a stable stage 2 uptrend?
Mark Minervini has developed the so-called 'trend template' for this purpose. This is an essential part of our JS-TechTrading pullback strategy. For our watchlists, only those individual values that meet the tough requirements of Minervini's trend template are eligible.
The Trend Template
• 200d MA increasing over a period of at least 1 month, better 4-5 months or longer
• 150d MA above 200d MA
• 50d MA above 150d MA and 200d MA
• Course above 50d MA, 150d MA and 200d MA
• Ideally, the 50d MA is increasing over at least 1 month
• Price at least 25% above the 52w low
• Price within 25% of 52w high
• High relative strength according to IBD.
We have developed an algorythm (for TradingView) that uses Minervini’s trend template as a qualifier. This means that the strategy only generates trading signals in case the selected elements of the trend template are being met. The user is fully flexible to adjust the requirements of this Trend-Template qualifier:
This strategy is normally applied to the daily chart ideal for selecting individual stocks for trend-following strategies. Nevertheless, Minervini’s principles are timeless and this alogrithmic strategy with the Trend-Template qualifier can also be applied to any other timframe.
The qualifier #9 (RS-Ratings) can be modified and optimized in the strategy’s settings to fit your individual needs.
In general, it should be noted that ideally all 8/8 trend template criteria are met. Stocks or other securities that meet only some of these 8 criteria can also be very promising candidates for this strategy, provided that backtesting yields good results.
The Pullback Strategy
For the JS-TechTrading pullback strategy, only stocks and other financial instruments that meet the selected criteria of Mark Minervini's trend template are considered. If not, the strategy will not generate any signals.
Further prerequisites for generating a buy signal is that the individual value is in a short-term oversold state (RSI).
When the selling pressure is over and the continuation of the uptrend can be confirmed by the MACD after reaching a price low, a buy signal is issued by the pullback strategy.
Stop-loss limits and profit targets can be set variably.
Relative Strength Index (RSI)
The Relative Strength Index (RSI) is a technical indicator developed by Welles Wilder in 1978. The RSI is used to perform a market value analysis and identify the strength of a trend as well as overbought and oversold conditions. The indicator is calculated on a scale from 0 to 100 and shows how much an asset has risen or fallen relative to its own price in recent periods.
The RSI is calculated as the ratio of average profits to average losses over a certain period of time. A high value of the RSI indicates an overbought situation, while a low value indicates an oversold situation. Typically, a value > 70 is considered an overbought threshold and a value < 30 is considered an oversold threshold. A value above 70 signals that a single value may be overvalued and a decrease in price is likely , while a value below 30 signals that a single value may be undervalued and an increase in price is likely.
For example, let's say you're watching a stock XYZ. After a prolonged falling movement, the RSI value of this stock has fallen to 26. This means that the stock is oversold and that it is time for a potential recovery. Therefore, a trader might decide to buy this stock in the hope that it will rise again soon.
Moving Average Convergence Divergence (MACD)
The MACD (Moving Average Convergence Divergence) is a technical indicator used in both short-term and long-term trading strategies. The indicator was developed by Gerald Appel and is one of the most well-known indicators for the stock market.
The MACD consists of two lines calculated by the difference between two moving averages. The first line is a fast moving average that targets a short period of time. The second line is a slow moving average that targets a longer period of time. In addition, a trigger line is calculated, which consists of another moving average of the MACD line.
The MACD line is the difference between the fast and slow moving average.
The greater the difference between the two lines, the more likely a subsequent price increase. The lower the difference, the more likely a subsequent price drop is.
If the MACD line crosses upwards over the trigger line, this is a buy signal that signals a potential price increase. If the MACD line crosses down below the trigger line, this is a sell signal that signals a potential price weakening.
This strategy is applicable to all timeframes and the relevant parameters for the underlying indicators (RSI and MACD) can be adjusted and optimized as needed.
Backtesting
Backtesting give outstanding results on all timeframes and drawdowns can be reduced to a minimum level. Swing-Traders (daily charts) will see that the strategy does not give any buy signals during market corrections and bear markets.
Settings for backtesting are:
- Period from Jan 2000 until now
- Starting capital 100k USD
- Position size = 25% of equity
- 0.01% commission = USD 2.50.- per Trade
Other comments
• This strategy has been designed to identify the most promising, highest probability entries and trades for each stock or other financial security.
• The trend-template qualifier is highly selective and filters out the most promising swing-trading entries. As a result, you will normally only find a single-digit number of trades for each stock or other financial security per year in case you apply this strategy for the daily charts. Shorter timeframes will result in a higher number of trades / year.
• As a result, traders need to apply this strategy for a full watchlist rather than just one financial security.

Self Optimizing Supertrend [Starbots]Self Optimizing Supertrend Strategy. (non-repainting)
Script constantly tests 15 Supertrend combinations for maximum profitability and trades based on the best performing combination.
You will notice that signal lines switch after a bar close sometimes, this is when the strategy optimizes to the better combination and change plots, strategy is dynamic.
---------------------------------------------------------------------------------------------------------
# Average True Range (ATR)
The Average True Range (ATR) is a tool used in technical analysis to measure volatility. Unlike many of today's popular indicators, the ATR is not used to indicate the direction of price. Rather, it is a metric used solely to measure volatility, especially volatility caused by price gaps or limit moves.
# Supertrend
A Super Trend is a trend following indicator similar to moving averages. It is plotted on price and the current trend can simply be determined by its placement vis-a-vis price. It is a very simple indicator and is constructed with the help of just two parameters- period and multiplier.
When we construct the Supertrend indicator strategy, the default parameters are 10 for Average True Range (ATR) and 3 for its multiplier. The average true range (ATR) plays a key role in ‘Supertrend’ as the indicator uses ATR to compute its value and it signals the degree of price volatility.
-----------------------------------------------------------------------------------------------------------
-Turn on Supertrend Profit Dashboard and spot the worst/best performing combination. You can change them to get the best performance overall.
-Backtesting Range - backtest within your desired time window. Example: 'from 01 / 01 /2020 to 01 / 01 /2023'.
-Optimizing range - you can decrease the amount of bars/data for optimizing script. This way you can keep it up to date to more recent market by selecting optimizing range to optimize it just from the recent 3-6months of data for example. Strategy before this selected range will normally trade (backtest) based on the fifth buying condition (5. Supertrend Factor) parameter in your menu (1.6 by default) if you turn this on.
*I recommend 'Optimizing Range' turned off actually, use max amount of available bars in your history for optimization script.
- Strategy is trading on the bar close without repaint. You can trade Long-Sell or Long- Short. Alerts available, insert webhook messages.
- Turn on Profit Calendar for better overview of how your strategy performs monthly/annualy
- Recommended ATR Length : 10 (default), higher timeframes usually performs good on the shorter period lengths 6-10, smaller timeframes on the larger ATR period length 10-20.
- Recommended Sources : hl2 (default Supertrend), close, hlc3, hlcc4 (when scalping/day trading and market is uptrending good, you can use 'volume' as a source, comes in handy)
- Recommended Smoothing Moving Average for ATR : We smooth the ATR calculation with moving average, traders usually use SMA as a moving average here, but you can use alternatives like EMA, HMA. Try them if this improves your results.
- Recommended TF : 15min, 30min, 1h, 2h, 4h, 8h, 1d (low timeframes works good if you have no fees like Binance currently do on BTC for example otherwise you probably want to use 1/2h+ chart)
- Supertrend Factor parameters : pre-set Supertrend Factors are very good and common in trading world, you don't need to change them, but you can do it at free will. Traders usually use Supertrend factor of 2 or 3, use parameters around this numbers.
- Notes window : add your custom comments in or save your webhook message text inside here for later use.
- Trading Session: in a session, you have to specify the time range for every day. It will trade only within this window and close trades when it's out. Session from 9am to 5pm will look like that: 0900-1700 or 7am to 4:30pm 0700-1630. After the colon, you can specify days of the week for your trading session. 1234567 trading all days, 23456 – Monday to Friday ('1 is Sunday here'). 0000-0000:1234567 by default will trade every day nonstop. 00.00am to 00.00pm and 1234567 every day of the week for example - Cryptocurrencies.
This script is simple to use for any trader as it saves a lot of time for searching good parameters on your own. It's self-optimizing and adjusting to the markets on the go.

Strategy for UT Bot Alerts indicator Using the UT Bot alerts indicator by @QuantNomad, this strategy was designed for showing an example of how this indicator could be used, also, it has the goal to help some people from a group that use to use this indicator for their trading. Under any circumstance I recommend to use it without testing it before in real time.
Backtesting context: 2020-02-05 to 2023-02-25 of BTCUSD 4H by Tvc. Commissions: 0.03% for each entry, 0.03% for each exit. Risk per trade: 2.5% of the total account
For this strategy, 3 indicators are used:
UT Bot Alerts indicator by Quantnomad
One Ema of 200 periods for indicate the trend
Atr stop loss from Gatherio
Trade conditions:
For longs:
Close price is higher than Atr from UT Bot
Ema from UT Bot cross over Atr from UT Bot.
This gives us our long signal. Stop loss will be determined by atr stop loss (white point), break even(blue point) by a risk/reward ratio of 0.75:1 and take profit of 3:1 where half position will be closed. This will be showed as buy (open long position)
The other half will be closed when close price is lower than Atr and Ema from UT Bot cross under Atr. This will be showed as cl buy (close long position)
For shorts:
Close price is lower than Atr from UT Bot
Ema from UT Bot cross over Atr from UT Bot.
This gives us our short signal. Stop loss will be determined by atr stop loss (white point), break even(blue point) by a risk/reward ratio of 0.75:1 and take profit of 3:1 where half position will be closed. This will be showed as sell (open short position)
The other half will be closed when close price is higher than Atr and Ema from UT Bot cross over Atr. This will be showed as cl sell (close short position)
Risk management
For calculate the amount of the position you will use just a small percent of your initial capital for the strategy and you will use the atr stop loss for this.
Example: You have 1000 usd and you just want to risk 2,5% of your account, there is a long signal at price of 20,000 usd. The stop loss price from atr stop loss is 19,000. You calculate the distance in percent between 20,000 and 19,000. In this case, that distance would be of 5,0%. Then, you calculate your position by this way: (initial or current capital * risk per trade of your account) / (stop loss distance).
Using these values on the formula: (1000*2,5%)/(5,0%) = 500usd. It means, you have to use 500 usd for risking 2.5% of your account.
We will use this risk management for apply compound interest.
In settings, with position amount calculator, you can enter the amount in usd of your account and the amount in percentage for risking per trade of the account. You will see this value in green color in the upper left corner that shows the amount in usd to use for risking the specific percentage of your account.
Script functions
Inside of settings, you will find some utilities for display atr stop loss, break evens, positions, signals, indicators, etc.
You will find the settings for risk management at the end of the script if you want to change something. But rebember, do not change values from indicators, the idea is to not over optimize the strategy.
If you want to change the initial capital for backtest the strategy, go to properties, and also enter the commisions of your exchange and slippage for more realistic results.
In risk managment you can find an option called "Use leverage ?", activate this if you want to backtest using leverage, which means that in case of not having enough money for risking the % determined by you of your account using your initial capital, you will use leverage for using the enough amount for risking that % of your acount in a buy position. Otherwise, the amount will be limited by your initial/current capital
---> Do not forget to deactivate Trades on chart option in style settings for a cleaner look of the chart <---
Some things to consider
USE UNDER YOUR OWN RISK. PAST RESULTS DO NOT REPRESENT THE FUTURE.
DEPENDING OF % ACCOUNT RISK PER TRADE, YOU COULD REQUIRE LEVERAGE FOR OPEN SOME POSITIONS, SO PLEASE, BE CAREFULL AND USE CORRECTLY THE RISK MANAGEMENT
Do not forget to change commissions and other parameters related with back testing results!
Strategies for trending markets use to have more looses than wins and it takes a long time to get profits, so do not forget to be patient and consistent !
---> The strategy can still be improved, you can change some parameters depending of the asset and timeframe like risk/reward for taking profits, for break even, also the main parameters of the UT Bot Alerts <----

NIFTY 50 5mint StrategyThis is an intraday strategy for NIFTY50 Based First candle High and Low breakout.
The strategy takes user inputs for the start and end dates, start and end months, and start and end years, which define the time range to trade. The user can also specify the maximum number of trades to take during the time range and the length of the Exponential Moving Average ( EMA ) used in the strategy
In this strategy, the First candle's high and low are calculated and used as entry and exit points for trades. If the close price breaks above the First candle's high, a buy signal is generated. Conversely, if the close price breaks below the First candle's low, a sell signal is generated.
The strategy uses the Exponential Moving Average ( EMA ) as a filter to close entered positions either long or short, EMA also acts Target. If the close price falls below the EMA, a long position is closed, and if the close price rises above the EMA, a short position is closed or the PreviousCandleClose is above the First candle's high a short position is closed, When the PreviousCandleClose is below the First candle's low a long position is closed, First candle's high act as Stoploss
The strategy limits the number of trades taken within the specified time range, and if the time range is exceeded, all positions are closed.
Finally, the strategy plots the First candle's high and low, EMAs on the chart for visual reference.
Default settings work best with the 5mint candle, you may tweak settings according to your needs.
backtesting helps in interpreting how the trading strategy would have behaved in the past, and forward testing (paper trading) informs the traders how it would perform now.

Baseline Cross Qualifier Volatility Strategy with HMA Trend BiasFor trading ES on 30min Chart
Trading Rules
Post Baseline Cross Qualifier (PBCQ): If price crosses the baseline but the trade is invalid due to additional qualifiers, then the strategy doesn't enter a trade on that candle. This setting allows you override this disqualification in the following manner: If price crosses XX bars ago and is now qualified by other qualifiers, then the strategy enters a trade.
Volatility: If price crosses the baseline, we check to see how far it has moved in terms of multiples of volatility denoted in price (ATR x multiple). If price has moved by at least "Qualifier multiplier" and less than "Range Multiplier", then the strategy enters a trade. This range is shown on the chart with yellow area that tracks price above/blow the baseline. Also, see the dots at the top of the chart. If the dots are green, then price passes the volatility test for a long. If the dots are red, then price passes the volatility test for a short.
Take Profit/Stoploss Quantity Removed
1 Take Profit: 100% of the trade is closed when the profit target or stoploss is reached.
2 Take Profits: Quantity is split 50/50 between Take Profit 1 and Take Profit 2
3 Take Profits: Quantify is split 50/25/25.
Stratgey Inputs
Baseline Length
37
Post Baseline Cross Qualifier Enabled
On
Post Baseline Cross Qualifier Bars Ago
9
ATR Length
9
Volatility Multiplier
0
Volatility Range Multiplier
10
Volatility Qualifier Multiplier
2
Take Profit Type
1 Take Profit
HMA Length
11

CryptoGraph StrategizerA complete system to backtest and automate comprehensive trading strategies
═════════════════════════════════════════════════════════════════════════
🟣 How it works
This indicator allows you to use buy & sell signals from external CryptoGraph indicators, and fully backtest these signals in the TradingView strategy tester. After configuring buy & sell signals, the trader can look into exit criteria with this indicator. The indicator offers percentage based an ATR based take profit/stop losses, as well as safety orders (DCA) in order to get a better average entry price.
Once your strategy is fully set up to your desired results, it's possible to set up alerts and connect the indicator through an automation platform ( API connection), to your broker. Alertatron & Wick Hunter auto configuration is included, meaning everything configured in the indicator settings, will automatically be carried out with Alertatron & Wick Hunter syntaxes.
🟣 Features
• Multiple methods of scaling in entries (Multiple DCA/Pyramiding methods). There will be an option to scale up or down your volume per order and distance between orders.
• Multiple methods of determining order sizes. Methods are percentage risk per trade, dollar risk per trade, position size in contracts, position size in percentage and position size in dollar.
• Multiple methods and levels of taking profits and losses. Both percentage based and ATR based take profit and stop loss.
• Option to use external indicator buy/sell signals for entry.
• Visualised liquidation prices in TradingView (both cross and isolated)
• Information panel on chart with additional information regarding your strategy results
• Bot setup directly from indicator inputs tab with Wick Hunter & Alertatron
🟣 How to use
• Choose a symbol that corresponds to your bot pair and exchange
• Pick a chart time frame
• Always use the regular candle type
• Configure your deal start condition
• Configure your profit target
• Use the Take Profit/Stop Loss feature to set a target for profit and loss
• Configure your safety orders
• Check your backtest parameters
•Make sure that the initial capital and order size make sense. Since you can use pyramiding in your strategy with safety orders, the sum of all deals should not be bigger than the initial capital

Investments/swing trading strategy for different assetsStop worrying about catching the lowest price, it's almost impossible!: with this trend-following strategy and protection from bearish phases, you will know how to enter the market properly to obtain benefits in the long term.
Backtesting context: 1899-11-01 to 2023-02-16 of SPX by Tvc. Commissions: 0.05% for each entry, 0.05% for each exit. Risk per trade: 2.5% of the total account
For this strategy, 5 indicators are used:
One Ema of 200 periods
Atr Stop loss indicator from Gatherio
Squeeze momentum indicator from LazyBear
Moving average convergence/divergence or Macd
Relative strength index or Rsi
Trade conditions:
There are three type of entries, one of them depends if we want to trade against a bearish trend or not.
---If we keep Against trend option deactivated, the rules for two type of entries are:---
First type of entry:
With the next rules, we will be able to entry in a pull back situation:
Squeeze momentum is under 0 line (red)
Close is above 200 Ema and close is higher than the past close
Histogram from macd is under 0 line and is higher than the past one
Once these rules are met, we enter into a buy position. Stop loss will be determined by atr stop loss (white point) and break even(blue point) by a risk/reward ratio of 1:1.
For closing this position: Squeeze momentum crosses over 0 and, until squeeze momentum crosses under 0, we close the position. Otherwise, we would have closed the position due to break even or stop loss.
Second type of entry:
With the next rules, we will not lose a possible bullish movement:
Close is above 200 Ema
Squeeze momentum crosses under 0 line
Once these rules are met, we enter into a buy position. Stop loss will be determined by atr stop loss (white point) and break even(blue point) by a risk/reward ratio of 1:1.
Like in the past type of entry, for closing this position: Squeeze momentum crosses over 0 and, until squeeze momentum crosses under 0, we close the position. Otherwise, we would have closed the position due to break even or stop loss.
---If we keep Against trend option activated, the rules are the same as the ones above, but with one more type of entry. This is more useful in weekly timeframes, but could also be used in daily time frame:---
Third type of entry:
Close is under 200 Ema
Squeeze momentum crosses under 0 line
Once these rules are met, we enter into a buy position. Stop loss will be determined by atr stop loss (white point) and break even(blue point) by a risk/reward ratio of 1:1.
Like in the past type of entries, for closing this position: Squeeze momentum crosses over 0 and, until squeeze momentum crosses under 0, we close the position. Otherwise, we would have closed the position due to break even or stop loss.
Risk management
For calculating the amount of the position you will use just a small percent of your initial capital for the strategy and you will use the atr stop loss for this.
Example: You have 1000 usd and you just want to risk 2,5% of your account, there is a buy signal at price of 4,000 usd. The stop loss price from atr stop loss is 3,900. You calculate the distance in percent between 4,000 and 3,900. In this case, that distance would be of 2.50%. Then, you calculate your position by this way: (initial or current capital * risk per trade of your account) / (stop loss distance).
Using these values on the formula: (1000*2,5%)/(2,5%) = 1000usd. It means, you have to use 1000 usd for risking 2.5% of your account.
We will use this risk management for applying compound interest.
In settings, with position amount calculator, you can enter the amount in usd of your account and the amount in percentage for risking per trade of the account. You will see this value in green color in the upper left corner that shows the amount in usd to use for risking the specific percentage of your account.
Script functions
Inside of settings, you will find some utilities for display atr stop loss, break evens, positions, signals, indicators, etc.
You will find the settings for risk management at the end of the script if you want to change something. But rebember, do not change values from indicators, the idea is to not over optimize the strategy.
If you want to change the initial capital for backtest the strategy, go to properties, and also enter the commisions of your exchange and slippage for more realistic results.
If you activate break even using rsi, when rsi crosses under overbought zone break even will be activated. This can work in some assets.
---Important: In risk managment you can find an option called "Use leverage ?", activate this if you want to backtest using leverage, which means that in case of not having enough money for risking the % determined by you of your account using your initial capital, you will use leverage for using the enough amount for risking that % of your acount in a buy position. Otherwise, the amount will be limited by your initial/current capital---
Some things to consider
USE UNDER YOUR OWN RISK. PAST RESULTS DO NOT REPRESENT THE FUTURE.
DEPENDING OF % ACCOUNT RISK PER TRADE, YOU COULD REQUIRE LEVERAGE FOR OPEN SOME POSITIONS, SO PLEASE, BE CAREFULL AND USE CORRECTLY THE RISK MANAGEMENT
Do not forget to change commissions and other parameters related with back testing results!
Some assets and timeframes where the strategy has also worked:
BTCUSD : 4H, 1D, W
SPX (US500) : 4H, 1D, W
GOLD : 1D, W
SILVER : 1D, W
ETHUSD : 4H, 1D
DXY : 1D
AAPL : 4H, 1D, W
AMZN : 4H, 1D, W
META : 4H, 1D, W
(and others stocks)
BANKNIFTY : 4H, 1D, W
DAX : 1D, W
RUT : 1D, W
HSI : 1D, W
NI225 : 1D, W
USDCOP : 1D, W

Kimchi Premium StrategyThis strategy is based on the Korea Premium, also known as the “Kimchi Premium,” which indicates how expensive or cheap the price of Bitcoin in Korean Won on a Bitcoin exchange in South Korea is relative to the price of Bitcoin being traded in USD or Tether. Inverse Kimchi Premium RSI was newly defined to create a strategy with Kimchi Premium. Assuming that the larger the kimchi premium, the greater the individual's purchasing power. In this case, if the Inverse Kimchi Premium RSI falls and closes the candle below the bear level, a short is triggered. Long is the opposite.
This strategy defaults to a combination of the traditional RSI and the Inverse Kimchi Premium RSI. If the user wishes to unlock the Inverse Kimchi Premium RSI combination and only use it as a traditional RSI strategy, the following settings can be used.
Use Combination of Inverse Kimchi Premium RSI: Uncheck
Resolution: Chart (4hr Candle)
Source: Close
Length of RSI: 14
Bull Level: 74
Bear Level: 25
__________________________________________________________________________________
김치프리미엄(김프) 전략은 달러 혹은 테더로 거래되고 있는 비트코인 가격 대비 한국에 있는 비트코인 거래소의 비트코인 원화 가격이 얼마나 비싸고 싼 지를 나타내는 코리아 프리미엄, 일명 "김치 프리미엄" 지표를 기반으로 만들어졌습니다. 김치 프리미엄을 가지고 전략을 만들기위해 Inverse Kimchi Premium RSI를 새롭게 정의하였습니다. 김치 프리미엄이 커질수록 개인의 매수세가 커진다고 가정하고, 이 경우 Inverse Kimchi Premium RSI이 하락하여 Bear Level 아래에서 캔들 마감을 하면 Short을 트리거 합니다. Long은 그 반대입니다.
이 전략은 전통적인 RSI와 Inverse Kimchi Premium RSI을 조합하여 기본값을 설정하였습니다. 유저가 원한다면 Inverse Kimchi Premium RSI의 조합을 해제하고 전통적인 RSI 전략으로만 사용하려면 아래 다음의 설정값을 사용할 수 있습니다.
Use Combination of Inverse Kimchi Premium RSI: 체크 해제
Resolution: Chart (4hr Candle)
Source: Close
Length of RSI: 14
Bull Level: 74
Bear Level: 25

Token Metrics IndicatorThe Token Metrics Combined Indicator v2 is a comprehensive technical analysis tool designed to output Long/Short signals for crypto assets on TradingView. It combines multiple indicators, including Token Metrics Clouds, Token Metrics Trend Lines , Token Metrics Channels, and signals, to give a comprehensive outlook on the market trend and potential entry/exit points.
Users can backtest the signals to understand the strategy's historical performance, learn how to use it, identify its pros and cons, and determine the market conditions it best suits. It is important to note that the backtesting performance does not indicate future results.
The methods for calculating fixed stop-losses vary depending on the trading pattern. A fixed stop-loss is used for long-term trading, while a trading stop-loss is used for high-frequency trading. This provides flexible investment risk management, allowing you to assign different stop-loss percentages to different trading strategies.
The Length input allows users to control the indicator’s sensitivity, with a default value of 20 bars for long-term trading and 9 bars for high-frequency trading. The Adjustment Factor input has a default value of 0.1 and can be adjusted to adapt to changing levels of volatility . The Stop-loss input allows users to control their risk tolerance, with a default value of 8% for long-term trading and 2% for high-frequency trading.
Token Metrics Clouds incorporates a bullish / bearish trend indicator, which uses two adaptive moving averages that adapt to volatility , reducing false trend signals during range-bound environments and providing a more accurate representation of market trends.
The Token Metrics Trendline is a long-term indicator that uses an adaptive moving average to identify long-term trends. This can also be used for long-term resistance and support levels, providing a comprehensive overview of the current market situation for both long-term and high-frequency traders.
The Token Metrics Signals indicator provides long, short, and close signals, indicating when to enter and exit long or short positions based on the TM trend-following strategy.
The Token Metrics Channels indicator is a top/bottom indicator that adjusts to current levels of volatility . This uses adaptive Donchian channels to determine the previous short-term swing high and low, providing insight into where short-term resistance or support might be forming and where breakouts can occur. The look-back periods change according to the strategy time frame, offering a flexible and dynamic approach to market analysis.
Long-term trading is a trend-following strategy best suited for daily and weekly timeframes. This strategy works well in trending markets but may produce false signals in choppy or range-bound markets.
High-frequency trading is a mean-reverting strategy best suited for 15-minute, 30-minute, and 1-hour timeframes. This strategy performs well in choppy or range-bound markets but may not be effective in strong trending markets.

TUE Argentum Algo V1This algorithm is designed to look trend for opening conditions, apply various filters including volume and volatility, then determine stop outs, break evens, and take profits.
The algorithm uses proprietary math based on the concepts of volatility, standard deviations, average true ranges, and volume to help determine trend. You can filter based on cumulative volume delta, volatility, and moving average based trend. It includes settings for either trend following or contrarian trades, and the ability to go long, short, or both.
The take profit areas are based on proprietary math that help find peaks and valleys. You can adjust the size of the take profits as a percentage of the position, change to static take profits (i.e. take profit in 16 ticks), or use both. You can also disable them and use the natural closing conditions of the trades (detection of trend change in the opposite direction).
Our algo works in any market and will allow user to adjust input settings to be used on any ticker they'd like. It is built as a strategy so you can back test on any ticker to find the exact right settings to dial it in and then switch to live trading mode to see signals. Can be used for day trades or swing trades.
Automated Trading
This algo has been tested and certified to work for automated trading.
Works on Forex
It's confirmed to work on forex so you can trade that market.
Gets you into long successful trades, and gets out of poor ones quickly
It keeps you in the long trades taking small profits along the way, but cuts losers quickly in comparison. This style leads to a high profit factor.
It looks at many variables so you don't have to
- Uses trend analysis for opening/closing conditions.
- It measures the strength of trends to help determine if it should enter or not.
- It uses volume, if the user wants, to help filter entries. The volume calculation is based off of my proprietary cumulative volume delta indicator and helps find if the volume is moving long or short.
- It uses proprietary take profit math to help find peaks and valleys to peel off profits. It is based on the changes in momentum of the underlying.
- It allows for stop outs and break evens based on volatility so they'll always adjust with the movement of the underlying ticker (see the blue lines above and below the opening in the chart).
- It allows for offset break evens to keep a portion of the profit.
Strategy for the Algo
Included so you can understand how to trade with it.
ONE: After loading this strategy onto a ticker turn off volume if it's a ticker with no volume , set the dates at the bottom to when the stock is active (you want to start backtesting when a stock started trading like it trades currently).
TWO: From there adjust the short term trend settings to find the highest win rate and profit factor.
THREE: Then adjust the volume length to find the highest win rate and profit factor. It's important while doing these that you pay attention to a smooth upward equity curve.
FOUR: After this has been done now adjust the long and short risk multipliers. This determines your stop out.
FIVE: Then adjust breakeven multipliers - this is the level at which it changes to a breakeven stop out instead of the previous one. You can also set an offset to keep a small part of the profit.
SIX: Finally adjust the take profit sizes.
SEVEN: Once this is all done go back through the list and adjust up and down by one or two clicks and see if a better curve can be obtained. Very frequently long and short trades have different settings.
EIGHT: When you are finished save the settings in a custom indicator template and put it with it's own chart.
Additional
The settings shown on screen are not the default settings, but are settings chosen for this ticker and timeframe based on the process above. Nearly every ticker and timeframe will require adjustment from default, that's why the algorithm is built to be highly flexible. It can fit any ticker and timeframe, as well as market environment.
This particular setup has the algo running a scalping program on ES 3 min with a 16 tick static target. This algorithm can be set up as a scalper, or used to day trade more regularly. It can also swing trade.
As shown here the algo includes $1.25 of commissions and 1 tick of slippage on all orders (about our average for automated trading on ES).

TUE ADX/MACD Confluence Algorithm V1This algorithm is designed to look at the ADX/MACD confluence for opening conditions, apply various filters including volume and volatility, then determine stop outs, break evens, and take profits.
The ADX and MACD confluence can be a powerful predictor in stock movements. Both of these indicators find trend but do it in different ways. When they're combined they have a high success rate of finding openings. That's done by finding the bar in which both show the same direction - that bar is the beginning of the confluence. I have a free indicator called the TUE ADX/MACD Confluence that you can use to see this in action.
This script will help you find those confluences in an easy to understand manner. It will open a trade on a detected confluence, using the rest of the variables available in the algorithm as filters. You can filter based on cumulative volume delta, volatility, and trend. It includes settings for either trend following or contrarian trades, and the ability to go long, short, or both.
It includes Buy and Sell signals for detected confluences, and will show colored candles to help you determine when to exit a trade if you don't want to follow the included take profit areas. When the candles turn to white that means the detected confluence is no longer in play. The Buy and Sell signals will display on the first occurrence of each confluence.
The take profit areas are based on proprietary math that help find peaks and valleys. You can adjust the size of the take profits as a percentage of the position, change to static take profits (i.e. take profit in 16 ticks), or use both. You can also disable them and use the natural closing conditions (reversal of MACD/ADX confluence).
Our algo works in any market and will allow user to adjust input settings to be used on any ticker they'd like. It is built as a strategy so you can back test on any ticker to find the exact right settings to dial it in and then switch to live trading mode to see signals. Can be used for day trades or swing trades.
Automated Trading
This algo has been tested and certified to work for automated trading.
Works on Forex
It's confirmed to work on forex so you can trade that market.
Gets you into long successful trades, and gets out of poor ones quickly
It keeps you in the long trades taking small profits along the way, but cuts losers quickly in comparison. This style leads to a high profit factor, as you can see over 3.0 in the included ES 3 Min chart.
It looks at many variables so you don't have to
- Uses ADX/MACD confluence for opening/closing conditions.
- It uses volume, if the user wants, to help filter entries. The volume calculation is based off of my proprietary cumulative volume delta indicator and helps find if the volume is moving long or short.
- It uses proprietary take profit math to help find peaks and valleys to peel off profits. It is based on the changes in momentum of the underlying.
- It allows for stop outs and break evens based on volatility so they'll always adjust with the movement of the underlying ticker (see the blue lines above and below the opening in the chart).
- It allows for offset break evens to keep a portion of the profit.
Strategy for the Algo
Included so you can understand how to trade with it.
ONE: After loading this strategy onto a ticker turn off volume if it's a ticker with no volume , set the dates at the bottom to when the stock is active (you want to start backtesting when a stock started trading like it trades currently).
TWO: From there adjust the ADX/MACD to find the highest win rate and profit factor.
THREE: Then adjust the volume length to find the highest win rate and profit factor. It's important while doing these that you pay attention to a smooth upward equity curve.
FOUR: After this has been done now adjust the long and short risk multipliers. This determines your stop out.
FIVE: Then adjust breakeven multipliers - this is the level at which it changes to a breakeven stop out instead of the previous one. You can also set an offset to keep a small part of the profit.
SIX: Finally adjust the take profit sizes.
SEVEN: Once this is all done go back through the list and adjust up and down by one or two clicks and see if a better curve can be obtained. Very frequently long and short trades have different settings.
EIGHT: When you are finished save the settings in a custom indicator template and put it with it's own chart.
Additional
The settings shown on screen are not the default settings, but are settings chosen for this ticker and timeframe based on the process above. Nearly every ticker and timeframe will require adjustment from default, that's why the algorithm is built to be highly flexible. It can fit any ticker and timeframe, as well as market environment.
Also included in the chart above is a $1.25 commission per contract, and a tick of slippage (which on average is about right for automated trading on ES).

Strategy Myth-Busting #13 - MultiEMA+BXTrender - [SP/MYN]#13 on the Myth-Busting bench, we are automating the "I Found The Highest Win Rate 15 Minute Scalping Trading Strategy Ever" strategy from "TradeIQ" who claims to have backtested this manually and achieved 410% profit over 100 trades within 6 months on Natural Gas with 79 Wins / 21 Losses with an astounding 3.96% Max Drawdown.
It was quite challenging emulating the same subjective EMA pullback logic along with the dependent sequencing of events necessary to enter a trade and we might improve on this to make it better in the future. Super kudos to @spdoinkal who helped with this strategy. If you have ideas on how this could be improved on, would love to hear about them.
As is, we were unable to substantiate similar results to what was manually backtested by TradeIQ, we do however see potential here. Given some optimizations and improvements to the the entry logic accommodating for a wider more variable margin after pullbacks reestablish above/below the fast EMA we think the performance of this strategy could certainly be improved upon. So not sure if we have totally myth busted this completely at this point in time.
This strategy uses a combination of 2 open-source public indicators:
3 EMA's (Trading View Internal)
B-Xtrender by Puppytherapy
Three separate (21), (89) and (200) EMA's are used as a means to confirm and keep entry out of ranged markets. When the 3 EMA's are all clumped up together with no distance it's indicative of a flat or ranged market. This is then used in conjunction with B-XTrender as a means to detect the trend direction. B-XTrender which is a trend following indicator originally published in the IFTA Journal by Bharat Jhunjhunwala. It uses both a short and long term lengths along with a compound EMA used as a means to smooth and sample trend direction.
Trading Rules
15 min candles but other lower time-frames
Stop Loss on previous swing high/low
No Take Profit, Exit on new red/green circles from BX-Trender
Long
EMA Green (21) on top, White (89)in middle and red (200) on bottom and there is distance between EMA's need to be spaced, otherwise in a ranged market
Price action must pull back into 89 EMA (White line) either close or touching it.
Once pullback occurs wait for BX Trender to issue a new green circle and BX Trend line must be green and above 0
Price action must also pull up back above the (Green Line) EMA 21
Short
EMA Red (200) on top, White (89) in middle and Green (21) on bottom and there is distance between EMA's need to be spaced, otherwise in a ranged market
Price action must pull back into 89 EMA (White line) either close or touching it.
Once pullback occurs wait for BX Trender to issue a new red circle and BX Trend line must be red and below 0
Price action must also pull up back below the (green Line) EMA 21
If you know of or have a strategy you want to see myth-busted or just have an idea for one, please feel free to message me.

Strategy Myth-Busting #12 - OSGFC+SuperTrend - [MYN]This is part of a new series we are calling "Strategy Myth-Busting" where we take open public manual trading strategies and automate them. The goal is to not only validate the authenticity of the claims but to provide an automated version for traders who wish to trade autonomously.
Our 12th one is an automated version of the "The Most Powerful Tradingview Buy Sell Signal Indicator " strategy from "Power of Trading" who doesn't make any official claims but watching how he trades with this, it on the surface looked promising. The strategy author uses this on the 15 min strategy on mostly FOREX. Unfortunately as indicated by the backtest results below, we were not able to substantiate any good positive trading metrics from this, be it Profit, Markdown, Num Of Trades etc. This does seem to do okay with some entries but perhaps adding another indicator to this to filter out more noise might make it better. At least how this strategy is presented now, this is not something I recommend anyone use.
This strategy uses a combination of 2 open-source public indicators:
SuperTrend by TradingView Internal
One-Sided Gaussian Filter w/ Channels By Loxx
The SuperTrend indicator and the One-Sided Gaussian Filter complement each other by providing a more complete and accurate picture of market trends. The SuperTrend indicator is used to identify trends. It does this by calculating a moving average of the underlying securities price and then comparing the current price to the moving average. When the current price is above the moving average, the trend is considered bullish, and when it is below, the trend is considered bearish.
The One-Sided Gaussian Filter is a mathematical tool that is used to smooth out fluctuations in financial data. It does this by removing random noise from the data, making it easier to identify patterns and trends.
When the SuperTrend indicator is used in conjunction with the One-Sided Gaussian Filter, the smoothed price data generated by the filter is used as the input for the SuperTrend calculation. This provides a more accurate representation of market trends and helps to eliminate false signals generated by short-term price movements. As a result, the SuperTrend indicator is able to more accurately identify the underlying trend in the market and provide traders with a cleaner and more reliable signal to act upon.
In summary, the SuperTrend indicator and the One-Sided Gaussian Filter complement each other by providing a more accurate and reliable representation of market trends, resulting in improved performance for traders.
If you know of or have a strategy you want to see myth-busted or just have an idea for one, please feel free to message me.
Trading Rules
15 min candles
FOREX or Crypto
Stop loss at swing high/low | 1.5 risk/ratio
Long Condition
SuperTrend and OSGFC generate buy signal
Close Buy on Gaussian generating a sell signal
Short Condition
SuperTrend and OSGFC generate sell signal
Close Buy on Gaussian generating a buy signal

smplondonclinic StrategyHello my friend! I'm uploading the code for your strategy. I have included a feature in the settings menu called "Entry Direction" that you can use to isolate only longs, only shorts or have both directions at the same time for the backtesting. I have set the strategy to only open 1 position at a time, it will not open a new position unless the previous position is closed. If you want to remove that just let me know. The green/red triangles that you will see plotting on the chart are the potential entry signals, you can turn them off from the style panel in the settings menu. In the inputs tab besides the strategy settings you also have all the relevant parameters for the three indicators used.

TrendShift Pro v1.1TrendShift uses a unique series of moving average calculations to signal shifts in trend direction that goes above and beyond what is possible with common moving average trading techniques like simple moving average crosses.
What makes TrendShift different :
Unique moving average calculations - The unique calculations allow signals of shifts in trend direction to occur quickly but also avoid the chop and frequent flipflops that are common with standard moving average trading technique.
Trading filtering - A clear method of trade confirmation and additional trade filtering using popular indicators like the Ichimoku Cloud and Parabolic SAR which work synergistically with the unique moving average calculations and add additional layers of caution and refinement to filter out unreliable signals.
Dynamic trailing stoploss – A dynamically adjusted fractal stop which provides a unique and effective method of managing risk while capturing the duration of a trending move.
Strict trading criteria – Unambiguous and clearly signaled entries along with a comprehensive risk management framework and robust back-testing tools which are design to reduce discretion and subjective input as much as possible.
Features :
Clearly signaled shifts in trend direction.
Built in optimization for different trading instruments.
Custom inputs for self-optimization.
Adjustable methods of confirming trend shift signals.
Trading filtering using popular trend indicators.
Key support and resistance level displays.
Customizable display options.
Risk management using customizable adjustable trailing stop loss and position size management tools.
Customizable backtesting tools.
Customizable alert messages.
Settings :
Entry Settings:
Entry Type : for entering trades via signal candle or signal candle confirmation.
Trade type : for long only, short only, or long and short trading.
Trend Optimization : contains optimized settings for Bitcoin , Ether, and Altcoins as well as the ability to customize your own settings.
Trading Filters : allows refining signal strength by using EMAs, Ichimoku Cloud , and Parabolic SAR to filter trades.
Support and Resistance : displays traditional and DM based pivots on various time frames.
Risk Management:
Bars to Form Stoploss : allows for adjustment of bars necessary to dynamically adjust stoploss.
Risk Type : allows for backtesting calculations using % risk to account or leverage.
Display options : allows for displaying trade entry and stop loss levels either near candles or in a table.
Backtesting:
Session : allows filtering by trading session hours.
Day of Week Filter : allows filtering trading by specific day of the week.
Backtesting Time : allows adjustments to backtesting dates.
Alerts : allows for customized alert messages.
Usage :
The indicator is optimized for the 4 hour timeframe. A green bullish or red bearish signal candle indicates there has been a meaningful shift towards the respective trend direction. When a long/short entry signal is given, that means the signal candle has been confirmed and a trade can be entered accordingly.
Once a signal has been generated, a dynamically adjust stoploss will appear and self-adjust every 24-48 hours. Your stoploss should be trailed accordingly.
NOTE: Displayed back-testing results are on Binance:ADAUSDT default settings, from 2018-2023, using 3% risk, and 0.075% commission.

DCA Simulator A simple yet powerful Dollar Cost Averaging (DCA) simulator.
You just add the script to your chart, and you'll be able to see:
- Every single entry with its size
- The evolution of you average price in time (blue line)
- The profit and loss areas (where market price < average price the DCA is at loss, and the background is colored in red. At the contrary, where mkt price is > average price, it's profit area and the background is green).
- Max drawdown: the point in price and time where the DCA loss is maximum in the considered time interval. The drawdown amount is specified.
- Profit (or loss) and total cost at the end of the time interval or at the present day: the script shows how much the DCA is netting at a profit or loss, as well as the total cost of the DCA itself.
The parameters are:
- Date start and date end: time interval of the DCA simulation
- DCA period (you can choose between daily, weekly and monthly)
- Week day or month day if you choose those periods
- Single operation size (in base currency)
- Option to choose a DCA LONG or DCA SHORT (for uber bears)
- Option to include an exit strategy that partially closes your position (the % size closed can be chosen as well with the parameter "exit_close_perc") every time the DCA realizes a specific gain (choosable with the parameter "exit_gain_threshold"). If you choose "none" as an exit strategy, the script will assume to never close positions until the end of the period or the present day for simulation purpose.
NB: just ignore the TV strategy tester results, all the data are visible on the chart.

TTP OSC SuperTrendThis strategy instead of following the trend of the price it follows the trend of an oscillator.
You can follow the trend of RSI or CCI.
We use SuperTrend applied to either oscillator for entering a long.
Position can close from
- using a stop loss percentage parameter
- or when entering downtrend
- or when using TP% when the target is achieved
Ideas:
- Use the SuperTrend multiplier to match the oscillator behaviour, CCI moves less, so I use 1.5 multiplier. With RSI I use 3
- I find this strategy works great to do swing trades during bull markets. When backtesting BTCUSDT it outperforms buy and hold before the beginning of the bear market.
- Try RSI 7 instead of RSI 14 for faster response
Alerts
It supports separated payloads for each alert type:
1- Deal open
2- TP% reached
3- SL%
4- Downtrend deal close

ichimoku Masters Backtester LightThis Indicator has so many options for build your own strategy
With this indicator you can build your own strategy using the options that we provided here
in the "Static Enter" Section you can choose where do you want to enter your position and customize it with "Enter Candle" Section,by specifying these options, the indicator will start opening the position for you and show you the backtest.
In the "Static Exit (SL & TP)" section you can choose where do you want to exit your positions with setting target and stop for your positions.
And at the end you can set alert on opening and closing position and be aware of that
We hope that you enjoy using ichimoku Masters Backtester Light
-Notice : The Sections: "Dynamic Enter" , "Dynamic Exit" , "9Br Enter" , "9Br Exit" , "Pre Cross" , "Cross Enter" , "Cross Exit" , "Chiko Enter" , "Break Enter" , "Pre Switch" , "Switch Enter" , "Switch Exit" , "Ichi Elements" , "Ichi Elements Order" and "Risk Management" are limited on this version and you are not able to use them
- the "Name" Argument is for naming your strategy
- Open Section has 3 options :
1 : Buy/Sell opens positions when ichimoku cloud and conversion and base line cross at the sametime
2 : 26BoxBr opens position when candle breaks the ichimoku 26 box that indicator builds on "Box" Section
3 : 52BoxBr opens position when candle breaks the ichimoku 52 box that indicator builds on "Box" Section
- Box Section has 6 options :
1 : Cr sets the box on conversion and base cross
2 : OldCr sets the box on conversion and base cross with the beginning candle
3 : PC sets the box on a cross which has no cross before until 26 candles
4 : 9Signal Box sets the box on 9 candles of open position candle
5 : 26Signal Box sets the box on 26 candles of open position candle
4 : 52Signal Box sets the box on 52 candles of open position candle
- Enter1% sets the percent of entry position
- Risk% sets the percent you want to risk your equity
- Max Leverage sets the maximum leverage you want to have on your positions
- S2S is for staying on the position and the indicator does not open the opposite position
- Enter Candle Section has 14 check boxes:
1 : Scandle means that our open position candle should be standard
2 : NoScandle means that our open position candle should not be standard
3 : Tr means that our open position candle should be green for long positions and red for short positions
4 : NoTr means that our open position candle should be red for long positions and green for short positions
5 : G means that our open position candle should be big candle
6 : NoG means that our open position candle should not be big candle
7 : 9Grd means that conversion line shoud be yellow for long positions and white for short positions
8 : No9Grd means that conversion line shoud not be yellow for long positions and white for short positions
9 : 26Grd means that base line shoud be yellow for long positions and white for short positions
10 : No26Grd means that base line shoud not be yellow for long positions and white for short positions
11 : 52Grd means that Lead2 line shoud be yellow for long positions and white for short positions
12 : No52Grd means that Lead2 line shoud not be yellow for long positions and white for short positions
13 : InCL means that our open position candle should be in ichimoku cloud
14 : OutCL means that our open position candle should not be in ichimoku cloud
- Static Exit (SL & TP)
- Sl Section has 6 Options:
1 : Middle26 sets the stop loss of the position on the middle of the box
2 : 9 Stop sets the stop loss of the position on the 9 candles box
3 : 26 Stop sets the stop loss of the position on the 26 candles box
4 : 52 Stop sets the stop loss of the position on the 52 candles box
5 : 26Double box sets the stop loss of the position on the Double of 26 candles box
6 : 52Double box sets the stop loss of the position on the Double of 52 candles box
- in TP we can set our targets from 1 to 20
- LogTp sets our target based on logarithm
- Multiple Enter:
in this section we can set our additional orders for open positions,for this you should turn on the "On" button and then set your orders base on box, for example:
when you put 50 on Enter2 and 10 on Enter2% ,then indicator sets an order on the 50 percent of box in 10% of your equity
- Multiple Exit:
in this section you can set your step exit of order, for this you should turn on the "on" button and set your steps on box targets, for example:
when you put 1 on Exit1 and 10 on Exit1% , then indicator exit 10 percent of your position on the target 1 of box
- RF Stands for risk free and you can risk free your positions using RF ,for example :
when you put 1 on RF and 10 on RF% ,then indicator place your stop on opening position candle when it touches the target 1 of the box and exits 10 percent of your position
- Ichi Numbers : in this section you can specify your ichimoku numbers
- C stands for Conv
- B stands for Base
- L stands for Lead2
- Visual Setting : in this section you can choose variable that you want to see on the chart
- Long TP/SL shows you the Long position target and stop
- Short TP/SL shows you the Short position target and stop
- Cloud shows you the ichimoku cloud
- Offset shifts the ichimoku clouds on 26 candles
- Conv shows you the conversion line
- Base shows you the base line
- Chiko shows you the chiko span line
- Pre shows you the point that conv prediction line and base prediction line cross each other and lead2 prediction line and lead1 prediction line cross too at the same time
- Cr shows you the cross point of conv and base lines
- PC shows the cross point of conv and base lines which has no cross up to 26 candles ago
- EqCr shows you the cross point of conv and base lines which the conv and base are equal
- Buy_Sell shows you the point that conv line and base line cross each other and lead2 line and lead1 line cross too at the same time
- Position Info shows you the information of position such as leverage and entry equity
- Enjoy :)