Flying Dragon Trend StrategyFlying Dragon Trend Strategy can be used to indicate the trend on all timeframes by finetuning the input settings.
The Flying Dragon Trend family includes both the strategy and the indicator, where the strategy supports of selecting the optimal set of inputs for the indicator in each scenario. Highly recommended to get familiar with the strategy first to get the best out of the indicator.
Flying Dragon Trend plots the trend bands into the ribbon, where the colours indicate the trend of each band. The plotting of the bands can be turned off in the input settings. Based on the user selectable Risk Level the strategy is executed when the price crosses the certain moving average line, or at the Lowest risk level all the bands have the same colour.
The main idea is to combine two different moving averages to cross each other at the possible trend pivot point, but trying to avoid any short term bounces to affect the trend indication. The ingenuity resides in the combination of selected moving average types, lengths and especially the offsets. The trend bands give visual hint for the user while observing the price interaction with the bands, one could say that when "the Dragon swallows the candles the jaws wide open", then there is high possibility for the pivot. The leading moving average should be fast while the lagging moving average should be, well, lagging behind the leading one. There is Offset selections for each moving average, three for leading one and one for the lagging one, those are where the magic happens. After user has selected preferred moving average types and lengths, by tuning each offset the optimal sweet spot for each timeframe and equity will be found. The default values are good enough starting points for longer (4h and up) timeframes, but shorter timeframes (minutes to hours) require different combination of settings, some hints are provided in tooltips. Basically the slower the "leading" moving average (like HMA75 or HMA115) and quicker the "lagging" moving average (like SMA12 or SMA5) become, the better performance at the Lowest risk level on minute scales. This "reversed" approach at the minute scales is shown also as reversed colour for the "lagging" moving average trend band, which seems to make it work surprisingly well.
The Flying Dragon Trend does not necessarily work well on zig zag and range bounce scenarios without additional finetuning of the input settings to fit the current condition.
Strategy direction selector by DashTrader.
Analisis Trend

Bull Trend Filtered StochRSI (BTFS)Ride Bull Trends Via Stochastic with Special Rules for Heavy Bullish Bias
TLDR: Long Only Trend Indicator Where you are always entered Long if the stochastic is over the lower band line and the price is above the Donchian Chanel high. Exit when Stochastic RSI is below the lower band.
Indicators:
Filter = Trend/Bullish indicator is Donchian of ema(high) this is set as the highest ema(high, 6) in the last 30 candles. this can be adjusted to fit the market as desired.
**indicator prints green background when the filter condition is satisfied***
Entry Exit = enter when the Stoch RSI is above the given lower trend band. This value is set at 35 but can be adjusted according to risk tolerance and market conditions.
Logic:
this indicator allows a trader to be present during bullish/parabolic trends by only triggering if the close is > than the highest 6 candle average high over the last 30 candles. This filter requires the market to be in a generally bullish posture. If the market is in this condition the stochastic RSI indicator value offers a good gauge of price action and only goes significantly down if price trends below the average range of the rsi period. This filters out noise and keeps a trader from over trading on inconsequential corrections while responding fairly quickly to changes in general trend direction. the response is fast enough to produce an unprofitable amount of false signals if the bull market filter is not implemented. However when used in combination the signals return desirable results in bull trending markets.
Hope this Helps. Happy Trades.
-Snarky Puppy

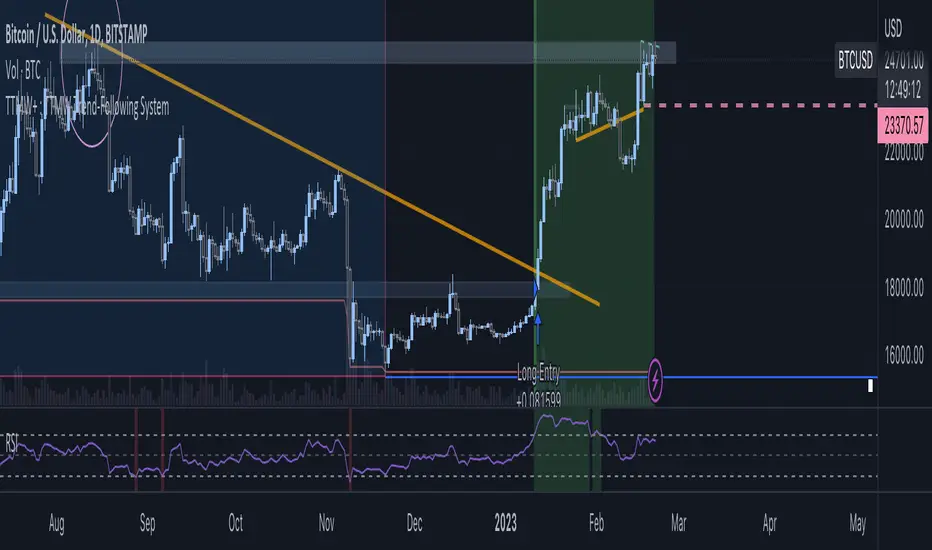
TTMW+ : TTMW Trend-Following System TTMW Trend-Following System
Developed by Stamp - To The Milky Way
# What is TTMW Trend Following System ? #
- TTMW Trend-Following System is designed and developed by "To The Milky Way". The indicator is very simple and useful for low time-preference trader, the concept of the indicator is to follow the trend when the strong buy momentum is indicated using the only indicator ,RSI (Relative Strength Index), to provide the signal for the traders. The cross-over of RSI and overbought value indicates the strong Buy momentum and the possible FOMO state, labels the Buy Signal which is indicated on the chart. The cross-under of RSI and oversold value indicated the strong Sell momentum that would be the Take-Profit or Stop-Loss target.
- The TTMW Trend-Following System is able to Backtest the performance of the system with any specific ticker by using the Strategy Tester that is provided in Tradingview, so the traders can verify the past performance of the system performing in any specify ticker before making the investing decision.
- The Trend Following system is better to use in large timeframe. The indicator is designed and developed to perform on 1D Timeframe.
# How to use ? #
- The system is very simple to use. The system is designed for 3 trading style (Normal, Aggressive, Super Aggressive) which can be selected in the setting. Traders can select the trading style which fit the best with their trading style.
- The system is developed with the Dashboard that can be enabled in the setting. The Dashboard provides the major informations that can help the traders.
- The system has an alert function that can be used to alert via Email when the Buy or Sell signal is triggered.
Ichimoku Cloud and ADX with Trailing Stop Loss (by Coinrule)The Ichimoku Cloud is a collection of technical indicators that show support and resistance levels, as well as momentum and trend direction. It does this by taking multiple averages and plotting them on a chart. It also uses these figures to compute a “cloud” that attempts to forecast where the price may find support or resistance in the future.
The Ichimoku Cloud was developed by Goichi Hosoda, a Japanese journalist, and published in the late 1960s. It provides more data points than the standard candlestick chart. While it seems complicated at first glance, those familiar with how to read the charts often find it easy to understand with well-defined trading signals.
The Ichimoku Cloud is composed of five lines or calculations, two of which comprise a cloud where the difference between the two lines is shaded in.
The lines include a nine-period average, a 26-period average, an average of those two averages, a 52-period average, and a lagging closing price line.
The cloud is a key part of the indicator. When the price is below the cloud, the trend is down. When the price is above the cloud, the trend is up.
The above trend signals are strengthened if the cloud is moving in the same direction as the price. For example, during an uptrend, the top of the cloud is moving up, or during a downtrend, the bottom of the cloud is moving down.
DMI is simple to interpret. When +DI > - DI, it means the price is trending up. On the other hand, when -DI > +DI, the trend is weak or moving on the downside. The ADX does not give an indication of the direction but about the strength of the trend.
Typically values of ADX above 25 mean that the trend is steeply moving up or down, based on the -DI and +DI positioning. This script aims to capture swings in the DMI, and thus, in the trend of the asset, using a contrarian approach.
Trading on high values of ADX, the strategy tries to spot extremely oversold and overbought conditions. Values of ADX above 45 may suggest that the trend has overextended and is maybe about to reverse.
This strategy combines the Ichimoku Cloud with the ADX indicator to better enter trades.
Long orders are placed when these basic signals are triggered.
Long Position:
Tenkan-Sen is above the Kijun-Sen
Chikou-Span is above the close of 26 bars ago
Close is above the Kumo Cloud
MACD line crosses over the signal line
-DI is greater than +DI
ADX is greater than 45
Close Position:
3% increase trailing
3% decrease trailing
The script is backtested from December 2022 and provides good returns.
A trading fee of 0.1% is also taken into account and is aligned to the base fee applied on Binance.

The Zig Zag Leveler Strategy 1This indicator is designed to identify potential trade setups in the market using the ZigZag indicator. It uses a combination of the ZigZag indicator and the background fill color to help identify areas of support and resistance. It also uses a pip offset to help with entries and exits. Additionally, it can generate alert conditions when the market direction changes and when a buy or sell signal is generated. This indicator can be used to help identify potential trade setups and can be customized to fit the user's trading strategy.
This indicator takes the guesswork out of trading by providing traders with an array of signals that can help identify entry and exit points. The indicator uses two sets of signals to identify price levels that indicate potential entry and exit points - one set of signals that indicate potential entry points and another set of signals that indicate potential exit points. The indicator also provides traders with a visual representation of the signals that can help them better understand the signals and make informed trading decisions. With this indicator, traders can have a better understanding of the market and have a better chance of making profitable trades.

APIBridge support and resistance strategy for NSE OptionsStrategy Premise:
The strategy works on the Support and Resistance . The user specifies the trigger price and the strategy will open trades as soon as the market closes after crossing the trigger price. The stoploss and target is compulsory and the trades will close if either the target or stoploss is hit or Intraday end session is reached in case of MIS (Intraday settings) or expiry is reached .
If the positional settings (NRML) has been chosen then the trades will close when either stoploss or target hits or expiry is reached
==========Consecutive trades==========
The strategy takes a long entry on call long put short setting and a short position on put long and call short settings so call long and put short entries can be taken one after another without the need of closing the one of them. Similarly put long and call short can be taken one after another.
But put long and call short can not be taken one after another with both the trades open because on tradingview closes the previous long or short when we take short or long respectively. Similarly call long and put short can not be taken one after another with both the trades open
Create Alert
Simply copy the text written in Alert Message field on the top of input section and replace everything in the message box of the alert with this text
Strategy Parameters
1. Alert Message : Copy the string in the input field and replace with the text in the message box of the alert to get the automated trades
2. Use Backtesting : Check this box to use the backtesting parameters . The backtesting parameters will only show trades between the specified intervals
3. Starting Date and Time : The strategy will only place trades after this time according to logic
4. Ending Date and Time : The strategy willonly place trades before this time according to logic
5. Segment Type : Choose the segment type . MIS is Intraday and NRML is normal cash and carry/Positional
6. Start Session : This is the session in which the strategy will take entry according to logic every day . This parameter works only with MIS and not NRML
7. Ending Session : This is the session which will square off all the open trades . This parameter works only with MIS and not NRML
8. Long : Check this box for Long/Buy Positions
9. Long Price : This is the trigger price , the strategy will Long/Buy when the price closes after crossing this line.
10. Call or Put on Long : Choose whether you want to Long/Buy Call or Put
11. Stoploss and Target type for Long : Choose from the given types
12. Long Target : specify the target
13. Stoploss Value for Long : Specify the stoploss value
14. Use TSL : Check this to use trailing stoploss
15. ATR settings : Set the atr settings to use atr based stoploss
16. Short : Check this to Short/Sell
17. Short Price : This is the trigger price , the strategy will Long/Buy when the price closes after crossing this line.
18. Call or Put on Short: Choose whether you want to Long/Buy Call or Put
19. Stoploss and Target type for Short: Choose from the given types
20. Short Target : specify the target
21. Stoploss Value for Short: Specify the stoploss value
22. Use TSL : Check this to use trailing stoploss
23. ATR settings : Set the atr settings to use atr based stoploss
24. Instrument Type : Choose the option type
25. Expiry Settings : Configure the expiry date . the strategy will not take entry after expiry
26. Symbol : Specify Symbol name if want to trade in symbol other than current chart symbol
27. Strike Type/Money Type : select the money type
28. Strike Difference : Enter the difference between the two consecutive strikes of the choosen asset
29. Strike Distance from ATM : Enter the distance of strike from ATM which you want to buy in any strike type/money type . If zero has been choosen in case of OTM/ ITM then the strike dif will used as default
30. Quantity : Specify the number of lots you want to trade
31. Strategy Tag : Specify the strategy tag you wan to use with APIBRIDGE . If left blank it will trade in the strategy tag fed in the APIBRIDGE

Simple SuperTrend Strategy for BTCUSD 4HHello guys!, If you are a swing trader and you are looking for a simple trend strategy, you should check this one. Based in the supertrend indicator, this strategy will help you to catch big movements in BTCUSD 4H and avoid losses as much as possible in consolidated situations of the market
This strategy was designed for BTCUSD in 4H timeframe
Backtesting context: 2020-01-02 to 2023-01-05 (The strategy has also worked in previous years)
Trade conditions:
Rules are actually simple, the most important thing is the risk and position management of this strategy
For long:
Once Supertrend changes from a downtrend to a uptrend, you enter into a long position. The stop loss will be defined by the atr stop loss
The first profit will be of 0.75 risk/reward ratio where half position will be closed. When this happens, you move the stop loss to break even.
Now, just will be there two situations:
Once Supertrend changes from a uptrend to a downtrend, you close the other half of the initial long position.
If price goes againts the position, the position will be closed due to breakeven.
For short:
Once Supertrend changes from a uptrend to a downtrend, you enter into a short position. The stop loss will be defined by the atr stop loss
The first profit will be of 0.75 risk/reward ratio where half position will be closed. When this happens, you move the stop loss to break even.
Like in the long position, just will be there two situations:
Once Supertrend changes from a downtrend to a uptrend, you close the other half of the initial short position.
If price goes againts the position, the position will be closed due to breakeven.
Risk management
For calculate the amount of the position you will use just a small percent of your initial capital for the strategy and you will use the atr stop loss for this.
Example: You have 1000 usd and you just want to risk 2,5% of your account, there is a long signal at price of 20,000 usd. The stop loss price from atr stop loss is 19,000. You calculate the distance in percent between 20,000 and 19,000. In this case, that distance would be of 5,0%. Then, you calculate your position by this way: (initial or current capital * risk per trade of your account) / (stop loss distance).
Using these values on the formula: (1000*2,5%)/(5,0%) = 500usd. It means, you have to use 500 usd for risking 2.5% of your account.
We will use this risk management for apply compound interest.
Script functions
Inside of settings, you will find some utilities for display atr stop loss, supertrend or positions.
You will find the settings for risk management at the end of the script if you want to change something. But rebember, do not change values from indicators, the idea is to not over optimize the strategy.
If you want to change the initial capital for backtest the strategy, go to properties, and also enter the commisions of your exchange and slippage for more realistic results.
Signals meanings:
L for long position. CL for close long position.
S for short position. CS for close short position.
Tp for take profit (it also appears when the position is closed due to stop loss, this due to the script uses two kind of positions)
Exit due to break even or due to stop loss
Some things to consider
USE UNDER YOUR OWN RISK. PAST RESULTS DO NOT REPRESENT THE FUTURE.
DEPENDING OF % ACCOUNT RISK PER TRADE, YOU COULD REQUIRE LEVERAGE FOR OPEN SOME POSITIONS, SO PLEASE, BE CAREFULL AND USE CORRECTLY THE RISK MANAGEMENT
The amount of trades closed in the backtest are not exactly the real ones. If you want to know the real ones, go to settings and change % of trade for first take profit to 100 for getting the real ones. In the backtest, the real amount of opened trades was of 194.
Indicators used:
Supertrend
Atr stop loss by garethyeo
This is the fist strategy that I publish in tradingview, I will be glad with you for any suggestion, support or advice for future scripts. Do not doubt in make any question you have and if you liked this content, leave a boost. I plan to bring more strategies and useful content for you!

Pink trading (3 MA + RSI)Strategy intended for scalping on forex, commodities , crypto on a timeframe not less than m15.
The strategy is based on 3 means: fast, slow and trend. RSI is used for filter signals.
Long signals are generated when fast mean crossover slow mean and the price is over the trend mean
Short signals are generated when fast mean crossunder slow mean and the price is under the trend mean
You can choose type of mean between SMA , RMA, EMA , WMA , VWMA as well the source of values between all standard sources
RSI is used to filter the signals:
Long only if RSI is grater than 50 and the SMA of RSI (with the same period as fast mean) is ascending,
Short only if RSI is less than 50 RSI mean is descending
The trade is closed or at reaching of a Take Profit (setting in % of price, in standard forex = 100pip per %) or at reaching of maximum open candles period.
The Stop Loss is set as the lowest/highest value of the "Min/Max SL back candles" candles
Default values gives a good balance for forex, for crypto and commodities you can tweek parameters for better results
in markets with high volatility you can increase Take Profit level but keep maximum number of candles low

Open DriveOpen Drive is a market profile concept introduced by Jim Dalton. It occurs when the price moves directionally and persistently for the first 30 minutes from the cash market open.
It is necessary to use 30-minute bars as there needs to be enough time to measure an extreme move of the cash open. This means there will be fewer trades than other strategies using faster time periodicities.
The script finds open drives from these time points 0700/ 0800 and 1300/1430.
The entry signal also has a breakout threshold using the 5-bar high and 5-bar low to only take trades moving away from the prior 5-bar range. This weeds out most mid-range trades and small range expansion bars.
If the price has had a strong move from the open and has broken either below the prior 5-bar low or above the prior 5-bar high by an amount equal to the prior 5-bar range a trade is entered in the direction of the move.
The Exit criteria; exit after 3 bars which is 90mins when using a 30min periodicity.
Note, this script is shared to show that momentum generated on or around the cash open tends to persist. The entry and exits of this strategy are quite naive but there are plenty of ways to take more aggressive entries on faster time frames when an open drive occurs. The times chosen for this strategy will suit stock index futures mainly. The user can experiment with other futures products and their corresponding pit/ cash open hours.
Google "open drive market profile" for more information on open drives and market profile concepts.
Happy trading!

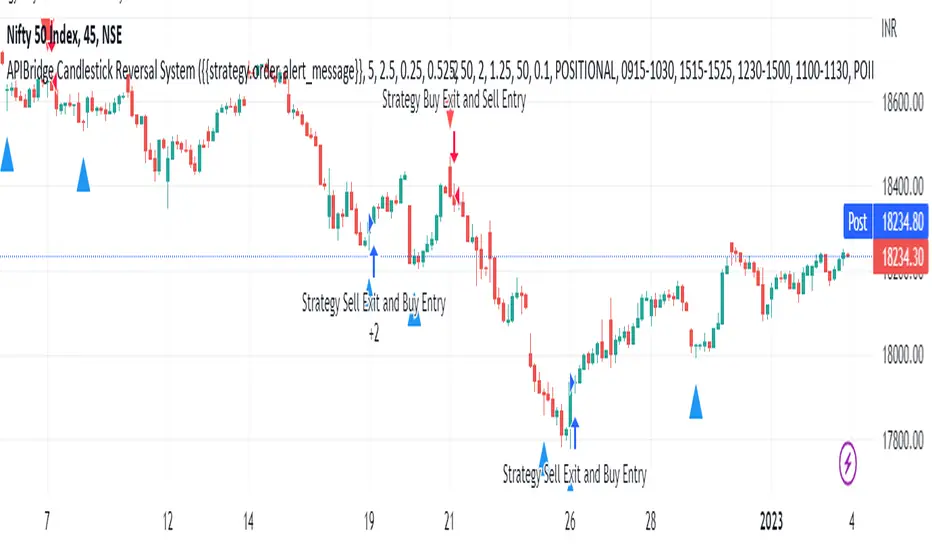
APIBridge Candlestick Reversal SystemStrategy Premise
This strategy uses the Wick Reversal System introduced in Pivot Boss and generates signals based on Candlestick Patterns.
– Wick Reversal System
– Extreme Reversal System
– Outside Reversal System
– Doji Reversal System
Wick Reversal System:
1. For a Bullish reversal wick to exist, the close of the bar should fall within the top 35% of the overall range of the candle.
2. For a bearish reversal wick to exist, the close of the bar should fall within the bottom 35% of the overall range of the candle.
Extreme Reversal System:
1. The first bar of the pattern is about two times larger than the average size of the candles in the look-back period.
2. The body of the first bar of the pattern should encompass more than 50% of the bar’s total range, but usually not more than 85%.
3. The second bar of the pattern opposes the first. If the first bar of the pattern is bullish (C > 0), then the second bar must be bearish (C < 0). If the first bar is bearish (C < 0), then the second bar must be bullish (C > 0).
Outside Reversal System:
1. The Engulfing bar of a bullish outside reversal setup has a low that is below the prior bar’s low (L < L) and a close that is above the prior bar’s high (C > H).
2. The Engulfing bar of a bearish outside reversal setup has a high that is above the prior bar’s high (H > H) and a close that is below the prior bar’s low (C < L).
3. The Engulfing bar is usually 5 to 25 percent larger than the size of the average bar in the look-back period.
Doji Reversal System:
1. The open and close prices of the Doji should fall within 10 percent of each other, as measured by the total range of the Candlestick .
2. For a Bullish Doji , the high of the Doji Candlestick should be below the ten-period Simple Moving Average (H SMA (10)).
4. For a Bearish Doji , one of the two bars following the Doji must close beneath the low of the Doji (C < L or C < L).
5. For a Bullish Doji setup, one of the two bars following the Doji must close above the high of the Doji (C > H) or C > H)
Strategy Logic
Long Entry:
When Low Pivot Point and Wick Reversal System and Bullish Wick Reversal Setup Pattern Send, LE
OR When Low Pivot Point and Extreme Reversal System and Bullish Extreme Reversal setup Send ,LE
OR When Low Pivot Point and Outside Reversal System and Bullish Outside Reversal Setup Send LE
OR When Low Pivot Point and Doji Reversal System and Bullish Doji Reversal Setup Send, LE
Long Exit:
Either when SL or Target is hit. If SL/ TGT is not hit and
When High Pivot Point and Wick Reversal System and Bearish Wick Reversal Setup Pattern Send LXSE
OR When High Pivot Point Extreme Reversal System and Bearish Extreme Reversal setup Send LXSE
OR When High Pivot Point Outside Reversal System and Bearish Outside Reversal Setup Send LXSE
OR When High Pivot Point Doji Reversal System and Bearish Doji Reversal Setup Send, LXSE
Short Entry:
When High Pivot Point and Wick Reversal System and Bearish Wick Reversal Setup Pattern Send SE
OR When High Pivot Point Extreme Reversal System and Bearish Extreme Reversal setup Send SE
OR When High Pivot Point Outside Reversal System and Bearish Outside Reversal Setup Send SE
OR When High Pivot Point Doji Reversal System and Bearish Doji Reversal Setup Send, SE
Short Exit:
Either when SL or Target is hit. If SL/ TGT is not hit and
When Low Pivot Point and Wick Reversal System and Bullish Wick Reversal Setup Pattern Send, SXLE
OR When Low Pivot Point and Extreme Reversal System and Bullish Extreme Reversal setup Send ,SXLE
OR When Low Pivot Point and Outside Reversal System and Bullish Outside Reversal Setup Send SXLE
OR When Low Pivot Point and Doji Reversal System and Bullish Doji Reversal Setup Send, SXLE
Candlestick Reversal System Algo Strategy Parameters for TradingView Charts
1.Length: This is number of bars used to calculated Ex: 14 à previous 14 candles are used
2.Backtesting : Use this to backtest the strategy between Starting and Ending Date and time , it can also be used to set trades in future time
3.Alert_Message : Need to copy while creating alert into Message Box
4.Trade Setup : Intraday / Positional (Selecct accordingly)
5.Start Time Stop Time (Session 1) : Intraday / Positional start time and end time of trade for session 1
6.End Session 1 : Define time to exit any existing position taken in session 1 so that exchange charges will not apply
7.Use Second Session : Check this to use second intraday session
8.Start Time Stop Time (Session 2) : Intraday / Positional start time and end time of trade for session 2
9.End Session 1 : Define time to exit any existing position taken in session 2 so that exchange charges will not apply
10.Use Target : check if you want to set required target if not cheque will not applicable
11.Use StopLoss : Cheque if you want to set stop loss if not cheque will not applicable
12.Trailling Stoploss : Cheque if you want to set trailing stop loss if not cheque will not applicable
13.Point Or Percentage For TG SL : Use Points or Percentage as per your choice
14.Target : Set as per the selection of (Point Or Percentage For TG SL)
15.Stop Loss : Set as per the selection of (Point Or Percentage For TG SL)
16.TSL_Type : Select as per your logic in %/ATR/Points
17.TSL_Input : Set in case you select %/Points in TSL_Type
18.ATR Length : Set as per your logic if you select ATR in the field of TSL_Type
19.ATR_Mult : Set as per your logic if you select ATR in the field of TSL_Type
20.Segment : Select segment of your logic EQ/FUTIDX/FUTSTK/OPTIDX/OPTSTK/FUTCUR/FUTCUM (Used in case of option / Futures )
21.Select Expiry Date : Select the expiry date of your trade as per the segment you selected (Used in case of option / Futures )
22.Select Expiry Month : Select the expiry Month of your trade as per the segment you selected (Used in case of option / Futures )
23.Year : Select the expiry Year of your trade as per the segment you selected (Used in case of option / Futures )
24.Quantity : Enter the quantity in which you want to trade (Used in case of option / Futures )
25.Product Type : Select MIS/Normal/ CNC as per your logic (Used in case of option / Futures )
26.Order Type : Select Market/Limit as per your logic (Used in case of option / Futures )
27.Strategy Tag : Enter the value in case you are using webhook / advance template in APIBridgeTM
28.Lotsize : Enter the lotsize as per your lotic and quentity selection (Used in case of option / Futures )
29.STEP (OTM/ATM/ ITM ) : Select OTM(+1)/ATM(0)/ ITM (-1) as per your logic works in case of options only
30.DIFFERENCE_BETWEEN 2 STRIKE : Select difference of 2 strikes you have used in APIBridge symbol setting list, like for Nifty 50 BankNifty 100
31.APIB Port : Set as per provided to you by Algoji in case of webhook / advance templet
The Segment full form is given below
EQ Equity
FUTIDX Future Index
FUTSTK Future Stock
OPTIDX Index Option
OPTSTK Stock Option
FUTCUR Futcur Currency
FUTCUM Future Commodity
Auto Harmonic Pattern - Backtester [Trendoscope]We are finally here with the implementation of backtesting tool for Auto-Harmonic-Pattern-UltimateX .
CAUTION: THIS IS NOT A STRATEGY AND SHOULD NOT BE FOLLOWED BLINDLY. WE ENCOURAGE USERS TO UTILISE THIS AS BACKTESTING TOOL FOR BUILDING THEIR STRATEGY BASED ON HARMONIC PATTERNS
This script is based on our premium indicator - Auto-Harmonic-Pattern-UltimateX . In this script, along with implementation of scanning harmonic patterns, we provide various options via settings which enables users to build their own strategy based on harmonic patterns, use them with custom coded filters, backtest them on various tickers and timeframes.
Harmonic Patterns is concept and we can trade harmonic pattern in many ways. While general interest around harmonic patterns is to find reversal zones and use them for short term swing trades. But, using it along trend following strategies can also be very rewarding. Here is one of the educational idea I shared about using harmonic patterns for trend following. These are just few possibilities where users can explore further on how they want to trade this. The settings of this script are crafted in such a way that it enables users to explore all these possibilities.
🎲 Components
Chart components of this script is lighter compared to Auto Harmonic Pattern - UltimateX. This is because we want to keep lighter interface in order to support seamless execution of emulator. Since pine strategy framework does most of the things such as calculating profitability, keeping track of trades and results etc, display with respect to - "Closed Trade Stats" are removed from this script and "Open Trade Stats" are made lighter.
🎲 Settings
🎯 Trade Settings : Few important settings under this section are
Due to pine limitations, we will not be able to support both long and short in a same setup. Hence, users need to chose either long or short trade setup.
Entry/Base/Target play important role in defining your strategy.
Confluence is another important factor which lets users use multiple patterns at once as confirmation.
🎯 Zigzag Settings : Zigzag settings determine the size of patterns being formed.
Please note that smaller patterns may not yield very good results and larger patterns may take time to complete trade. Similarly higher depth can cause runtime issues. Recursive zigzag option is alternative to deep search algorithm.
🎯 Filters :
Filters enable users to select trades based on specific conditions. Ability to use external filter even allows writing and using custom filters to be used with this algorithm. Here is a video which explains how this can be done. HOW-TO-Use-external-filters
Pattern filters allow users to pick and chose patterns they want to trade. This can be done either individually or based on category
🎯 Alerts :
Apart from strategy specific alerts, the script also implements customisable alerts via pine alert() function. Alerts can be configured to send upon three conditions
When new pattern is created
When an existing pattern updates entry/stop/target due to safe repaint of D (Only happens when Trail Entry Price is selected)
When a pattern in trade closes either due to hitting stop or target
Important Note: Alerts fired via this method may not match the trades shown on chart as trades which are controlled via pine strategy emulator depends on various other factors such as pyramiding.
Alert template is customisable and users can make use of available placeholders to get dynamic data in alerts. Valid placeholders are
{alertType} - Alert type - New/Update/Close
{id} - Pattern Id
{ticker} - Ticker
{timeframe} - Chart timeframe
{price} - Current price
{patterns} - Identified pattern names
{direction} - Direction - Long/Short
{entry} - Entry Price
{stop} - Stop Price
{target} - Target Price
{orderType} - Limit/Stop - applicable for only New and Update types
{status} - Trade status. Valid values are Pending/Cancelled/Stopped/Success
Template is common for all custom alert types. Hence, updating the template will impact all custom alerts - New/Update/Close
{
"alert" : "{alertType}",
"id" : {id},
"ticker" : "{ticker}",
"timeframe" : "{timeframe}",
"price" : {price},
"patterns" : "{patterns}",
"direction" : "{direction}",
"entry" : {entry},
"stop" : {stop},
"target" : {target},
"orderType" : {orderType}
"status" : {status}
}
Here is a video on how to customise the alerts using templates and placeholders - HOW-TO-Customize-Alerts-With-Placeholders
🎯 Miscellaneous :
These are simple settings to control display and backtest bars. If you are running alerts, we suggest turning of Open Trades and Drawings and limit backtest to minimal value in order to improve efficiency of
🎯 Backtest Engine Parameters :
Default settings are optimised for trend following. Users are encouraged to play around with settings and filters to build strategy out of this tool.
Position sizing is not leveraged. Margin settings makes sure that trades cannot exceed capital.
All measures are taken to avoid repainting. Script does not use request.security and real time bars. This drastically reduces the risk of repainting in scripts.
If you are premium user, please select "Bar Magnifier".

Wolfe Strategy [Trendoscope]Hello Everyone,
Wish you all Merry X-Mas and happy new year. Lets start 2023 with fresh new strategy built on Wolfe Indicator. Details of the indicator can be found here
🎲 Wolfe Concept
Wolfe concept is simple. Whenever a wedge is formed, draw a line joining pivot 1 and 4 as shown in the chart below:
For simplicity, we will only consider static value for Target and Stop. But, entry is done based on breaking the triangle. Revised strategy looks something like this:
🎲 Settings
Settings are simple and details of each are provided via tooltips.
Out of these, the most important one is minimum risk reward ratio. If you set lower risk reward threshold then losing few trades may generate more losses than more winning trades. Similarly higher value will filter out most of the trades and may not work efficiently. Default value set to 1 to make sure optimal risk reward is present before placing trade. Also make note that since the entry bar is always moving towards stop, as and when pattern progress, the RR will also increase. Hence, a pattern which is below RR threshold may become good to trade at certain point of time in future.
🎲 Strategy Parameters
Default strategy parameters are initialised via definition. Margins are set to 100 to disable leveraged trades. Appropriate values are chosen for other parameters. These can be altered based on individual strategy and trading plan.
As the strategy concentrates on the single pattern, number of trades generated are comparatively less. But, there is chance to increase the algorithm further to catch more such patterns on larger scale. Will try to work on them in next versions.
🎲 Pine Strategy limitations
Backtest can only be done on one direction as pine strategy cannot have both long and short open trades together. Hence, it is mandatory to chose either long/short trades in settings.
Since pyramiding is limited to 1, there is possibility of a pattern not generating trade even though the entry conditions are met. They are just based on pine limitations and not necessarily mean patterns are not good for placing trades.

Simple Momentum and Trend, Fixed PnL Strategy for SPY 1D [SR]This strategy uses an ATR rule to assess momentum and a TSI rule to assess bullish or bearishness
It has a fixed stop at 50 points, and fixed take profit at 300 pips
It provides a very satisfyingly smooth equity line with a max drawdown below 5% and realized profit over 200%
This is the initial version as I work out optimizations and add plots to the chart based on the strategy's actions.
I would love to get the community's feedback and help as I'm new. Not sure how to limit the date range of the backtest to make it more realistic. I'm also not certain how to plot it best.

RSI and MA with Trailing Stop Loss and Take Profit (by Coinrule)The relative strength index is a momentum indicator used in technical analysis. It measures the speed and magnitude of a coin's recent price changes to evaluate overvalued or undervalued conditions in the price of that coin. The RSI is displayed as an oscillator (a line graph essentially) on a scale of zero to 100. When the RSI reaches oversold levels, it can provide a signal to go long. When the RSI reaches overbought levels, it can mark a good exit point or alternatively, an entry for a short position. Traditionally, an RSI reading of 70 or above indicates an overbought situation. A reading of 30 or below indicates an oversold condition.
A moving average (MA) calculates the average of a selected range of prices, usually closing prices, by the number of periods in that range. Essentially it is used to help smooth out price data by creating a constantly updated average price.
The Strategy enters and closes trades when the following conditions are met:
Entry Conditions:
RSI is greater than 50
MA9 is greater than MA50
RSI increases by 5
Exit Conditions:
Price increases by 1% trailing
Price decreases by 2% trailing
This strategy is back-tested from 1 January 2022 to simulate how the strategy would work in a bear market. The strategy provides good returns.
The strategy assumes each order is using 30% of the available coins to make the results more realistic and to simulate you only ran this strategy on 30% of your holdings. A trading fee of 0.1% is also taken into account and is aligned to the base fee applied on Binance.

Weird Renko StratThis strategy uses Renko, it generates a signal when there is a reversal in Renko. When using historical data, it provides a good entry and an okay exit. However, in a real-time environment, this strategy is subject to repaint and may produce a false signal.
As a result, the backtesting result should not be used as a metric to predict future results. It is highly recommended to forward-test the strategy before using it in real trading. I forward test it from 12/18/2022 to 12/21/2022 in paper trading, using the alert feature in Tradingview. I made 60 trades trading the BTCUSDT BINANCE 3 min with 26 as the param and under the condition that I use 20x margin, compounding my yield, and having 0 trading fee, a steady loss is generated: from $10 to $3.02.
This is quite interesting. As if I flip the signal from "Long" to "Short" and another way too, it will be a steady profit from $10 to $21.85. Hence, if I'm trying to anti-trade the real-time alert signal, the current "4 Days Result" will be good. Nevertheless, I still have to forward-test it for longer to see if it will fail eventually.
Dive into the setting of the strategy
- Margin is the leverage you use. 1 means 1x, 10 means 10x. It affects the backtest yield when you backtest
- Compound Yield button is for compound calculation, disable it to go back to normal backtesting
- Anti Strategy button is to do the opposite direction trade, when the original strat told you to "Long", you "Short" instead. Enable it to use the feature
- Param is the block size for the Renko chart
- Drawdown is just a visual tool for you in case you want to place a stop loss (represent by the semitransparent red area in the chart)
- From date Thru Date is to specify the backtest range of the strategy, This feature is turned off by default. It is controlled by the Max Backtest Timeframe which will be explain below
- Max Backtest Timeframe control the From date Thru Date function, disable it to enable the From Date Thru Date function
Param is the most important input in this strategy as it directly affects performance. It is highly recommended to backtest nearly all the possible parameters before deploying it in real trading. Some factors should be considered:
- Price of the asset (like an asset of 1 USD vs an asset of 10000 USD required different param)
- Timeframe (1-minute param is different than 1-month param)
I believe this is caused by the volatility of the selected timeframe since different timeframe has different volatility. Param should be fine-tuned before usage.
Here is the param I'm using:
BTCUSDT BINANCE 3min: 26
BTCUSDT BINANCE 5min: 28
BTCUSDT BINANCE 1day: 15
Background of the strategy:
- The strategy starts with $10 at the start of backtesting (customizable in setting)
- The trading fee is set to 0.00% which is not common for most of the popular exchanges (customizable in setting)
- The contract size is not a fixed amount, but it uses your balance to buy it at the open price. If you are using the compound mode, your balance will be your current total balance. If you are using the non-compound mode, it will just use the $10 you start with unless you change the amount you start with. If you are using a margin higher than 1, it will calculate the corresponding contract size properly based on your margin. (Only these options are allowed, you are not able to change them without changing the code)

Macro Score - DFMA-BasedA "macro score", as defined here, is created by giving various weights to different signals and adding them together to get one smooth score. Positive or negative values are assigned to each of the signals depending on if the statement is true or false (e.g. DPO > 0: +1, DPO < 0: -1). This manner of strategy allows for a subset of the available signals to be present at one time as opposed to every technical signal having to be active in order for a long/short signal to trigger.
The DFMA - Democratic Fibonacci Moving Average - is a separate indicator that we have released that takes 10 different Fibonacci MAs (lengths of 3 to 233, at Fibonacci intervals) and averages them to form the DFMA line. This helps by creating a consensus on the trend based on moving averages alone. Crossovers of the DFMA with the various Fib MA lengths as well as a cross of the price source and these lines can provide adequate long and short signals.
This strategy has the signals and weights pre-determined in the code. Heaviest weights have been given to crosses of the DFMA line/Fib MA (233) as well as the crosses of the Fib MA (3)/DFMA. Additionally, there are thresholds for DPO ( Detrended Price Oscillator , above or below 0), CMO ( Chande Momentum Oscillator , above or below 0), Jurik Volatility Bands (above or below 0), and Stoch RSI (above or below 50). These foursignals hold a lighter weight than the MA cross signals.
The macro score itself is printed in an underlay as a white line that goes between -10 and 10 for this strategy. In addition to the macro score line, a blue momentum line (sourced by the macro score itself) has been included. A crossover/crossunder of the macro score and the macro momentum line is included into the long/short signal syntax in addition to a threshold for the macro score (-5/5).
Take profit, stop loss, and trailing percentages are also included, found at the bottom of the Input tab under “TT and TTP” as well as “Stop Loss”. Make sure to understand the TP/SL ratio that you desire before use, as the desired hit rate/profitability percentage will be affected accordingly. This strategy does NOT guarantee future returns. Apply caution in trading regardless of discretionary or algorithmic. Understand the concepts of risk/reward and the intricacies of each strategy choice before utilizing them in your personal trading.
Profitview Settings:
If you wish to utilize Profitview’s automation system, find the included “Profitview Settings” under the Input tab of the strategy settings menu. If not, skip this section entirely as it can be left blank. Options will be “OPEN LONG TITLE”, “OPEN SHORT TITLE”, “CLOSE LONG TITLE”, and “CLOSE SHORT TITLE”. If you wished to trade SOL, for example, you would put “SOL LONG”, “SOL SHORT”, “SOL CLOSE LONG”, and “SOL CLOSE SHORT” in these areas. Within your Profitview extension, ensure that your Alerts all match these titles. To set an alert for use with Profitview, go to the “Alerts” tab in TradingView, then create an alert. Make sure that your desired asset and timeframe are currently displayed on your screen when creating the alert. Under the “Condition” option of the alert, select the strategy, then select the expiration time. If using TradingView Premium, this can be open-ended. Otherwise, select your desired expiration time and date. This can be updated whenever desired to ensure the strategy does not expire. Under “Alert actions”, nothing necessarily needs to be selected unless so desired. Leave the “Alert name” option empty. For the “Message”, delete the generated message and replace it with {{strategy.order.alert_message}} and nothing else.
Default Properties, for AVAX 20M:
DPO - 40, uncentered
CMO - 25, open
K/D - 3/3
RSI Stoch Length - 3
Stoch Length - 4
Stoch Source - open
JVB Length - 25
JVB Smoothing - 2
DFMA source - close
Macro Length - 13
TP % - 1.5%
TTP % - 0.005%
SL % - 2%

[Strategy]Turtle's 20day High Low Break StrategyJapanese below / 日本語説明は下記
Overview
I have made this strategy mimicking the legendary traders group, Turtle’s 20days high low break strategy with more options available for take profit(TP) and stop loss(SL) conditions.
The main component of the strategy is same as my indicator, Previous N days/weeks/months high/low(see the link below) and with this strategy, you can backtest previous N days high/low break strategy.
Unlike the indicator, you can specify another previous N days high/low as TP condition. This is because Turtle used 10days low as TP condition for 20days high break buy strategy, according to articles/books about them.
ATR and other factors which is said to be used in their original strategy are not included in this strategy.
Previous N Days/Weeks/Months High Low
What is Turtle?
Turtle is the group of traders founded by Richard Dennis and William Eckhardt to prove their theory that good traders can be trained or not.
It is said that Turtle had made more than 175 million dollars over 5 years and some of the traders has become fund managers or successful individual traders even after the experiment.
What is this strategy like?
The strategy generates long entries once prices break previous N days highs and short entries when previous N days lows broken.
N is user input so you can adjust it for your own strategy.
As mentioned above, you can also specify another set of different previous N days high/low for TP conditions.
e.g. 55 days high(low) break for entry and 20days low(high) break for take profit condition.
How to use it?
What this strategy shows is almost same as the indicator, Previous N days/weeks/months high/low.
It displays previous N days/weeks/months highs and lows and you can set up entry condition based on previous N days high/low.
Previous N weeks/months highs/lows can be used as take profit points when you develop your own strategy based on this.
See the parameters below for the rest of the details.
Parameters
TP condition:
You can select from “Pips”, “When opposite entries” or “Previous high low break”.
When “When opposite entries” selected, the strategy exits the open positions when opposite directional entries happened. e.g. Long positions will be closed when short entries made.
If you would like to exit positions with specific previous N days highs/lows, you can enter N in Previous N days High/Low for TP field with “Previous high low break” selected.
SL condition:
You can select from “Pips” or “Swing High/Low”.
If “Swing High/Low” selected, left bars and right bars need input to determine swing high/low.
Note: If you select “pips” in TP/SL conditions, it currently works only for forex pairs.
What timeframe is the best for this strategy?
As this strategy is for swing trading, longer timeframes are the best.
Base on my quick check upon strategy’s performance over USD pairs in forex, daily timeframe works best, however, it could fit in with lower timeframes such as 4H and 1H by adjusting TP/SL conditions.
Look at the sample result below. The result shows the strategy’s performance for USDJPY for over 40 years on Daily timeframe and it performs fairly good with more than 2 profit factor over long period of time with up-trending equity curve.
It is just a simulation but the data shows Turtle’s strategy still works.
=================
概要
伝説のトレーダー集団タートルの20日高値・安値ブレイク手法を模倣して作成したストラテジーです。
利益確定や損切り条件を設定可能なようにして、より柔軟性を持たせています。
ストラテジーの主要な構造は過去にリリースしたインジケーターPrevious N days/weeks/months high/lowと同じです(下記リンク参照)。
このストラテジーを使うと、過去N日高値・安値のブレイク手法のバックテストを行うことが可能です。
また、前述のインジケーターとは異なり、このストラテジーでは利益確定条件のために、もう一つ別の過去N日高値・安値を設定することができます。これはタートルが20日高値のブレイクで買いエントリーを行う場合、10日安値ブレイクを手仕舞いの基準として使っていたことからです。
タートルのオリジナル手法ではATRやその他の要素も用いられていたようですが、このストラテジーには含まれていません。
Previous N Days/Weeks/Months High Low
タートルとは何か?
タートルとは、「優れたトレーダーは育成可能か?」の問いを証明するために、投資家リチャード・デニス氏とウィリアム・エックハート氏によって組織されたトレーダー集団です。
タートルは5年間に渡って1億7千5百万ドル以上を稼ぎ出したと言われており、この実験終了後にはヘッジファンドを運営する者や個人投資家として成功したトレーダーを輩出したことで知られています。
このストラテジーの特徴
このストラテジーは、価格が過去N日高値をブレイクした時にロングエントリーを、過去N日安値をブレイクした時にショートエントリーを実行します。
Nはパラメーターで指定可能なので、皆さんの独自の手法開発のために調整することができます。
また、前述の通り、利益確定条件としてエントリー条件とは別の過去N日高値・安値を指定することが可能です。
例:エントリーには55日の高値・安値のブレイクを用い、決済には20日高値・安値のブレイクを用いるなど。
使い方
このストラテジーは前述のインジケーターとほぼ同じ内容のラインを表示します。
過去N日、N週間、Nヶ月の高値・安値を表示でき、エントリーの条件として過去N日高値・安値を指定することができます。
過去N週・Nヶ月高値・安値ラインは利益確定の目安に用いるなど、皆さんが独自の手法を構築するときの参考として使ってください。
その他のパラメーターについては以下の詳細を参照ください。
パラメーター:
TP condition(利益確定条件):
“Pips(Pips指定)”, “When opposite entries(逆方向エントリー時)” or “Previous N days high low break(過去N日高値・安値)”から選択することができます。
“When opposite entries” を選択した場合、現在のポジションは、現在ポジションとは逆方向のエントリー条件が満たされた時に、決済されます。
例: ロングポジションはショートのエントリーが実行されると同時に決済される。
特定の過去N日高値・安値ブレイクを決済条件としたい場合は、“Previous N days high low break”を選択の上、該当するN日を”Previous N days High/Low for TP”の項目に入力してください。
SL condition(損切り基準):
“Pips(Pips指定)”、“Swing High/Low(スウィングハイ・ロー)”から選択することができます。
“Swing High/Low”選択時は、高値・安値決定に必要な左右のバーの本数を指定します。
注:TP、SL条件でPipsを選択した場合は、現時点では為替通貨ペアのみに機能します。
このストラテジーに最適の時間軸は?
当ストラテジーはスウィングトレードの手法となっているため、長期の時間軸が適しています。
為替のドルストレートペアでの結果を見てみると日足が最も適していますが、利益確定や損切り条件を調整することで、4時間足や1時間足向きにもアレンジできると思います。
上に示したストラテジーの例は、ドル円の日足における過去40年間以上でのバックテストの結果ですが、これだけの長期に渡って右上がりのエクイティカーブとともにプロフィットファクター2近くを維持するなど、かなり良い結果と言えるのではないでしょうか。
これは一つのシミュレーション結果に過ぎませんが、データを見る限りタートルの手法は現在でも機能すると言えるでしょう。

EURUSD COT Trend StrategyThis is a long term/investment type of strategy designed to have a good idea about where the big trend direction is headed.
Its logic, its made entirely on the COT report, mainly from looking into the net non comercial positions aka the speculators.
For bullish trend we look that the difference between long non comercial vs short non comercial is higher than 0
For bearish trend we look that the difference between long non comercial vs short non comercial is lower than 0.
This is mainly as an educational tool, for a full strategy, I recommend implement other things into it, like technical analysis or risk management.
If you have any questions, please let me know !

Wunder Trend Reversal botWunder Trend Reversal bot
1. Wunder Trend Reversal Bot - this has only one goal to find a reversal of the trend.
2. The strategy determines, based on the specified value for the filter, a market reversal based on the price actions of the previous bars.
3. A short EMA is used to filter false signals after the reversal signal was received. Crossing the EMA and changing its direction confirms the trend change.
4. There are 2 ways to calculate stop loss and take profit. You can choose one of them:
- Classic stop loss and take profit in a fixed percentage
- ATR stop loss and take pro
5. ATR uses risk reward (R:R) to calculate take profit. The script calculates the risk-reward based on a certain stop loss level and uses it to calculate the take profit
6. A function for calculating risk on the portfolio (your deposit) has been added to the script. When this option is enabled, you get a calculation of the entry amount in dollars relative to your Stop Loss. In the settings, you can select the risk percentage on your portfolio. The loss will be calculated from the amount that will be displayed on the chart.
For example. Deposit - $1000, you set the risk to 1%. SL 5%. Entry volume will be $200. The loss at SL will be $10.10$ this is your 1% risk or 1% of the deposit.
Important! The risk per trade must be less than the Stop Loss value. If the risk is greater than SL, then you should use leverage.
The amount of funds entering the trade is calculated in dollars. This option was created if you want to send the dollar amount from Tradingview to the exchange. However, putting your volume in dollars you get the incorrect net profit and drawdown indication in the backtest results, as TradingView calculates the backtest volume in contracts.
To display the correct net profit and drawdown values in Tradingview Backtest results, use the ”Volume in contracts” option.

Fast EMA above Slow EMA with MACD (by Coinrule)An exponential moving average ( EMA ) is a type of moving average (MA) that places a greater weight and significance on the most recent data points. The exponential moving average is also referred to as the exponentially weighted moving average . An exponentially weighted moving average reacts more significantly to recent price changes than a simple moving average simple moving average ( SMA ), which applies an equal weight to all observations in the period.
Moving average convergence divergence ( MACD ) is a trend-following momentum indicator that shows the relationship between two moving averages of a security’s price. The MACD is calculated by subtracting the 26-period exponential moving average ( EMA ) from the 12-period EMA .
The result of that calculation is the MACD line. A nine-day EMA of the MACD called the "signal line," is then plotted on top of the MACD line, which can function as a trigger for buy and sell signals. Traders may buy the coin when the MACD crosses above its signal line and sell—or short—the security when the MACD crosses below the signal line. Moving average convergence divergence ( MACD ) indicators can be interpreted in several ways, but the more common methods are crossovers, divergences, and rapid rises/falls.
The Strategy enters and closes the trade when the following conditions are met:
LONG
The MACD histogram turns bullish
EMA8 is greater than EMA26
EXIT
Price increases 3% trailing
Price decreases 1% trailing
This strategy is back-tested from 1 January 2022 to simulate how the strategy would work in a bear market and provides good returns.
Pairs that produce very strong results include AXSUSDT on the 5-minute timeframe. This short timeframe means that this strategy opens and closes trades regularly.
Additionally, the trailing stop loss and take profit conditions can also be changed to match your needs.
The strategy assumes each order is using 30% of the available coins to make the results more realistic and to simulate you only ran this strategy on 30% of your holdings. A trading fee of 0.1% is also taken into account and is aligned to the base fee applied on Binance.

ETHUSDT Long-Short using EMA,OBV,ADX,LinearReg,DXY(No repaint)This script strategy is used to follow the trending EMA with a delta difference (Price-EMA) to know when to enter and with 5 variables mentioned below, stop loss is below EMA line all the time in long and above EMA line in short, is like a trailing stop after candle is closed. Hard stop is also placed to prevent big candles movements, also correlation between VIX and ETH when the correlation is <-0.2 the position can be opened.
Indicators used:
EMA , OBV , ADX , Linear regression and Dollar Index trending, Leverage is available for Long and Short positions.
LONG
When Price is above EMA and price-ema difference is smaller than "Long delta Price/MA"
OBV(4hrs) is above OBV-EMA(110)
Linear regression is strong
ADX is strong >50
DXY is trending down
SHORT
When Price is below EMA and ema-price difference is smaller than "Long delta Price/MA"
OBV(4hrs) is below OBV-EMA(110)
Linear regression is weak
ADX is weak <50
DXY is trending up
BINANCE:ETHUSDT 30 minutes Timeframe
US Market Balance of Power Heikin Ashi Swing StrategyThis is a swing strategy, using the power of correlation, mainly designed for an investment approach for the US Market.
It uses the original OBV formula, which has been adapted to monthly heikin ashi candles values, which are taken from the correlated asset, in this case we are using QQQ chart for testing, but internally we are using the logic from SPY chart for calculations.
Once we that value, we make a moving average of it with the length of half of a year to have an idea about the overall price trend during that period of time.
After that, we are going to apply a percentile formula for the OBV value, and we are going to look for the percentile near 100th rank of the entire history of that data.
Finally once we have the top percentile values, we are going to create different formulas for long and short entries:
Short Entry/ Long exit = Current top percentile is higher than the previous top percentile value
Long Entry/ Short Exit = Current obv value is negative and the top percentile is smaller than the previous one or we are near the top values for the OBV oscillators ( crossing upwards previous candle/downwards current candle)
The strategy has been tested using 25% of the entire initial capital available in order to have an idea about the compound effect over the entire history of time which was selected.
From the test which can determine, that on average when we have strong bullish trends, the initial buy n hold strategy outperforms us, however the strategy is definitely a winner when there are side market/ bearish periods of time since it will help cut losses during these periods.
If you have any questions, please let me know !

Trend Following based on Trend ConfidenceThis is a Trend Following strategy based on the Trend Confidence indicator.
The goal of this strategy is to be a simple Trend Following strategy, but also to be as precise as possible when it comes to the question 'how confident are we that a linear trend is ongoing?'. For this we calculate the 'confidence' of a linear trend in the past number of closing prices. The idea of this strategy is that past a certain confidence, the ongoing linear trend is more likely to continue than not.
Trend Confidence:
The Trend Confidence shows us how strong of a linear trend the price has made in the past number (given by Length parameter) of closing prices. The steepness of the price change makes the Trend Confidence more extreme (more positive for an uptrend or more negative for a downtrend), and the deviation from a straight line makes the Trend Confidence less extreme (brings the confidence closer to 0). This way we can filter out signals by wild/sudden price moves that don't follow a clear linear trend.
Math behind the Trend Confidence:
A linear fit is made on the past number of closing prices, using Ordinary Linear Regression. We have the steepness of the linear fit: b in y=a+bx . And we have the standard deviation of the distances from the closing prices to the linear fit: sd . The Trend Confidence is the ratio b/sd .
Entries and Exits:
For entry and exit points we look at how extreme the Trend Confidence is. The strategy is based on the assumption that past a certain confidence level, the ongoing linear trend is more likely to continue than not.
So when the Trend Confidence passes above the 'Long entry" threshold, we go Long. After that when the Trend Confidence passes under the 'Long exit' threshold, we exit. The Long entry should be a positive value so that we go Long once a linear uptrend with enough confidence has been detected.
When the Trend Confidence passes below the 'Short entry' threshold, we go Short. After that when the Trend Confidence passes above the 'Short exit' threshold, we exit. The Short entry should be a negative value so that we go Short once a linear downtrend with enough confidence has been detected.
Default Parameters:
The strategy is intended for BTC-USD market, 4 hour timeframe. The strategy also works on ETH-USD with similar parameters.
The Length is arbitrarily set at 30, this means we look at the past 30 closing prices to determine a linear trend. Note that changing the length will change the range of Trend Confidence values encountered.
The default entry and exit thresholds for Longs and Shorts do not mirror each other. This is because the BTC-USD market goes up more heavily and more often than it goes down. So the ideal parameters for Longs and Shorts are not the same.
The positive results of the strategy remain when the parameters are slightly changed (robustness check).
The strategy uses 100% equity per trade, but has a 10% stop loss so that a maximum of 10% is risked per trade.
Commission is set at 0.1% as is the highest commission for most crypto exchanges.
Slippage is set at 5 ticks, source for this is theblock.co.
