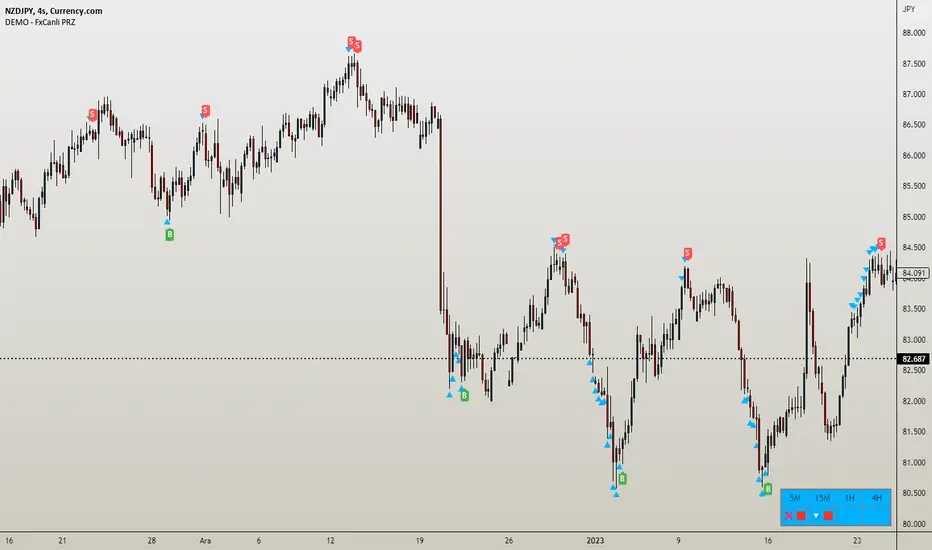
DEMO - FxCanli PRZEN - FxCanli PRZ indicator shows Price Reversel Zones on your charts.
DEMO VERSION of FXCANLI PRZ Indicator work with any NZD or any DOGE symbols
TR - FxCanli PRZ indikatörü grafiklerinizde olası dönüş bölgelerini gösterir.
FXCANLI PRZ indikatörünün DEMO VERSİYONUNU herhangi bir NZD veya DOGE sembolü ile kullanabilirsiniz.
EN - For Example | TR - Örnek
NZD|...
NZD|USD
NZD|CAD
NZD|CHF
NZD|JPY
DOGE|...
DOGE|USD
DOGE|USDT
DOGE|USDTPERP
DOGE|BTC
FEATURES & EXAMPLES / ÖZELLİKLER & ÖRNEKLER
**************************************************************
Multi Language / Çok Dil
EN - You can get alerts in English or Turkish language
TR - Alarmları İngilizce veya Türkçe olarak alabilirsiniz.
Bullish - Bearish PRZ / Boğa - Ayı yönlü PRZ
EN - You can choose Bullish and Bearish PRZ or either
TR - Boğa ve Ayı yönlü veya herhangi birini seçebilirsiniz
Buy - Sell Labels / Al -Sat Etiketleri
EN - You can see (S)ell label and (B)uy label at the end of Price Reversal Zones
TR - Olası Dönüş Bölgelerinin sonunda (S)ell-Sat etiketini ve (B)uy-Al etiketini görebilirsiniz.
Panel Properties / Panel Özellikleri
EN - In the panel settings, you can follow up with different characters and emojis when you enter the PRZ, at the PRZ and exit from PRZ.
TR - Panel ayarlarında, olası dönüş bölgesine girdiğinde, olası dönüş bölgesinde ve olası dönüş bölgesinden çıktığını faklı karakter ve emojiler ile takip edebilirsiniz
Multi Timeframe / Çoklu Zaman dilimi
EN - You can easly follow all timeframes at one chart
TR - Tüm zaman dilimlerini tek bir grafikte takip edebilirsiniz
EN - Panel Width - to get better view at mobile phones and tablets
TR - Cep telefonları ve tabletlerde daha güzel görünüm için Panel Genişliği
Alerts / Alarmlar
EN - You can set only one alert for all timeframe and all prz alerts
TR - Bir alarm kurarak, tüm zaman dilimlerinde PRZ alarmlarını alabilirsiniz
Trendreversal
Trend Analysis Ultimate (Zeiierman)█ Overview
Trend Analysis Ultimate (Zeiierman) highlights meaningful pullbacks within active market trends and visualizes them through green and red columns, retracement triangles, and an optional trend-colored background. It is designed to make the distinction between continuation and transition phases clear at a glance while automatically managing dynamic trailing stops, early and partial profit-taking levels, and alert conditions for entries, take-profits, and full exits.
The system adapts to changing market structure in real time, allowing traders to monitor momentum shifts, retracement strength, and phase transitions with precision. By combining structural mapping with adaptive sensitivity controls, it provides a complete framework for identifying where a trend is likely to continue, pause, or reverse.
⚪ Why This One Is Unique
Unlike traditional trend tools that simply color bars or measure moving averages, Trend Analysis Ultimate integrates retracement mapping with trend phase detection. Its framework merges contextual structure analysis (higher highs/lows or lower highs/lows) with dynamic sensitivity controls, identifying both the rhythm and the stress points within a trend.
Through a unified signal logic and adaptive retracement engine, traders can distinguish between normal pullbacks within a trend and retracements that precede reversal — all visualized with intuitive, color-coded accuracy.
█ Main features
⚪ Retracements
A retracement is a temporary move against the prevailing trend. It often signals a pause, potential continuation opportunity, or the early stages of a reversal. In this indicator, green/red retracement columns mark significant pullbacks that frequently precede new local highs/lows, continuation legs, or the end of a trend.
Key concept: Retracements appear at both continuation points and turning points. The trader’s edge is in recognizing whether the pullback is a reset of strength or the first warning that the current trend is losing control.
Bullish Retracement
Bearish Retracement
⚪ Retracements Signals
The Retracement Signals feature highlights the precise moments when a temporary counter-move within a dominant trend shows signs of exhaustion and potential continuation. It converts early momentum shifts into clear bullish or bearish setup signals.
Bullish Retracement Signal
Bearish Retracement Signal
⚪ Trend
The Trend Feature visually defines the current market regime — bullish, bearish, or neutral — by dynamically coloring bars, the indicator background, and the Confirmed Trend Columns in the lower panel. Together, these elements reflect the underlying directional bias detected by the trend engine, providing immediate context for all retracement, continuation, and entry signals.
Green bars, background, and confirmed columns → Active Bullish Trend Phase
Red bars, background, and confirmed columns → Active Bearish Trend Phase
Light or neutral bars → Transition Phase, signaling potential trend change or reduced directional strength.
█ How to Use
⚪ Major Retracements / Pullbacks
Major Bullish Retracements
Step 1: Ask Key Context Questions
When green retracement columns appear in the indicator window, ask yourself:
Are we in a bullish trend? Look for higher highs (HH) and higher lows (HL). Confirm that trendlines are pointing upward.
Is this forming a higher low? Green columns often print during pullbacks, just before price forms a higher low and the uptrend continues.
Is this a healthy correction? If price respects previous structure or the rising trendline, and the green bars begin shrinking, it indicates renewed strength and that the pullback may be ending.
Step 2: Apply Practically
If the answers above are Yes, the retracement likely represents a continuation opportunity.
Confirm an uptrend (HH/HL structure, rising trendlines).
Treat green columns as a pullback zone within that trend.
Watch for confirmation such as:
Rejection candles near support
Break of a short-term downtrend line
Volume confirming renewed buying pressure
Enter once price resumes upward movement, not during the retracement itself.
Major Bearish Retracements
Step 1: Ask Key Context Questions
When red retracement columns appear in the indicator window, ask yourself:
Are we in a bearish trend? Check if lower highs (LH) and lower lows (LL) are forming, and confirm that trendlines are pointing downward.
Is this forming a lower high? Red columns often appear during pullbacks, just before price forms a lower high and the downtrend resumes.
Is this a healthy correction? If price respects prior resistance or a falling trendline, and the red bars begin shrinking, it signals renewed weakness and that the pullback may be ending.
Step 2: Apply Practically
If the answers above are Yes, the retracement likely marks a continuation opportunity in the prevailing downtrend.
Confirm a downtrend (LH/LL structure, falling trendlines).
Treat red columns as a pullback zone within that trend.
Watch for confirmation such as:
Rejection candles near resistance
Break of a short-term uptrend line
Volume confirming renewed selling pressure
Enter once price resumes downward movement, not during the retracement itself.
⚪ Minor Retracements / Pullbacks
Minor retracements represent short, fast counter-moves within an active trend. They often occur as quick pauses or micro-corrections and are best suited for scalping or short-term continuation setups. Always align these signals with the dominant background trend and confirm direction using clear trendlines to stay on the right side of market structure.
Minor Bullish Retracements
When price is in a clear uptrend and a small pullback occurs:
Watch for short sequences of green retracement impulses (▲) or shrinking green columns on the indicator.
Treat these as quick buy-the-dip zones within the larger bullish context.
Look for confirmation from trendline support or a rejection candle before entering.
Minor Bearish Retracements
When price is trending downward and a brief rally appears:
Watch for red retracement impulses (▼) or shrinking red columns indicating weakening upward correction.
Use these as potential short re-entry zones in line with the broader downtrend.
Confirm with rejection at resistance or a break of a short-term uptrend line.
⚪ Retracements Signals
Bullish Signals
Bullish Retracement Signals appear during an active uptrend, typically within retracement phases when the market experiences a short-term pullback against the main trend. These signals are triggered when the retracement shows signs of exhaustion and the indicator detects renewed buying momentum aligned with the broader bullish structure.
They highlight potential continuation points, where the price may resume making higher highs after completing a healthy correction. This setup leverages the natural rhythm of the market — capturing the moment buyers regain control following temporary weakness.
Bearish Signals
Bearish Retracement Signals form during an active downtrend, typically within counter-trend rallies or retracement phases against the dominant bearish direction. They emerge when temporary upward movement loses strength, and the indicator identifies renewed selling pressure aligned with the main trend.
These signals often precede fresh downside continuation — when sellers reassert control and push price toward new lower lows.
⚪ Identifying the End of One Trend and the Start of Another
Every trend eventually runs out of strength. Early signs often look like a normal retracement, a routine pullback within the existing move. But when price fails to attract enough buyers or sellers to continue in the same direction, that retracement can mark the turning point where momentum shifts and a new trend begins.
When price can no longer find support in an uptrend or resistance in a downtrend, it signals exhaustion of the current phase and a possible transition into the opposite direction. The retracement columns highlight these transition zones, areas where one trend may fade and another may start forming.
When they appear, it’s important to ask:
Is the current trend mature? The longer a trend has been running, the greater the likelihood of reversal. If retracement columns show up late in a multi-leg move, treat them as early warnings.
Are there reversal signs forming? Watch for structures like double tops, double bottoms, trendline breaks, or channel violations that suggest the trend’s strength is fading.
By combining retracement columns with a clear understanding of trend structure and price action, traders can better distinguish between healthy pullbacks and the emergence of a new trend.
Bullish Trend Ends
Bearish Trend Ends
█ How It Works
⚪ Trend Phase Architecture
The indicator models directional bias through a continuously adaptive trend-mapping framework. It classifies market states as bullish, bearish, or neutral based on slope polarity and structural persistence.
Calculation: Utilizes layered regression vectors and dynamic range analysis to estimate directional gradients, blending short- and long-term components to maintain stability while remaining responsive to new motion.
⚪ Retracement Detection Engine
Retracement columns quantify counter-movements within the dominant trend, identifying deceleration, pullback depth, and phase overlap. Each bar’s classification reflects the relative strength trend progression.
Calculation: Applies trend-state comparison with phase-weighted averaging to isolate transitional motion. The resulting dual-polar columns (green/red) are normalized to a zero-centered scale for visual symmetry and precision.
⚪ Impulse & Triangle Module
Retracement impulses (▲/▼) represent local acceleration spikes during pullback phases, revealing the moment when opposing momentum reaches statistical significance.
Calculation: Identifies short-term impulse clusters through curvature mapping to isolate localized bursts of directional momentum within the retracement phase.
⚪ Entry & Signal Logic
The entry module fuses retracement data with trend-state validation, filtering signals through contextual structure and confirmation hierarchy. Only qualified impulses aligned with the dominant vector trigger actionable events.
Calculation: Integrates a composite decision function using multi-phase sensitivity weighting, differential smoothing, and state gating to separate impulsive noise from valid continuation momentum.
-----------------
Disclaimer
The content provided in my scripts, indicators, ideas, algorithms, and systems is for educational and informational purposes only. It does not constitute financial advice, investment recommendations, or a solicitation to buy or sell any financial instruments. I will not accept liability for any loss or damage, including without limitation any loss of profit, which may arise directly or indirectly from the use of or reliance on such information.
All investments involve risk, and the past performance of a security, industry, sector, market, financial product, trading strategy, backtest, or individual's trading does not guarantee future results or returns. Investors are fully responsible for any investment decisions they make. Such decisions should be based solely on an evaluation of their financial circumstances, investment objectives, risk tolerance, and liquidity needs.
Skrip berbayar

Market Meanness Index [CC]The Market Meanness Index was created by Johann Christian Lotter and I added some smoothing of my own, so feel free to try it without any smoothing to see the differences. This indicator relies on the mean reversion theory that all prices will eventually revert to the mean over a long period of time. Obviously there is more to the theory but the basic idea is if you plot a sma or other typical moving average, you will see the price moving up or below the long term moving average such as a 200 day sma but usually heads back to the average in the short term. This is a good statistical analysis used for volatility which is where this indicator comes in. Simply put, we calculate volatility based on how often a price is both above the median and above the previous price or vice versa.
A rising Market Meanness Index means that the market is becoming more volatile and that there is a high likelihood of a change in the underlying trend. A falling Market Meanness Index means that the current trend is dying and there is a high likelihood of a trend reversal. Typically I put general buy and sell signals in red or green but in this particular case, this indicator works best as a overall trend filter and you would want to place a trade when this indicator has a peak or valley. Let me know if you find a good overall buy and sell signal system of course.
I know I keep saying that I will get active again and post more indicators but life is very hectic for me. For those who have been following my updates, my twins were finally born a little over a month ago and as you can imagine, they keep me up at all hours of the day so it is hard to create new indicator scripts when I'm getting no sleep lol. I will do my best to start publishing the giant backlog of scripts I have created but in the meantime, please be patient with me. This indicator was a special request so let me know if you have any special requests of your own!

Rob Booker Reversal Tabs StrategyRob Booker Reversal Tabs Strategy is an updated version of Rob Bookers Reversal Tab study: Rob Booker Reversal Tabs
While the original is a Pinescript study, this version can be switched between strategy and indicator mode.
Rob Bookers script generates reversal signal based on MACD and Stochastics, it is not a true reversal system, default pyramiding value is set to 5.
Inputs determine MACD and Stochastics settings. The only additional input is the "Strategy Mode" checkbox.
This script works well on its own for some tickers, but like any reversal pattern generating scripts, traders will profit from looking at overall price action and trend strength before making a trade.
From the original:
A simple reversal pattern indicator that uses MACD and Stochastics.
Created by Rob Booker and programmed by Andrew Palladino.
Please note that I only updated the original to V5 and edited it to be a strategy, which was a grand total of 5 minutes of work. I updated it because I wanted to see how the script performs as a strategy and I'm publishing it in case others would like to use it. I take no credit whatsoever for the original and WILL take this version down if Rob Booker or his Team ask me to or decide to release their own strategy version of the original.
Check out Rob Bookers scripts and ideas on his Tradingview account: robbooker

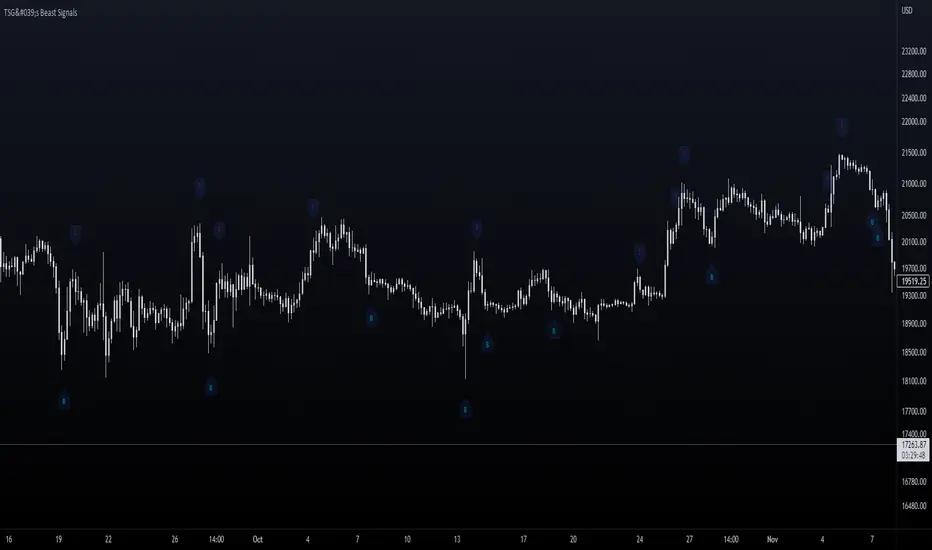
TSG's Beast SignalsThis indicator is built with the purpose of keeping things simple and user-friendly. It is a custom formula I developed lately and it signals pretty accurately changes of direction in the price.
Added an Alert option to it lately - with customizable messages.
_____________________________________________________
_____________________________________________________
HOW IT IS DONE
I make great use of the Average True Range indicator which is the best and simple volatility indicator out there and mix its behavior with several Moving Averages to catch exhaustions of trends and potential reversal points. Moving Averages are treated as bands and the price is kept within it (Something like Bollinger Bands , but custom).
_____________________________________________________
_____________________________________________________
WHAT TIMEFRAMES TO USE IT ON
The bigger the timeframe, the less noise you will have. It is playing out nicely to signal major trend reversal or retracements, but I used it for scalping aswell.
_____________________________________________________
_____________________________________________________
PLANS
Maybe MultiTimeframe table to align signals coming from different timeframes for better accuracy of entry?
Good Luck!
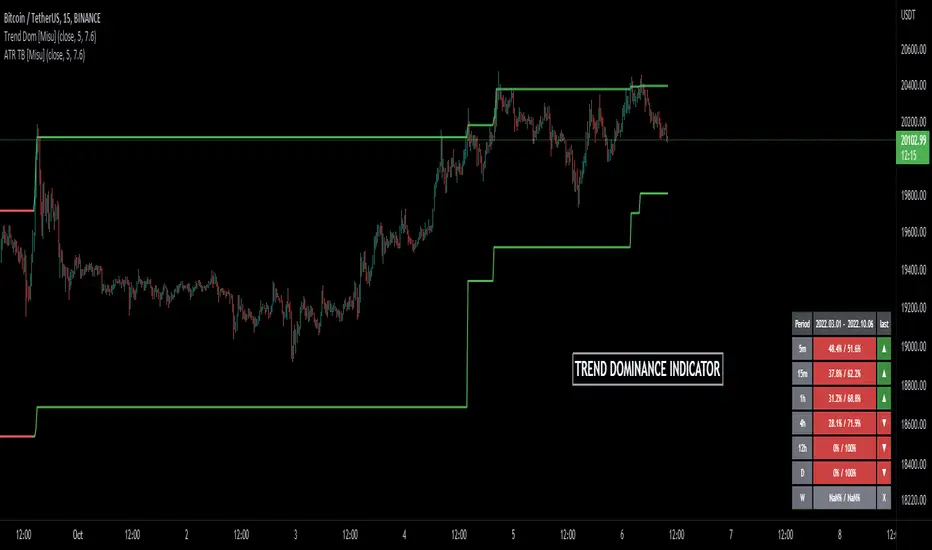
Trend Dominance Multi Timeframe [Misu]█ This indicator shows the repartition of bullish and bearish trends over a certain period in multiple timeframes. It's also showing the trending direction at the time.
█ Usages:
Trend dominance is expressed with two percentages: left is downtrend and right is uptrend. Cell colors turn green if dominance is up and red if it is down.
Knowing the trend dominance allows you to have a better overview of the market conditions.
You can use it to your advantage to favor long or short trades, reversal or breakout strategies, etc.
█ Features:
> Table colors
> Instant Trend Multitimeframe
> Trend Dominance Multitimeframe
█ Parameters:
> Length: Length is used to calculate ATR.
> Atr Multiplier: A factor used to balance the impact of the ATR on the Trend Bands calculation.
> UI Settings
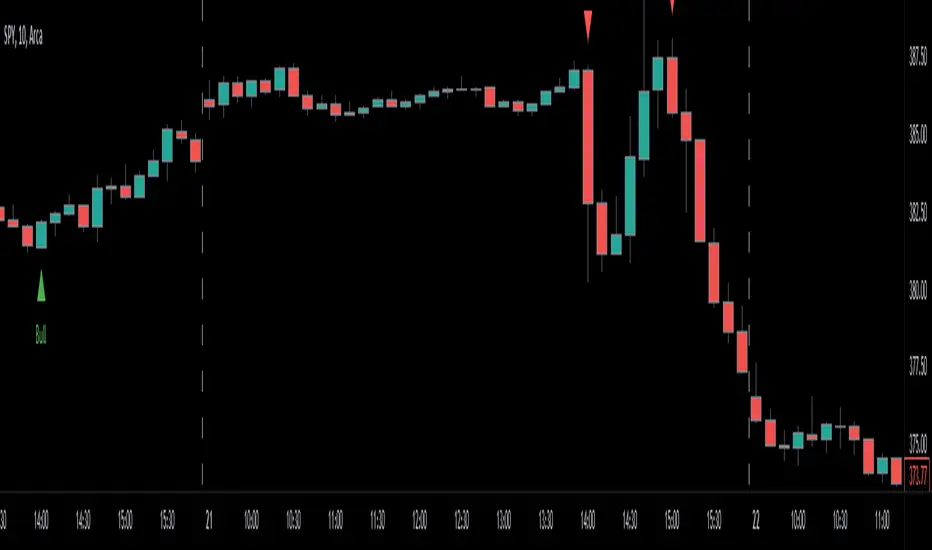
Engulfing Candles (Bullish and Bearish) + Trend | by Octopu$⛳ Engulfing Candles (Bullish and Bearish ) with Trend Recognition | by Octopu$
This Indicator identifies and plots Engulfing Candlestick Patterns.
Engulfing Candles are a combination of two bars on a price chart.
They are used to indicate/anticipate a market reversal.
The second candlestick must be bigger than the first, so it 'engulfs' the previous bar.
This indicator identifies both Price Movements:
Bullish stands for Upside
Bearish stands for Downside
These are NOT entry/exit signals to buy or sell securities*
(*The combination of your understanding and analysis as well as other Indicators and Factors as Confluence, you can improve your Charting Analysis.)
www.tradingview.com
SPY
ANY Ticker. ANY Timeframe.
( SPY 5m as an example only.)
Features:
• Engulfing Candles
• Bullish Setups
• Bearish Setups
• Symbol Signals
Options:
• Color Picker
• Symbol Selector
• Toggle On/Off
• Show name
• Trend Direction
Notes:
v1.0
Indicator release.
Changes and updates can come in the future for additional functionalities or per requests. Follow and Stay Tuned!
Did you like it? Please Support and Shoot me a message! I'd appreciate if you dropped by to say thanks! Thank you.
- Octopu$
🐙
ATR Trend Bands [Misu]█ This indicator shows an upper and lower band based on price action and ATR (Average True Range)
The average true range (ATR) is a market volatility indicator used in technical analysis.
█ Usages:
The purpose of this indicator is to identify changes in trends and price action.
It is mainly used to identify breaking points and trend reversals.
But it can also be used to show resistance or support levels.
█ Features:
> Buy & Sell Alerts
> Buy & Sell Labels
> Color Bars
> Show Bands
█ Parameters:
Length: Length is used to calculate ATR.
Atr Multiplier: A factor used to balance the impact of the ATR on the Trend Bands calculation.

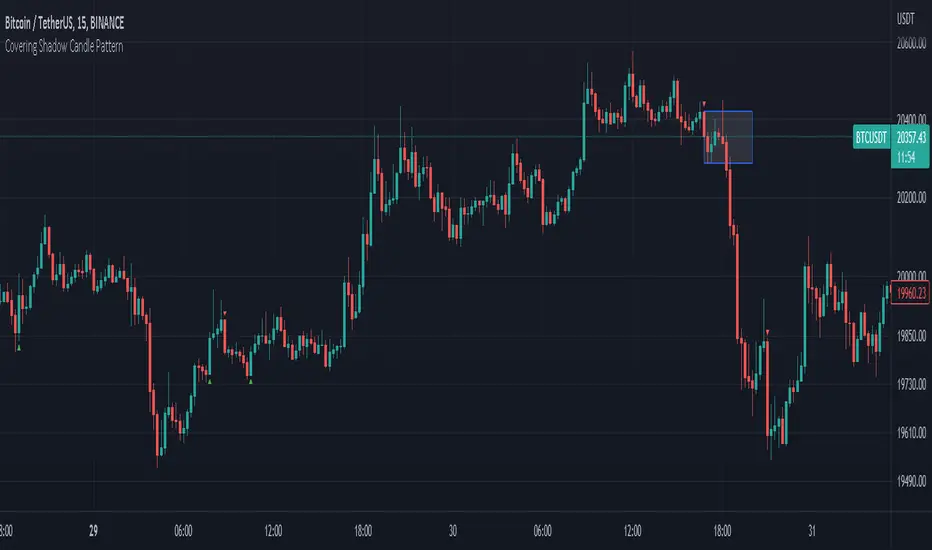
Covering Shadow Candle PatternThis indicator shows 3 types of objects on chart:
1. downward red triangle above a candle: 3 green candles followed by a fourth red candle of which the low price is lower than the low of the 3 previous green candles, this is usually the sign of reversal from upward movement to a downward one.
2. 1. upward green triangle below a candle: 3 red candles followed by a fourth green candle of which the high price is higher than the high of the 3 previous red candles, this is usually the sign of reversal from downward movement to a upward one.
3. boxes: these boxes are drawn when the patterns of cases 1 and 2 fails to perform as expected which means we have some important areas at that level so it can be a resistance or support zone .
Banknifty Volume - IN
This simple indicator computes the average Relative Strength Index of each Banknifty stock and displays the volume on the chart with color schemes while the average line indicates the average RSI of all Bank Stocks. This indicator works on Banknifty and its stocks.
It works on all time frames
How You can use this?
You can use this indicator for Volume analysis if the average RSI line is above the 0 line, the stock is moving upside and vice versa for Downside .

Trending Bollinger Bands by SiddWolfBollinger Bands are mostly used for trend reversal. I believe they should be used for Trend Continuation and Trend Confirmation.
In this Trending Bollinger Bands script you will see two bands drawn on chart. The Upper band is suggestive of Uptrend and Lower Band is suggestive of Downtrend Market. It just provides the guidance of where the market is now and where it is headed. It is not to be used as a standalone indicator. Use this to confirm your hypothesis of Uptrend or Downtrend.
Bollinger Bands Trend
When the price crosses the moving average it is interpreted as the price is gonna continue in that direction. But most of the time it is a fake breakout. With this script you get an additional confirmation so that you know it is not a fake breakout and the price have caught the trend.
Bollinger Bands Reversal:
This indicator can also work for reversal. For example when price closes outside the outer bands, it is most likely that the trend is gonna reverse. Don't just enter the trade wait for some other confirmation as reversal trading is more complicated.
Confluence:
Confluence is the key factor for profitable trading. Don't use this indicator as standalone indicator instead combine it with other indicators and price action. Like the divergence occurring when the price is outside the bands is suggestive of trend reversal. I have created a non-delay, non-repaint indicator for finding divergence. I'd soon publish that script. Stay tuned.
Settings is the Key:
Try to play around with the settings. It is a simple yet effective indicator. Change the moving average type or length. I've found moving average RMA or WMA works better than SMA. Find the best setting that works with your setup. Set the Band Source as High/Low to make the outer bands more extreme.
Conclusion:
This is my first script but it isn't my last. I've created quite a few gems that I'm gonna publish soon. If you have any questions or suggestions feel free to comment below. I'd love to connect with you. Thank you.

Haos Visual Divergence + Volume Analysis█ OVERVIEW
The Haos Visual Oscillators is a trend indicator that combines two William % indicators with different periods , to show Over Sold and Over Bought signals.
I have added Divergences and a volume indicator to check if buying or selling pressure is exhausted or showing divergences
this can help spot trend reversals
code taken from:
www.prorealcode.com
█ DESCRIPTION
Divergences:
• checks up to 20 pivot points to look for Divergences
• Divergences require single candle confirmation
• Divergences are only confirmed if oscillator pivot is of close proximity of a price pivot
Volume Indicator:
• checks for volume divergences or exhaustion
This is done by comparing relative change in price to the relative change in volume when oscillator is at over bought or over sold levels
indicator Columns:
• Yellow => divergence has been spotted
• Dim Yellow => divergence was spotted on the previous candle
• Blue => volume exhaustion was spotted
• Dim Blue => volume exhaustion was spotted on the previous candle
• Green => OverSold
• Red => OverBought
OB/OS:
• OverBough t => above 30
• OverSold => below -30
Alerts:
• Regular Bullish Divs
• Hidden Bullish Divs
• Regular Bearish Divs
• Hidden Bearish Divs
- if you realized that I posted 2 versions of the indicator :
• its because I named the first version wrongly on the publishing name and cant change it

Haus Visual Divergence + Volume Analysis█ OVERVIEW
The Haos Visual Oscillators is a trend indicator that combines two William % indicators with different periods , to show Over Sold and Over Bought signals.
I have added Divergences and a volume indicator to check if buying or selling pressure is exhausted or showing divergences
this can help spot trend reversals
code taken from:
www.prorealcode.com
█ DESCRIPTION
Divergences:
• checks up to 20 pivot points to look for Divergences
• Divergences require single candle confirmation
• Divergences are only confirmed if oscillator pivot is of close proximity of a price pivot
Volume Indicator:
• checks for volume divergences or exhaustion
This is done by comparing relative change in price to the relative change in volume when oscillator is at over bought or over sold levels
indicator Columns:
• Yellow => divergence has been spotted
• Dim Yellow => divergence was spotted on the previous candle
• Blue => volume exhaustion was spotted
• Dim Blue => volume exhaustion was spotted on the previous candle
• Green => OverSold
• Red => OverBought
OB/OS:
• OverBought => above 30
• OverSold => below -30
Alerts:
• Regular Bullish Divs
• Hidden Bullish Divs
• Regular Bearish Divs
• Hidden Bearish Divs

Leading Indicator [TH]The leading indicator is helpful to identify early entries and exits (especially near support and resistance).
Green = trend up
Red = trend down
How it works:
The leading indicator calculates the difference between price and an exponential moving average.
Adding the difference creates a negative lag relative to the original function.
Negative lag is what makes this a leading indicator.
The amount of lead is exactly equal to the amount of lag of the moving average.
The leading indicator has lagging signals at turning points.
The leading indicator will always have noise gain, which gets eliminated by applying a moving average.
Modifying the alpha values will modify the amount of noise and change the sensitivity of trend change.
Example 1: Changing alpha1 from 0.25 to 0.15 lowers noise, more clearly identifies trend, and adds delay to this indicator.
Example 2: Changing alpha1 from 0.25 to 0.35 increases noise, less clearly identifies trend, BUT more quickly indicates a trend change.
Calculations:
Where:
alpha1 = 0.25
alpha2 = 0.33
Leading = 2 * (arithmetical mean of current High and Low price) + (alpha1 - 2) * (arithmetical mean of previous High and Low price) + (1 - alpha1) * (previous 'Leading' value)
Total Leading = alpha2 * leading + (1 - alpha2) * (previous 'Total Leading' value)
EMA = 0.5 * (arithmetical mean of previous High and Low price) + 0.5 * (previous 'EMA' value)
Uptrend when 'Total Leading' value is greator than the EMA
Downtrend when 'Total Leading' value is lesser than the EMA
Cybernetic Analysis for Stocks and Futures, by John Ehlers (page 231-235)

Renko Candles OverlayHello All,
For long time I got many request for Renko Candles and now here it's, Renko Candles Overlay . I tried to make almost everything optional, so you can play with the options as you want.
Let see the options:
Method: the option for brick scaling method: ATR, ATR/2, ATR/4, Percent, Traditional
- ATR Period: period for Average True Range and it's valid if the method is ATR
- ATR/2 Period: period for Average True Range and it's valid if the method is ATR/2
- ATR/4 Period: period for Average True Range and it's valid if the method is ATR/4
- Traditional: User-defined brick size, it's valid if the method is Traditional
- Percent: Percent of Close price, it's valid if the method is Percent
if the method is not Traditional (fixed brick size) then Brick size is calculated/updated when new bricks added. so The box sizes may be different because of the calculation is dynamic.
Levels & Lines for new Bricks: if you enable this option then the script shows the levels for new brick
Change Bar Color: optionally the script changes the bar color by using direction of the bricks
and some other options for coloring.
The script shows the bricks for visible area, which is approximately 280 candles. so if you change the width and number of the bricks then number of bricks that is shown is adjusted automatically to fit the screen. you can see the examples below:
The script shows the levels to new brick as a line and label:
Because of real-time bar is not confirmed until the candle close, the script shows the bricks as Unconfirmed , and unconfirmed bricks shown in different color:
You can change the width of the bricks (width is 10 in following example):
Optionally candle colors are changde by the direction of the bricks:
If you have any recommendation then please drop a comment under the script ;)
Enjoy!

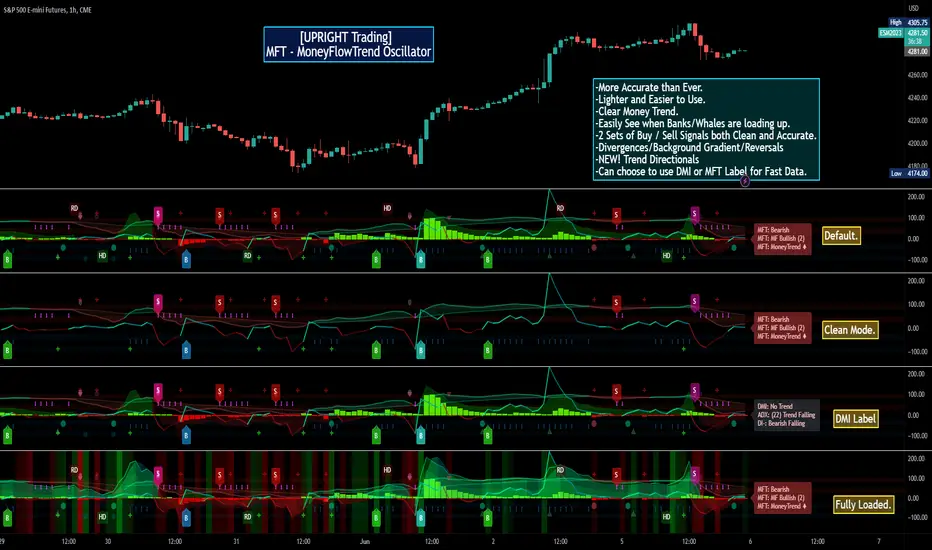
[UPRIGHT Trading] MoneyFlowTrend Oscillator(cc) PremiumHey Traders,
Tonight I'm updating my beloved original MoneyFlowTrend Oscillator with a Premium version.
A little background:
This is an indicator that I've been working to bring to life for years; learning pinescript code has allowed me to do just that.
Built on the idea of Supply & Demand Zones, this utilizes money flow and numerous calculations to create a picture of what is happening underneath the surface of the price action.
Richard Wykoff was one of the first market analysts to explain how the economic cycle can be applied to explain market price action; thus, technical analysis . He described two zones among the total of 4 phases; the two zones are Distribution and Accumulation zones, also known as Supply & Demand zones.
______________________________
Since most of you already know the economic cycle, I will try to be concise.
The basic ideas:
When supply > demand, the price goes up down.
When demand > supply, price goes up.
When demand = supply, the price stays about the same (going sideways).
Price action has --Uptrends, downtrends, and price ranges (consolidation).
Wykoff's 4 phases to explain this price action :
1) Accumulation (Demand zone)
2) Markup (Uptrend)
3) Distribution (Supply zone)
4) Markdown (Downtrend)
______________________________
With all that said, usually you will either see a sharp jump from a supply or demand zone or it will consolidate within it. Until a new one is formed on the chart.
This indicator attempts to put all of that into a lower indicator. I tried to separate the retailers and the banks and then put them back together to get a full picture.
Premium:
-Even MORE (quality & quantity) Accurate signals.
-Reversal Signal added (Circle- shown on chart)
-Cleaner Scaling and Organization.
The chart shown above should look like this:
Good luck traders.
Cheers,
Mike
(UPRIGHT Trading)
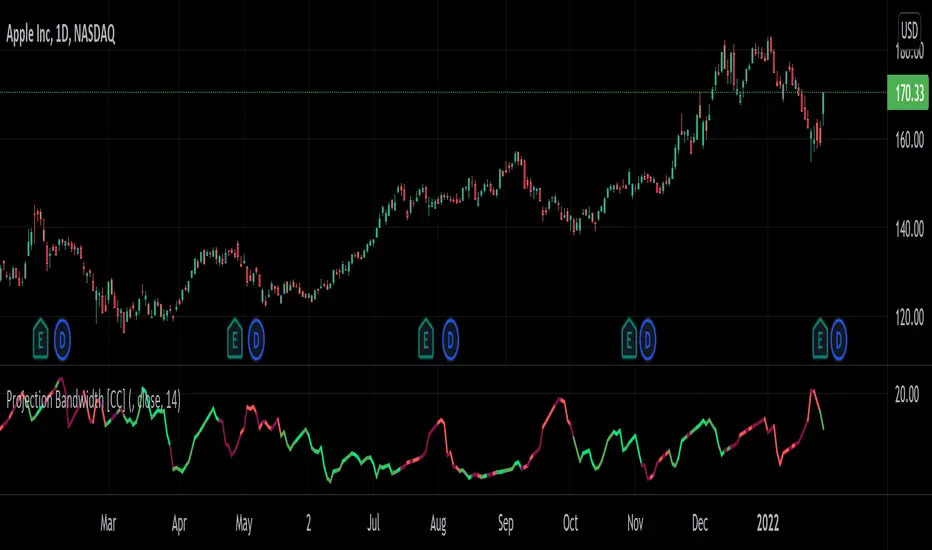
Projection Bandwidth [CC]The Projection Bandwidth was created by Mel Widner (Stocks and Commodities Jul 1995) and this is another of my series of indicators that I consider undiscovered gems. For those of you who are unaware, the Bandwidth indicator measures the distance between the high and low bands and if you remember from my Projection Bands script, the Projection Bands give pretty accurate early signals of trend reversals and followed fairly closely by a large bulge in the bands. The large bulges in the bands essentially act as the confirmation that the trend reversal is happening and so that brings me to this indicator. This indicator gives signals based on if it has reached a peak or a valley. Both extremes mean that the current trend is ending and I have color coded it based on the buy and sell signals from my Projection Bands indicator. I have included strong buy and sell signals in addition to normal ones so strong signals are darker in color and normal signals are lighter in color. Buy when the line turns green and sell when it turns red.
Let me know if there are any other scripts or indicators you would like to see me publish!
Trend Analysis Index [CC]The Trend Analysis Index was created by Adam White and not to be confused with the Trend Analysis Indicator that I also published. This indicator operates under the same idea but using a completely different calculation to achieve similar results. The idea behind this indicator is for a combination of volatility and trend confirmation. If the indicator is above it's signal line then the stock is very volatile and vice versa. If the stock is currently trending as in above a chosen moving average for example and the indicator falls below the signal line then there is a pretty good chance in a trend reversal. The recommended buy and sell system to use is to pair this indicator with a moving average crossover system which I have included in the script. Buy when the indicator is above it's signal and the shorter moving average crosses above the longer moving average. For selling you would do the same and sell when the indicator is above it's signal and the shorter moving average crosses below the longer moving average. I have included strong buy and sell signals in addition to the normal ones so stronger signals are darker in color and normal signals are lighter in color.
Let me know what other indicators or scripts you would like to see me publish!

[Rygel] Trend Reversal IndicatorThis indicator is a trend reversal detector. It provides a bullish or bearish signal derived from the analysis of 22 indicators.
It analyzes and aggregates the divergences and the overbought and oversold conditions to determine a signal strength going from -100 to 100.
You can choose the appearance of the signals, how sensitive you want the signals to be and the indicators you want to use.
You can also display divergences, and show signal, divergence, overbought and oversold strength as a background color.
This indicators also provides several alerts.
You can find more information about the divergence algorithm I'm using on this page .
Please note this indicator will not give you buy nor sell signals. A bullish signal will not always be followed by a bearish one and vice-versa. You may get the same type of signals for a long time ; expect to see far more bearish signals in a bullish market and far more bullish signals in a bearish market.
You should never make a buy or sell decision based solely on this indicator, even when the signal is very strong.
This indicator is made to help you to confirm your market analysis and to warn you of possible incoming trend reversals so you can anticipate them and adapt your trading strategy accordingly. It may also help you to optimize your DCA times of purchase.
Please note a signal becomes final only after the bar after it is closed, as a divergence pivot may still be invalidated by then. When the signal bar is closed, the signal is considered as confirmed but may still disappears if it is invalidated by the next bar. When the second bar is closed, the signal is made final and stays definitely on the chart.
This indicator currently supports the following indicators as sources:
AO (Awesome Oscillator)
BBP (Bear Bull Power)
CCI (Commodity Channel Index)
CMF (Chaikin Money Flow)
CO (Chaikin Oscillator)
EOM (Ease of Movement)
MACD (Moving Average Convergence Divergence)
MACD histogram
MFI (Money Flow Index)
MOM (Momentum)
OBV (On-Balance Volume)
OBV oscillator
RSI (Relative Strength Index)
RVGI (Relative Vigor Index)
RVI (Relative Volatility Index)
Stochastic
Stochastic RSI
TSI (True Strength Index)
UO (Ultimate Oscillator)
VWMACD (Volume-Weighted MACD)
VWMACD histogram
WT (Wave Trend)
You can disable any of them in the settings. You only need one indicator source enabled for the Trend Reversal Indicator to work.
If you disable some indicators, you may need to lower the sensitivity or even use a custom one as the signals strength will probably be higher as it will be easier to match most of the indicators.
As this indicator makes a lot of computation, it takes a few seconds to load. If it's an issue for you, you may improve its performance by disabling some indicator sources.
HOW IS THE SIGNAL CALCULATED
The algorithm analyzes the last three bars (the current one and the two previous bars) and for each enabled indicator source:
Add one point for a positive divergence ;
Add one point for an oversold condition (when the indicator supports it) ;
Add one point for a strongly oversold condition (cumulated with the oversold point) ;
Remove one point for a negative divergence ;
Remove one point for an overbought condition ;
Remove one point for a strongly overbought condition (cumulated with the overbought point).
It then normalizes the signal from -100 to 100, where -100 is the minimum theoretical score and 100 is the maximum theoretical one.
The algorithm detects up to 100 bars long divergences.
SETTINGS
SIGNAL SENSITIVITY
You can set the indicator sensitivity to one of five levels.
Very low (60):
Low (55):
Medium (50): (this is the default value)
High (45):
Very high (40):
You can also set a custom sensitivity by choosing "Custom" and filling the "Custom sensitivity" field.
SIGNAL APPARENCE
Show signal strength: replace the "Bear" and "Bull" label with the signal strength.
Show indicator names: add the indicator names to the label to know exactly what got detected.
OB is for "overbought", OS is for "oversold", OB+ is for "strongly overbought" and OS+ for "strongly oversold".
DIVERGENCES
Show divergences: add all the detected divergences to the graph. The more divergences are in the same zone, the brighter the colors are. Please note TradingView limits to 500 the number of lines you can display at anytime, so divergences will only be shown for the most recent bars.
BACKGROUNDS
You can show signal, divergence, overbought and oversold strength as a background color.
Show signal background:
Show divergence background:
The more divergences are detected in the same bar, the brighter the color is.
Please note the divergence background only shows confirmed divergences. It requires two bars for a divergence to be confirmed.
Show overbought and oversold background:
The more overbought and oversold conditions are detected in the same bar, the brighter the color is.
You can also combined all of the backgrounds for even more eye pain.
ALERTS
This indicator offers multiple alerts.
New trend reversal signal: a new trend reversal signal has been detected. Bar is not yet closed, signal may still be invalidated and disappear. It's the earliest alert you can get but you'll also get many false positives.
New bearish trend reversal signal: identical, but with bearish signals only.
New bullish trend reversal signal: identical, but with bullish signals only.
Confirmed trend reversal signal: a trend reversal signal has been confirmed. The signal bar is closed but the signal may still be invalidated by the current bar. You'll get far less false positives.
Confirmed bearish trend reversal signal: identical, but with bearish signals only.
Confirmed bullish trend reversal signal: identical, but with bullish signals only.
Final trend reversal signal: a trend reversal signal has been confirmed and is now final. The signal bar and the following one are closed. The signal can't change anymore but it will likely be too late to act on some signals, especially bearish ones. Crashes can be brutal whereas bullish trend reversals usually take more time to unfold.
Final bearish trend reversal signal: identical, but with bearish signals only.
Final bullish trend reversal signal: identical, but with bullish signals only.
I hope you'll enjoy this indicator and I hope it will be as useful to you as it is to me.
Feel free to comment if you experience a bug or if an important feature is missing for you.
If you like this indicator, please note it has been designed to be used it with my R.S.I. with divergences indicator and my M.A.C.D. with divergences indicator .

8X Trend ATR SAR Dingue V58X Trend ATR SAR Dingue V5 - This is the updated version for Pine Script 5.
8x indicator into 1 :
2x ATR indicator - 3x Trend indicator - 3x SAR indicator
Trends are helpful to spot reversal and support resistance, especially on bigger time frames.
This indicator gives you a global view of various trends all at once. You can easily turn them On or Off as to not clog the screen.
Each trend is also color-coded to visualize quickly the position of the price compared to it.
You can customize lengths, adjust line sizes, have the start of a new trend marked with a circle, fill in colors.
'Tool tips' explain other settings and if you have any questions, feel free to ask in the comments below.
Thank you for the feedback and check all my ‘Dingue’ indicators.

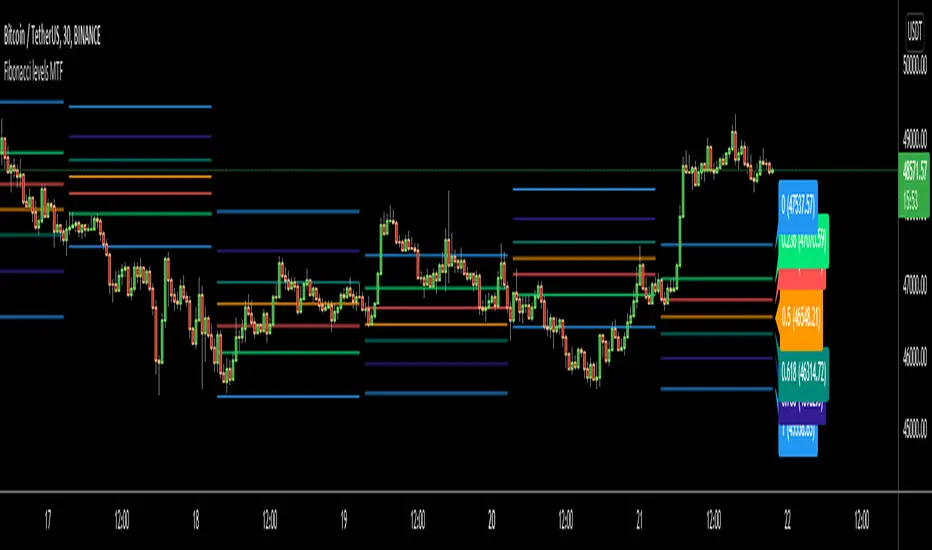
Fibonacci levels MTFHello All,
I got some requests for a script that shows Fibonacci Levels of Higher Time Frame Candles. so I made/published this script. I hope it would be useful for you.
Options:
You can set Higher Time Frame, by default it's 1 Day.
Optionally it can use Current or Last Candle of higher time frame to calculate/show its Fibonacci Levels.
It can show higher time frame candles at the background optionally. You can change its colors.
You can enable/disable/change each Fibonacci levels and their colors.
You can enable/disable Fibonacci Labels that is shown at the right ride and see only Fibonacci lines/levels
example, Fibonacci levels with higher time frame candles:
P.S. if you have ideas to improve this script, drop a comment under the script please
Enjoy!
High-Low IndexHello All,
High-Low Index is a breadth indicator based on Record High Percent (RHP). RHP is based on new 52-week highs and new 52-week lows. RHP => 100 * (new highs) / (new highs + new lows). High-Low Index is a 10-day Simple Moving Average of the RHP, which makes it a smoothed version of RHP. You can find many articles about High-Low Index on the net.
High-Low Index above 50 indicates that there are more new highs than new lows, and considered as Bullish.
High-Low Index below 50 indicates that there are more new lows than new highs, and considered as Bearish.
High-Low Index = 0 indicates there is no new highs (0% new highs).
High-Low Index = 100 indicates that there is at least 1 new high and no new lows.
and High-Low Index = 50 indicates that new highs and new lows is equal.
by default 40 cryptos are used in the script and shows High-Low Index for these cryptos. but you can change them as you wish. for example you can set all of them as stocks and see High-Low Index for these stocks.
You can set " Time frame " and the " Length " using the options. For example; if you set " Time frame " = 1 Week and the " Length " = 52 then it finds High-Low Index for 52weeks .
or another example; if you set " Time frame " = 1 Day and the " Length " = 22 the High-Low Indexn it finds High-Low Index for 22days.
You can enable/disable Record High Percent or Simple Moving Average of High-Low Index. Some traders use High-Low Index with its SMA, for example; High-Low Index generates a buy signal when it crosses above its moving average, and a sell signal when it crosses below its moving average.
Optionally you can see the securities in a table on the left bottom, you can change table size by usşng the options.
In the Table, for each security/cell;
=> if background is green then it has New High
=> if background is red then it has New Low
=> if background is gray then no New High, no New Low
=> if background is back then Data is not available for the security
As you can see in the screenshot below, the securities were changed and stocks are used instead of cryptos, so it calculates & shows High-Low Index for these stocks.
you can also find explanation in this screenshot:
Enjoy!

GreatBlueTradingTeam FibDev SignalsScript Purpose:
This script was designed to look for trend reversals and be used with other TA tools to help build confluence for day traders.
TA Used:
Without diverging too much information, this script relies on Highs, Lows, Opens, EMAs, Standard Deviations, Fib Numbers, and Fib Levels.
Script Overview:
First we look at the price action found on the Daily chart to create a set of zones using Fibs and Standard Deviations thats serves as our gauge on how far the price will move on any given day. Then, we create another set of zones ("intraday" zones if you will) that are built on much faster price action and relevant to the chart time period that is selected. These zones are also created using a combination of Fibs and Standard Deviations. From here, we compare the intraday price action with these two zones and look for areas where we feel overbought or oversold conditions are forming to create the bullish or bearish signals provided by the indicator.
Script Shortcomings:
Due to the fact this script is looking for breaks in trends, or trend reversals, it is subject to high risk especially in times of strong market trends where it could experience repeated failed signals. We recommend using this script in combination with other forms of TA for additional confluence as well as general market awareness that may influence trends and market behavior.
Script Access:
Please PM us to obtain information about accessing this script, or view our profile for contact information.
