Auto Trend Line (ATL) IndicatorAuto Trend Line (ATL) Indicator
Description:
The Auto Trend Line indicator is an useful tool designed to automatically identify and draw key support and resistance levels on your chart. These levels are calculated based on historical price action, providing traders with a visual guide to potential market turning points. The indicator is highly customizable, allowing users to adjust parameters for history bars, factor values, and range values, ensuring adaptability to various trading strategies and timeframes.
Key Features:
• Automatic Support and Resistance Detection: Uses advanced algorithms to identify significant price levels.
• Customizable Line Styles and Colors: Personalize the appearance of support and resistance lines for clarity.
• Dynamic Updates: Adjusts lines in real-time based on price action.
• Extended Visibility: Draws lines that extend into the future, offering potential zones of interest for upcoming price movements.
Inputs:
• History Bars Count: Controls the range of historical data used in calculations.
• Factor and Range Values: Fine-tune the sensitivity of trend line detection.
• Line Styles and Colors: Choose between solid, dotted, or dashed lines for support and resistance, with customizable colors.
Use Case:
This indicator is ideal for traders who rely on support and resistance levels for decision-making in various markets, including stocks, forex, and cryptocurrencies. By automating the detection of these critical levels, the Auto Trend Line indicator saves time and eliminates subjective bias, empowering traders to focus on their strategies.
Explore the Auto Trend Line indicator to enhance your trading insights!
Developed by iSTAGs
Trianglebreak
Triangle and Wedge Break [Only Long]The Triangle pattern
Triangle chart patterns are one of the most resourceful and practically advanced templates in technical analysis. These charts are the underpinnings of a well-calculated move when it comes to the assessment of risk and reward ratios. The pattern is often represented by drawing trendlines along an intersecting price scale, which suggests a stoppage in the ongoing trend.
The Wedge pattern
It is a price pattern that is denoted by the intersection of trend lines on a price chart. The opposing trend lines are drawn to connect the respective highs and lows of a price activity progression over the stretch of 10 to 50 periods. The lines can exhibit the magnitude of the highs and lows, signifying whether they are ascending or descending; this pattern gives the appearance of a wedge, hence the name. The wedge pattern has a good track record for forecasting price reversals.
This script is one of an attempt to help traders look for triangles and wedge patterns as soon as a breakout occurs.
How this script works:
1. First, it identifies the two tops of the pattern using the ta.pivot() function.
2. Next, it draws a trendline connecting those 2 tops, top A and top C (called the upper resistance line of the pattern).
3. Next, it draws a trendline connecting those 2 peaks (called the upper resistance line of the pattern).
4. Right now it will test 2 bottoms of the pattern (bottom B and bottom D).
5. Next, it will measure the ratio of waves AB, BC and CD (for example with triangle pattern, we need wave BC to retrace about 0.5 wave AB, same for wave CD and wave BC).
6. Finally, it will alert the trader if a break of a valid pattern occurs.
In addition, this script has more information about average trading volume, volume of candlestick breakouts. Those factors help us further confirm to enter the order.
This script is not all, you should combine other methods to increase your win rate.

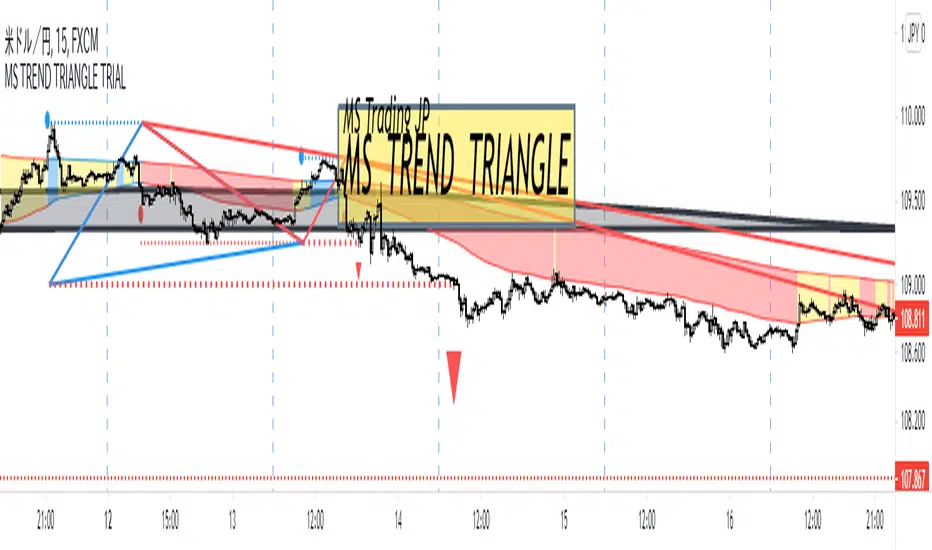
MS TREND TRIANGLE TRIAL(15M ONLY)- This is Beta Trial version for only 15m time frame.
- MS TREND TRIANGLE will help analizing trend condition and trade points.
- Detailed How to things will be coming later.
- Recent bottom(not top) prices going up (B > C)
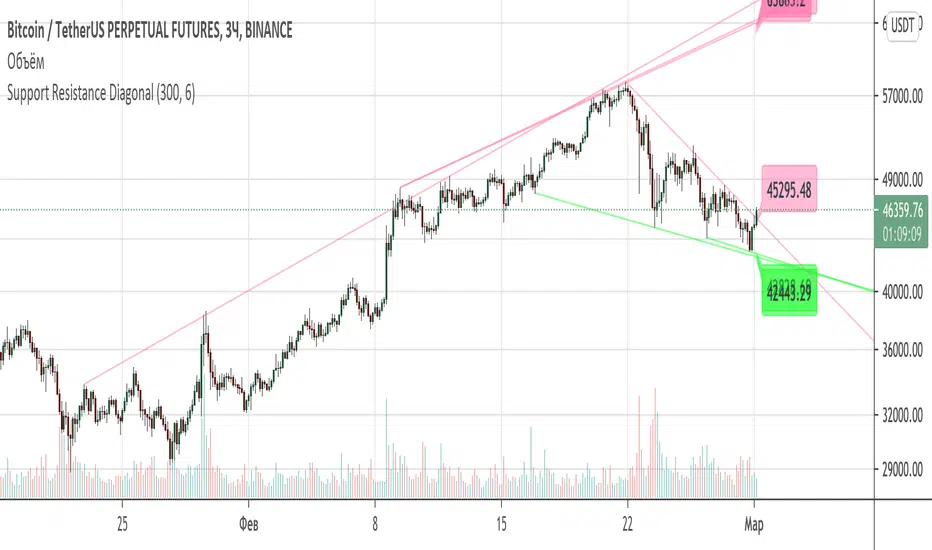
Support Resistance DiagonalClassic diagonal support and resistance based on pivot points. As a result, they form triangles, wedges, channels and other patterns. Realtime update up to 1 second chart.