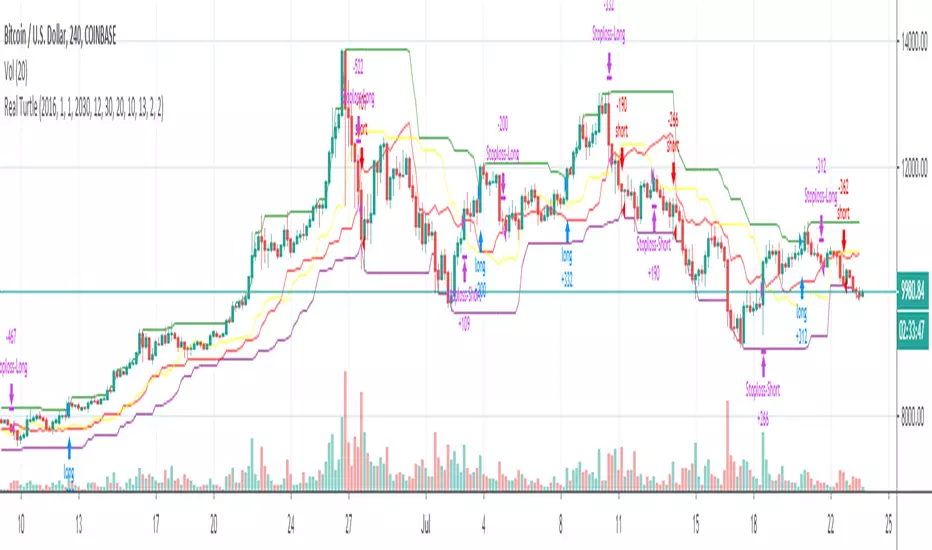
Real TurtleThere are a few different attempts at the turtle strategy on here, but none that I have seen thus far correctly follow the strategy as I know it. This version uses a stop order to trail out of the position by moving the stop order to match the exit channel or stoploss as the N*2( ema of True Range * 2). This version of turtle strategy also uses stop orders for entry on either side in order to enter at optimal time. The ability to specify a backtest period was borrowed from another script, I grabbed it so long ago I no longer remember from whom i borrowed it, if it was yours I will credit you if you PM me.
This version unlike others also allows you to specify a risk % so you only risk that percentage of your equity in a trade, as calculated from your stoploss.
Disclaimer: I have published several scripts in the past when i was first learning pinescript and they are all horrible please ignore those. I would delete them, but TV doesn't allow you to delete.
Turtle
TMA Strategy v2.2This is a backtest of the TMA Indicator v2.2 using default parameters.
Backtest window: Jan 1, 2015 - Jul 21, 2019 (today)
For more information on the indicator and strategy seen here please take a look at this backtest:
For paper trading only. Do not use on real markets. Never make investment decisions based on this indicator alone.

TMA Indicator v2.2This indicator is designed to show support and resistance at local extremes. Configurable SMA crossover events can be used to impart a bullish or bearish bias. This helps to reduce noise on the chart and increase profit factor. In other words, the indicator will only look for bullish breakouts if the fast moving average is above the slow moving average and vice-versa.
SMA Crossover events can be used to filter bullish or bearish resistance levels.
SMA Crossover events can be used to filter bullish or bearish breakout alerts.
Supports alerts for entries and exits based on breakouts of local extrema.
Alerts can be generated at every breakout or with SMA crossover filtering active.
Backtests would suggest that filtering with SMA crossovers often yields slightly lower profit but with a considerable improvement to profit factor.
Green/Red indicates long/short entry
Yellow/Orange indicates long/short exit
See here for an example backtest and visualization of active SMA signal filtering:
For paper trading only. Do not use on real markets. Never make investment decisions based on this indicator alone.

TMA Indicator v2.1This indicator is designed to show support and resistance at local extremes.
Indicator can be configured to filter out bullish vs bearish resistance levels based on configurable parameters.
Supports alerts for entries and exits based on breakouts of local extrema.
Green/Red indicates long/short entry
Yellow/Orange indicates long/short exit
Backtest window: Jan 1, 2015 - Jul 21, 2019 (today)
For paper trading only. Do not use on real markets. Never make investment decisions based on this indicator alone.

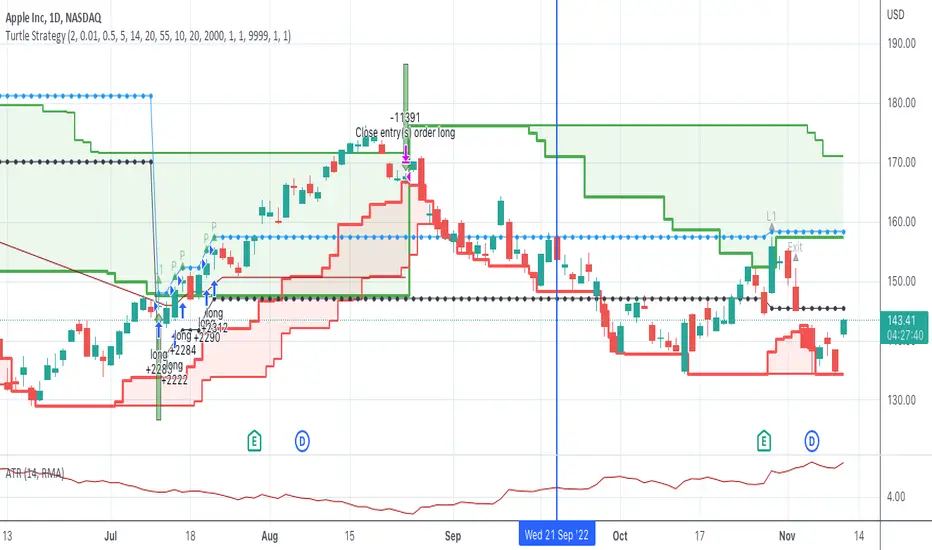
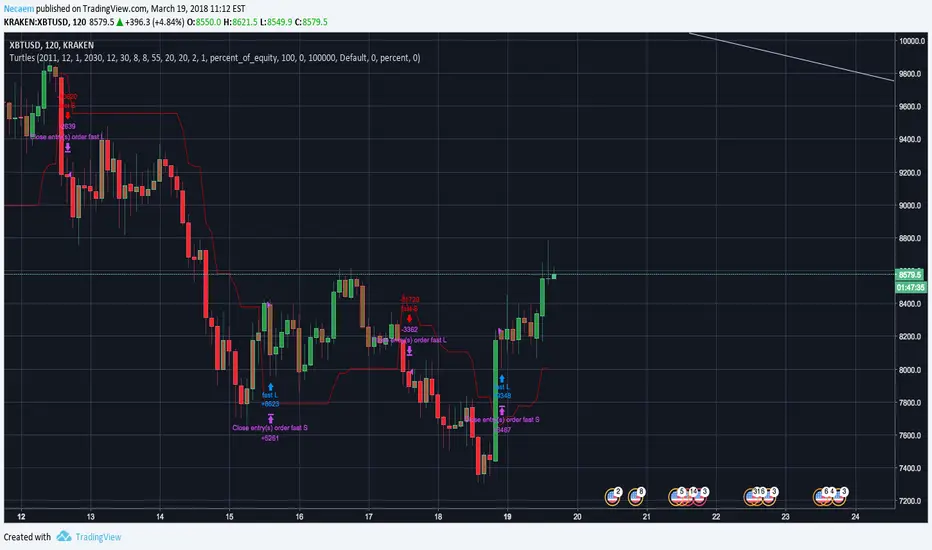
Turtle SystemFirst pinescript strategy I've ever written so still learning what is possible.
This strategy is based on the famous turtle system and tried to stay true
to the rules within the confines of what pinescript will allow me to do.
Features:
Green lines represents the 20/55 day highs (configurable)
Red lines represent the 10/20 day lows (configurable)
Purple line represents stop (defaults to 2N away configurable)
Pyramids up to 5 long positions (each 1N away configurable).
Arrows:
Up Arrow Green - 20 day long position entered
Up Arrow Purple - 55 day long position entered
Down Arrow Green - Winning trade exited out.
Down Arrow Red - Losing Trade either stopped out or exited out.
Code tracks successful wins as it is only allowed to enter positions if the last trade was not a wining trade.
One limitation, only supports Long trades although wouldn't be a lot of work to also make it support Short. NASDAQ:AAPL
Love to hear feedback on improvements, particularly to make it more robust.
Darvas Box/Turtle Way Breakouts v.2 by ZekisFor those who never heard about these two huge strategies:
* * * Darvas Box Strategy - www.netpicks.com
* * * Turtle Way Strategy - www.investopedia.com
In very short terms, both strategies are based on breakouts, probably the easiest way to trade (with proper education, obviously)
I created this indicator based on highs and lows, which will create support and resistance line, which will create a channel/box.
There is the possibility to :
- change channel/box size
- ride it till it will enter again into the channel/box
- set TPs and SL targets
- set alerts for Long, Short, Close when price enter into the channel, SL
- enable or disable 2 TP targets
- enable or disable 1 SL
- enable or disable middle line
Rules are simple:
1. Go Long when price breaks the upper line
2. Go Short when price breaks the lower line
3. Exit Long/Short when price enter into the channel/box
4. Stop Loss are added for safety
5. Added 2 layers for Take Profits
6. Added middle line that can act as Stop Loss
Legend:
1. White line - channel/box
2. Upper white line followed by green line - price cracked the channel/box - Go Long
3. Lower white line followed by red line - price cracked the channel/box - Go Short
4. Red zone - Stop Loss zone
5. Dotted red line - Stop Loss line
6. Dark green zone - first Take Profit zone
7. First dotted dark green line - first Take Profit target
8. First dotted dark green line followed by dotted lime line - price touched first Take Profit
9. Bright green zone - second Take Profit zone
10. Second dotted dark green line - second Take Profit target
11. Second dotted dark green line followed by dotted lime line - price touched second Take Profit
12. Dotted gray line - channel/box middle line
*** Don't use any indicator without knowing whatyou are doing, there is no such a magic lottery winning ticket
Trade safe!
Enjoy!
@Zekis

Turtle_Trading추세 추종 거래를 위한 지표입니다.
스캘핑 또는 단타와 같은 단기 거래보다 스윙 거래에 적합합니다.
생겨나는 점들을 지지선 또는 저항선으로 생각하시면 됩니다.
빨간점은 하락추세 파란점은 상승추세를 뜻합니다.
추세를 이용하는 지표답게 횡보장에 약합니다


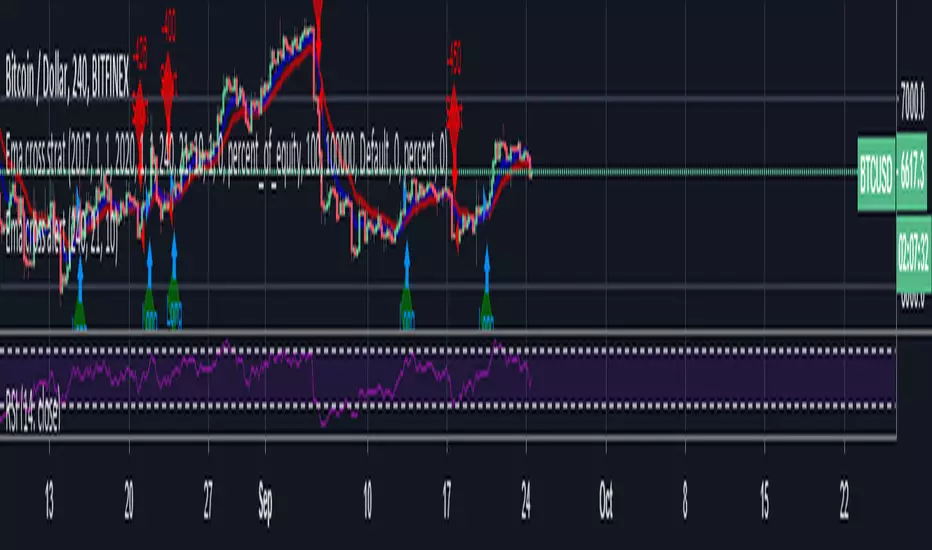
Ema cross strat / Turtle Trading This is just a simple EMA cross strategy which is meant to be similar to Turtle Trading Strategy.
It uses in default 4 Hour 21 / 10 EMA to long or short. This is not perfect but in the long run it will profit. Works best in bull market.
LINK TO ALERT :
Consecutive Highs/LowsTrack consecutive new highs/lows outside the Donchian range. Fans of the oldschool Turtle Strategy should enjoy the visualization.
Same logic as my "Walking the Bands" script, just with Donchian breaks instead of Bollinger tags.

Turtles + TrailingStopThis script is a merge between the Trailing stop from HPotter and the Turtle system from tmr0 and timchep

EMA Indicators with BUY sell SignalCombine 3 EMA indicators into 1. Buy and Sell signal is based on
- Buy signal based on 20 Days Highest High resistance
- Sell signal based on 10 Days Lowest Low support
Input :-
1 - Short EMA (20), Mid EMA (50) and Long EMA (200)
2 - Resistance (20) = 20 Days Highest High line
3 - Support (10) = 10 Days Lowest Low line

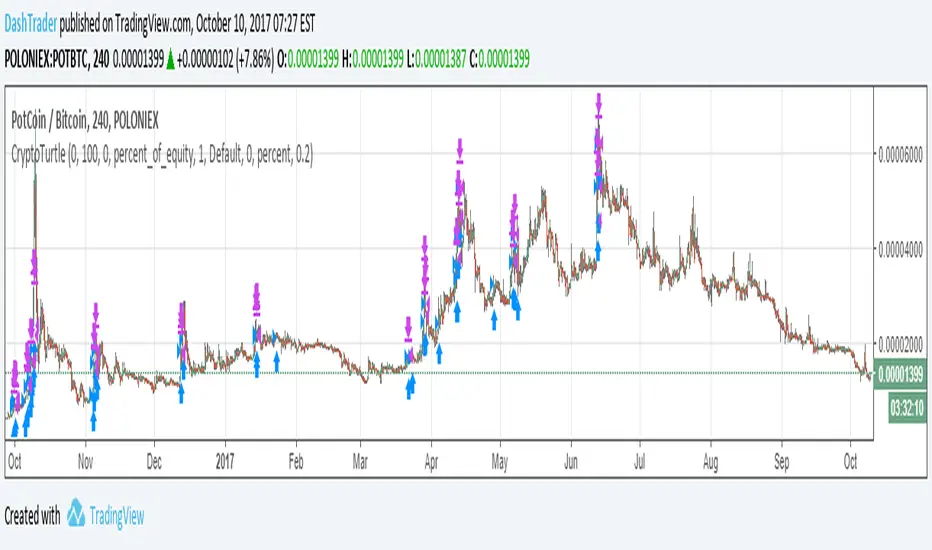
Crypto Turtle - Trend Following StrategyThis represents a bot I have written that uses a heavily modified version of the Turtle strategy for cryptocurrency trading. This is meant to be traded on the 4 Hour candlestick. This strategy doesn't 100% accurately reflect the bot due to limitations of pinescript. The actual bot enters on the signal much faster, detects bitcoin price rally and adjust its positions accordingly, follows all pairs traded on poloniex at once.
I am publishing this strategy here to gauge interest, and may list the bot on bitcointalk in the future for sale.
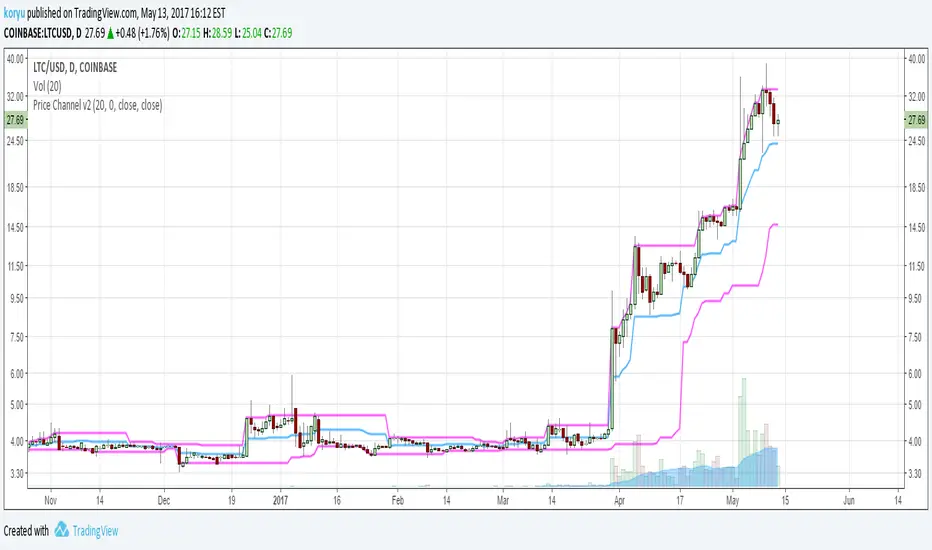
Price Channel v2Added parameters for source of highest and lowest line.
It's usefull for ultra volatile markets like cryptocurrencies and penny stocks. Using close price as source helps to filter out false breakout signals in turtle trading strategy.