@WACC Volatility Weighted PUT/CALL Positions [SPX]This indicator is based on Volatility and Market Sentiment. When volatility is high, and market sentiment is positive, the indicator is in a low or 'buy state'. When volatility is low and market sentiment is poor, the indicator is high.
The indicator uses the VIX as it's volatility input.
The indicator uses the spread between the Call Volume on SPX/SPY and the Put Volume.
This is pulled from CVSPX and PVSPX.
When volatility and put/call reaches a critical level, such as the levels present in a crisis or a sell off, the line will be green. See Sept 2015, 2008, and Feb 2018.
This level can be edited in the source code.
As the indicator is based on Put/Call, the indicator works best on larger time frames as the put/call ratio becomes a more discernible measure of sentiment over time.
VIX CBOE Volatility Index

IV/HV ratio 1.0 [dime]This script compares the implied volatility to the historic volatility as a ratio.
The plot indicates how high the current implied volatility for the next 30 days is relative to the actual volatility realized over the set period. This is most useful for options traders as it may show when the premiums paid on options are over valued relative to the historic risk.
The default is set to one year (252 bars) however any number of bars can be set for the lookback period for HV.
The default is set to VIX for the IV on SPX or SPY but other CBOE implied volatility indexes may be used. For /CL you have OVX/HV and for /GC you have GVX/HV.
Note that the CBOE data for these indexes may be delayed and updated EOD
and may not be suitable for intraday information. (Future versions of this script may be developed to provide a realtime intraday study. )
There is a list of many volatility indexes from CBOE listed at:
www.cboe.com
(Some may not yet be available on Tradingview)
RVX Russell 2000
VXN NASDAQ
VXO S&P 100
VXD DJIA
GVX Gold
OVX OIL
VIX3M 3-Month
VIX6M S&P 500 6-Month
VIX1Y 1-Year
VXEFA Cboe EFA ETF
VXEEM Cboe Emerging Markets ETF
VXFXI Cboe China ETF
VXEWZ Cboe Brazil ETF
VXSLV Cboe Silver ETF
VXGDX Cboe Gold Miners ETF
VXXLE Cboe Energy Sector ETF
EUVIX FX Euro
JYVIX FX Yen
BPVIX FX British Pound
EVZ Cboe EuroCurrency ETF Volatility Index
Amazon VXAZN
Apple VXAPL
Goldman Sachs VXGS
Google VXGOG
IBM VXIBM

Inverted Yield Curve with VIX Fear IndexUS 2 year and US 10 year comparison, inverted yield curve with VIX. I use this on a weekly chart with 2 moving averages, the 40 week (ma200 daily) and the 520 week (10 year median).
The bottom histogram is the VIX and the plot is the yield curve. When the VIX is above a certain level (you can set it in settings) and the ýield curve is close to or at inversion the background goes red.
The last seven recessions were preceded by an inverted yield curve. Here I combined the two main fear indexes, the VIX and the run for safe US treasuries (Inverted Yield Curve).
This is preset to the 2 year and 10 year US bond, weekly, and the normal VIX ticker but you can set it to whatever you like.
Published with source code for anyone to modify. Please comment below if you do so! This is the second in a series of indicators I intend to publish as a package of economic recoverty/recession symptom indicators.
Follow me for updates, next one up is commodities with dr Copper and oil!

SMI-VIX-SPY-NDX-Index
This script offers an SMI index of VIX, SPY, and NDX. Rather than overlaying VIX, NDX and SPY on the same chart.
It's much easier to see the correlation between VIX's price and NDX / SPY price in this manner.
Thanks to Buckkets & William Blau for the TSI smoothing method.

Williams_VIX_fix_inverseThe volatility index, Williams vix fix developed by Larry Williams, is a well-known index for finding market bottoms. It describes how much the current low price statistically deviates from the maximum within a given look-back period.
The inverse can be formulated by considering "how much the current high value statistically deviates from the minimum within a given look-back period." This transformation equates Vix_Fix_inverse. This indicator can be used for finding market tops, and therefore, is a good signal for a timing for taking a short position.
VIX INDICATORWorks best as an intraday indicator
Background black & line green = Long VIX
Background black & red line = No trade
Background orange & line green = Consider selling
Background orange & line red = Short VIX

ATR%A useful measure of recent volatility. I use 50 day or 50 week periods, but you can experiment with other values too. Because it measures ranges as a % of current close it can be used to make good comparisons with other historic periods of low (or high) volatility. This measure reached a new 23 year low for daily S&P 500 in July 2017.
Uses and historic examples: lunatictrader.com


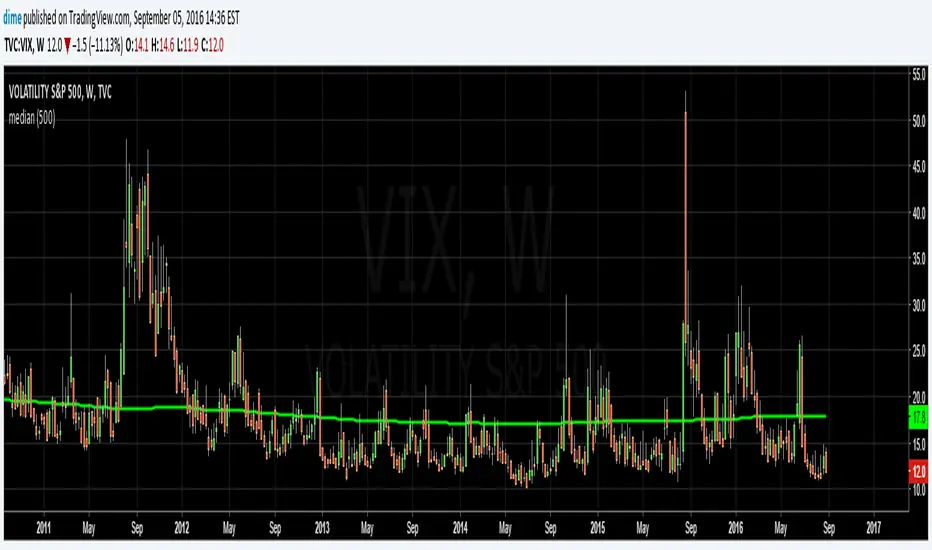
Bars Since VIX MedianBARS SINCE VIX17 Median by dime (v1.0 release) 04/02/2017
(Inspired by "Bars Since the last RSI Extreme" from DRodriguezFX)
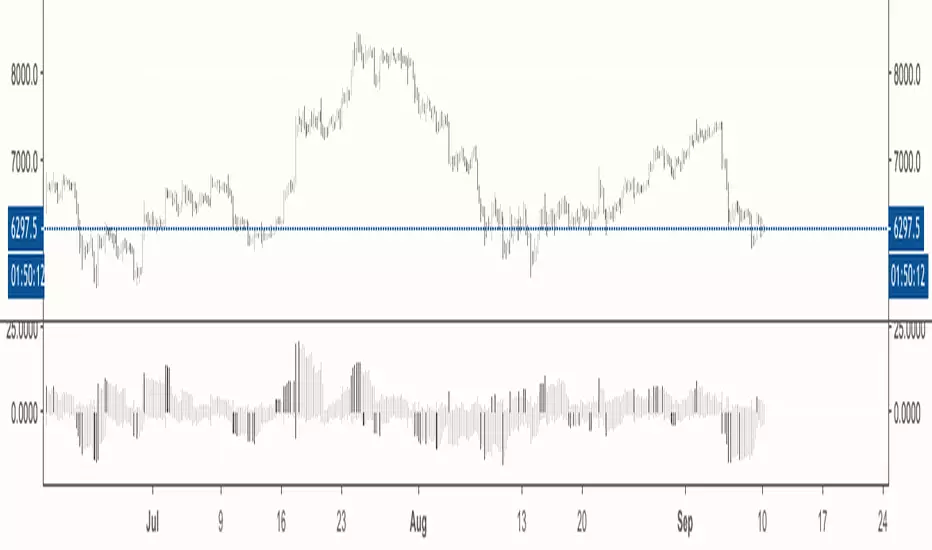
This indicator is useful in tracking how many daily bars since the VIX was last at a historically 'normal' range.
Currently the VIX has been in a period of low volatility for a period of 98 daily bars since the VIX was last at the 17 historical median.

VIX Term Roll OscillatorMy implementtion of VIX term roll Oscillator according to the articles below
seekingalpha.com
vixcontango.wordpress.com
Hope it helps!
Daniel
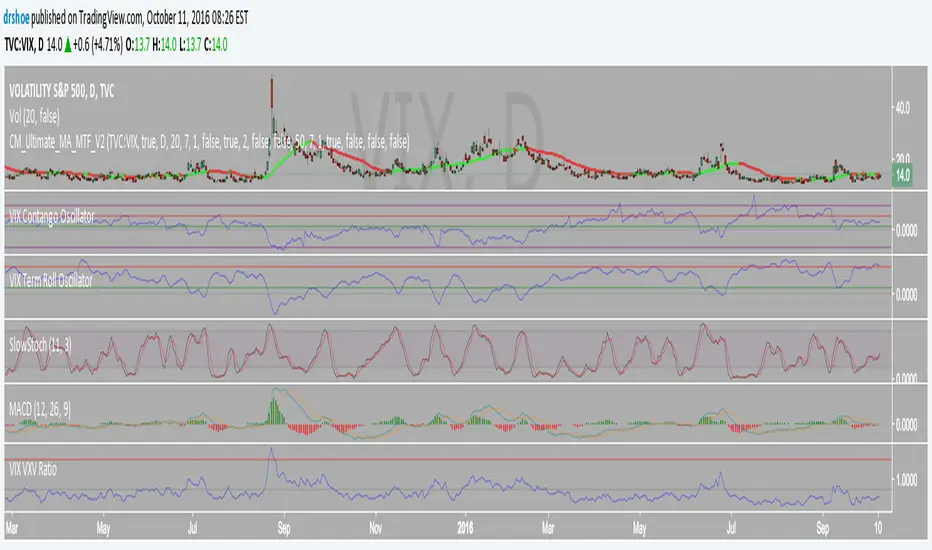
VIX Contango OscillatorVIX Contango Oscillator as outlined in the following blog post
vixcontango.wordpress.com
By Daniel Xu

Moving MedianThis simple script was a collaborative effort with 4X4good.
It plots a moving median for the period using the 50th percentile value.
We wanted to know the median value of VIX but surprisingly, a median indicator wasn't yet available in the indicators library.
So we did a little research & put this together.
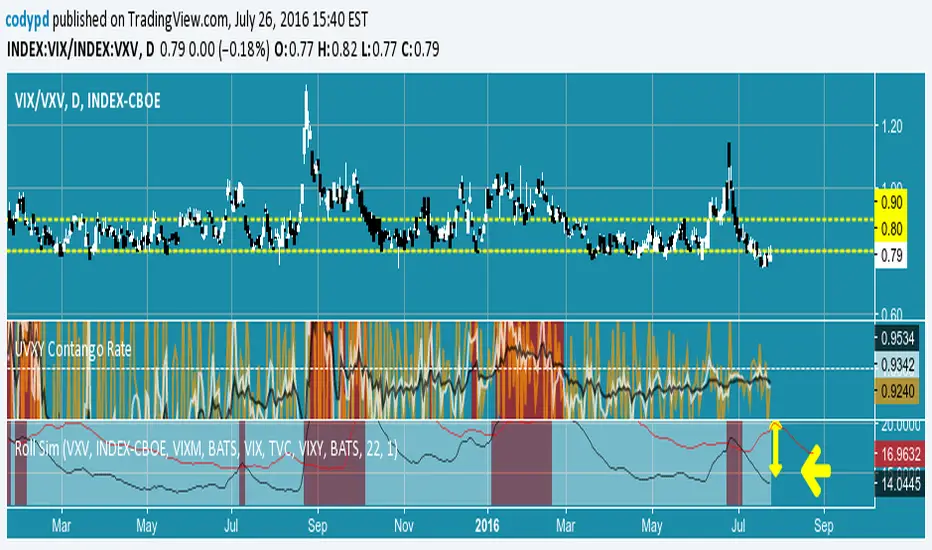
UVXY Contango Rate - my quick and dirty indicatorFeel the force ... read the source.
Give you an idea of the contango headwind / backwardation tailwind that UVXY is experiencing.
Works on Daily time frame only unless you buy the VIX feed.
SPYIX EMAVariation on idea at url below using SPYIX from BATS instead of VIX
from marketsci.wordpress.com
Aids in identifying changes in volatility direction.
EDIT: just noticed that URL is now password protected. The concept from the author is simple: use EMA and SMA smoothing of the VIX as two signal lines. When they cross you have a change in VIX direction. I simply coded that for SPYIX which is a slightly different (but theoretically similar) index vs VIX. SPYIX provides intraday updates without a subscription so this indicator can be used for intraday tracking.
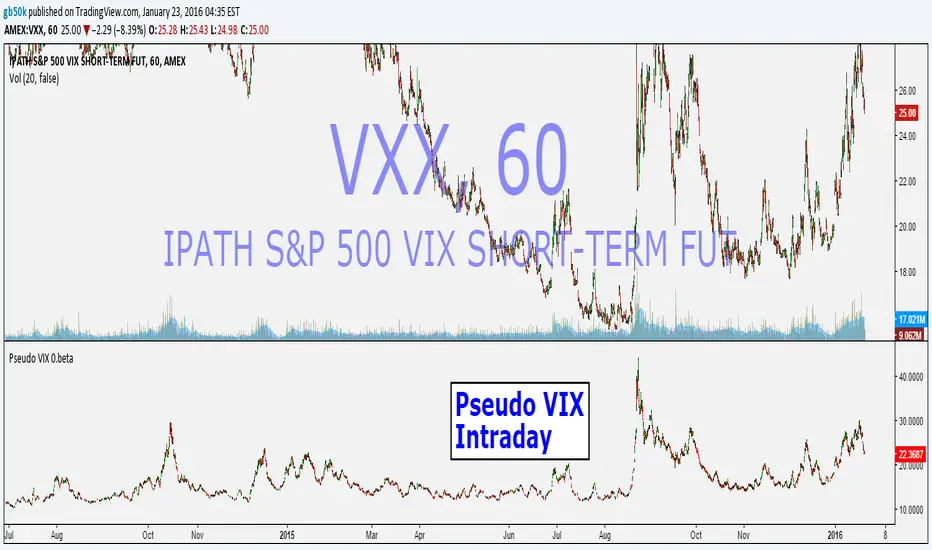
Pseudo VIX -Intraday -.betaFor Educational Purpose -
Intraday VIX estimation using yesterdays VIX, previous overnight roll , and intraday values for the VXX etf (scaled up to VIX)
Works in all intraday time frames.
First attempt...feedback welcome.
Humble Student OB/OS Trifecta indicatorAfter reading Cam Hui's blog post about his "Trifecta" bottom spotting model I thought I'd try my hand at scripting it as an indicator. The results are pretty close to what he describes. Though the data TradingView feeds me doesn't seem to be identical to what he's using on StockCharts.com the results are close enough that I will call the effort a success worth publishing.

VIX EMA/SMA divergence Here is a simple indicator that implements the idea in an article titled "The VIX is Very Predictable"
Read the indicator's script comments for the article location.
Published in tandem with this post
If you improve it please let me know.

CM_Williams_Vix_Fix_V3_Upper_Text PlotsWilliams Vix Fix Text Plots! Alert Capable!
Use With Lower Indicator or as Single Indicator!
Has Text Plots For All Plot Types Lower Indicator Uses.
To Get Lower Indicator:
Info On Lower Indicator - Discussion:

VIX Fear Gauge (Inverse)Chris Moody did this VIX FIX and helped me inverse it so I could read it easier.. I love it and it works great

VIX - Fast 30% gains in volatility - shorting Script is showing if volatility has risen 30% or more from the 10-day MA. Great opportunity for shorting when indicator gets close or above green 30% line. Red line is current MA average.
