Pro Divergence [regular + hidden] by TradingClue█ Pro Divergence is my new divergence-based toolkit that will help you to spot lucrative opportunities in all kinds of markets.
I've developed toolkits and strategies that use divergences for many years, e.g. AutoDivergence and CCIDivergence . Pro Divergence is my latest development and benefits from those yearlong experiences.
The main algorithm to detect divergences has changed from using linear regressions and moving averages to algorithmic trendline detection like I've been using in TD Lines .
This new approach supports the detection of regular divergences but also hidden divergences can be identified.
Before going more into the details of the mechanics of Pro Divergence, let's recap, what divergences are all about when it comes to trading.
█ Regular Divergence
The basic idea is pretty simple: If price goes in the opposite direction than some other technical indicator - in most cases an oscillator - we speak of a divergence. A regular divergence might be a signal for a trend reversal. That's it.
For example, if the price is currently rising, while at the same time Momentum is falling - it might be time for a reversal and the price of an asset is about to fall soon. If there are additional indications to confirm the signal, e.g. if RSI is in the overbought area, it might be a good idea to go short on that specific asset.
Regular bullish divergences are indicated when price is forming lower lows while an oscillator shows higher lows.
Regular bearish divergences are indicated when price is forming higher highs while an oscillator shows lower highs.
█ Hidden Divergence
While regular divergences indicate trend reversals, hidden divergences indicate a trend continuation.
When the price is making higher lows and the oscillator is showing lower lows, we speak of a bullish hidden divergence. When the price is making lower highs and the oscillator shows higher highs, it's a bearish hidden divergence.
These rules for identifying divergences are pretty simple and straightforward. And they are also confusing at times. But that's what Pro Divergence is helping you with: trade based on customizable signals to identify all kinds of divergences.
You could either use the strategy settings of the toolkit to optimize the properties to show winning backtesting results. Or you use the signals as an extra confirmation to some other kind of signal/ strategy you are working with.
█ Summary of all current features
• Oscillator: choose between CCI, Momentum, MACD, or RSI. All oscillators-settings are customizable.
• RSI-filter: in some cases, the quality of the signals can be improved by an RSI filter, e.g. a bullish signal would only be valid if RSI is in the oversold area. Set the RSI period and the oversold/ overbought levels to your preferred values.
• You can display all divergences on the chart to get an idea of the current price action. Or you can pick any combination of signals you would like to include in a backtest. Possible signals are: regular bullish divergence, regular bearish divergence, hidden bullish divergence, hidden bearish divergence
• Exits: there are many ways to get exit signals - combinations of the below options are possible:
• fixed profit targets/ stop losses based on ticks
• Exit when momentum reverses
• Exit when price touches the opposite Bollinger Band (e.g. a long position will be closed when price touches the upper Bollinger Band). The settings for the Bollinger Bands are customizable.
• Entry: you can choose only to enter a trade if momentum is going in the same direction as the direction of your trade (e.g. only go long if momentum is rising)
• time and date filer
• Do a backtest only in a given time range (maybe you're not interested in the whole range of historical data when trading in a higher timeframe. Or you would like to do some kind of walk forward analysis)
• Only trade during special times of a day, e.g. only trade during the first hours of a trading session
Since this strategy is making heavy use of math and technical indicators, it is not tied to a certain asset class or timeframe. It was tested successfully on a large number of financial instruments like stocks, crypto, forex, and others.
Ketidakstabilan

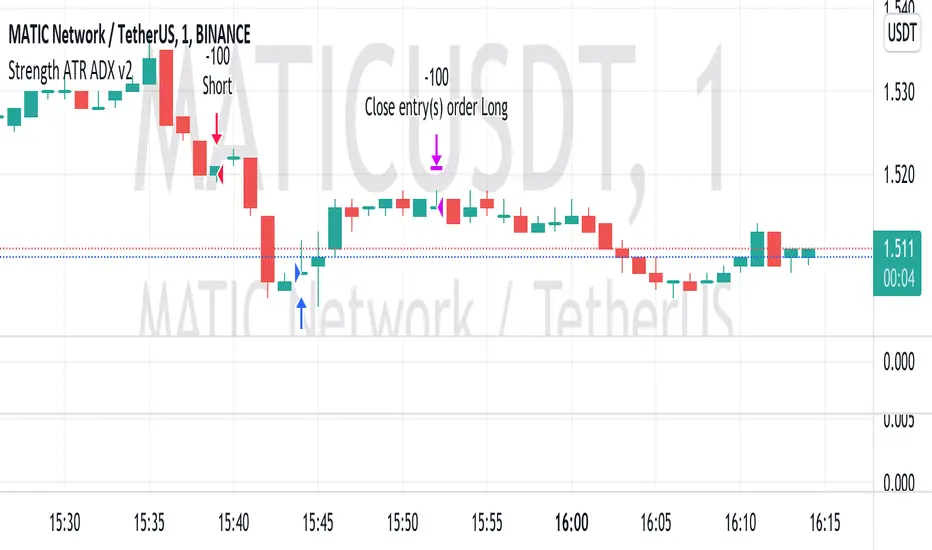
Strength ATR ADX v2This strategy looks for strong price movements with a high chance of a reversal on the difference in the rates of 6 currency pairs. A combination of ADX DI- and ATR is used for confirmation.
Added the ability to close trades by TP and SL to the strategy. (off by default)
Built-in martingale and reverse martingale (off by default)
The lot size is set in the strategy settings themselves!!!
The best results were obtained on XAUUSD 5M and on 1M cryptocurrency pairs.
boonam17_ALERT이용 관련 문의는 이메일 boonam17@naver.com 통해 해주시기 바랍니다.
백테스트 결과와 실제 투자 결과는 개인 블로그를 통해 업데이트할 계획입니다.

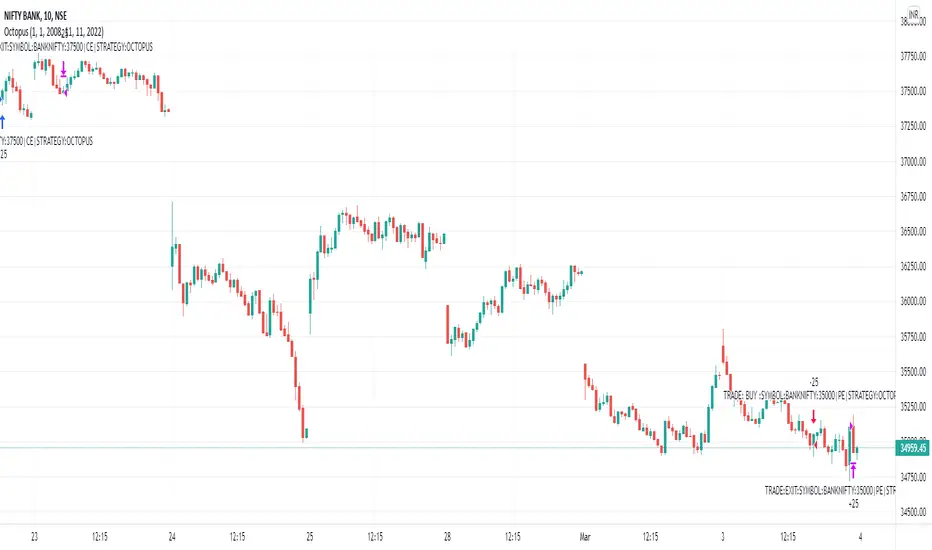
Octopus_AlgoGram_IndicatorHello traders!
I have been developing Octopus trading indicator over the last year. This algorithm indicator is based on a set of different strategies, each with its own weight (weighted strategy). The set of strategies that I currently use are 5:
Volume
ADX
MA crossover
Macd
Chaikin Oscillator
Moreover, this indicator includes STOP losses criteria and a taking profit strategy. this indicator must be optimized for the desired asset to achieves its full potential.
Best Time-Frame :
The 10 & 23 Minutes Time frame give good results. The algo has been tested for several asset (same dataframe, different optimization values).
When to Buy & Sell :
Buy Entry & Exit : Take entry when Green Arrow or Buy Trigger on screen & Exit when Purple Arrow or exit trigger on screen
Sell Exit & Exit : Take entry when Red Arrow or Sell Trigger on screen & Exit when Purple Arrow or exit trigger on screen
Important note:
Backtest the algorithm with different data stamps to avoid overfitting results
How it works:
The algorithm is based on a combination of well-documented indicators. First, the algorithm calculated the weight_strategy, which represents a value from 0 to 5 of the number of strategies that are fulfilled (in case the weight of each strategy is the same). To open a position, the value of weight_strategy must be greater than the value of weight_signal, by default 2. Modify the indicator parameters for the desired asset and data frame. Set stop-loss and take profit criteria.
Features:
* The algorithm allows to trade with long, short or both positions.
* Backtest the algorithm over a defined interval (data stamp), e.g., from 2022
* stop loss (SL) orders based on movement of the previous candle source, e.g., close or candle volatility . Only close the position after the candle is close!
* It can moves the stop loss when this indicator takes profit (TP)
* Take profit based on market movement and once all condition true they push exit order
* Define delays to evaluate the strategies of more previous candles:
+ Candle delay Exit is the number of candles the algorithm waits to open a new position.
* Choose if you want to use the weighted strategy or just some of them.
* Choose the weight (relevance) of each strategy.
* Customize the well documented MA cross strategy.
Disclaimer :
AlgoGram Script,Indicator,Strategy,Trading Idea & presentations are only for educational & Research purposes and are not intended as investment advice. I cannot guarantee the accuracy of any information provided above , please take trade with help of your Financial adviser or on your own risk
Cheers! & Best Of Luck
By AlgoGram
Inside Breakout PerQuantumCoin Premium Indicator (strategy)HOW IT WORKS:
- The Inside Breakout gives signals on the chart on the breakout of inside bar chart pattern;
- It allows to trade trend or counter-trend signals;
- Computes intrinsic values to access the strength of the Buy/Sell signal;
- Allows users to adjust their own settings, adapting the signals produced;
- These signals can be also set up as Alerts;
- The indicator has a few custom features that allows users to filter out signals using multi-timeframe trend indicator and to keep tracking positions so that one can only get new signals when they reserve position;
This Strategy version is meant to be a companion to the main indicator in order to backtest your SLT/TP settings with different instruments and adapt results.
Please NOTE:
Results may vary depending on TP/SL settings. Also, previous performance is not a indicator for future results.

Bias Master SystemName: Bias Master System
Category: Bias (Template/Master).
Operating mode: enters and exits at specific times of the day
Trades duration: a few hours, usually intra-day.
Timeframe: 1H.
Suggested usage: in markets where hourly biases are present.
Entry: enters long and short in predefined times, with possibility to manage trend or volatility filters.
Exit: exits in predefined times.
Usage: It can be used in a variety of ways:
- Together with the Bias Analyzer to quickly check the Bias found by the tool. This allows you to create profitable strategies in less than an hour, as an example the starting point with the Analyzer
- The strategy itself can be used to study the market for interesting biases.
- The strategy can be used as a starting code for the development of one's own strategies.
A tutorial with working examples on BTC and ETH is also available and will be provided with the access.
Configuration:
- Long Trades: possibility to specify two long trades configuration and filter them by day of the week, trend or volatility.
- Short Trades: possibility to specify two short trades configuration and filter then by day of the week, trend or volatility.
- Backtest dates: for splitting the available data in develop, test and validation.
- Results table: possibility to specify decimal precision and Dark Mode
Credits:
- QuantNomad for Results Table
Backtesting:
⁃ Exchange: BINANCE
⁃ Pair: ETHUSDTPERP
⁃ Timeframe: 1H
⁃ Fee 0.025%

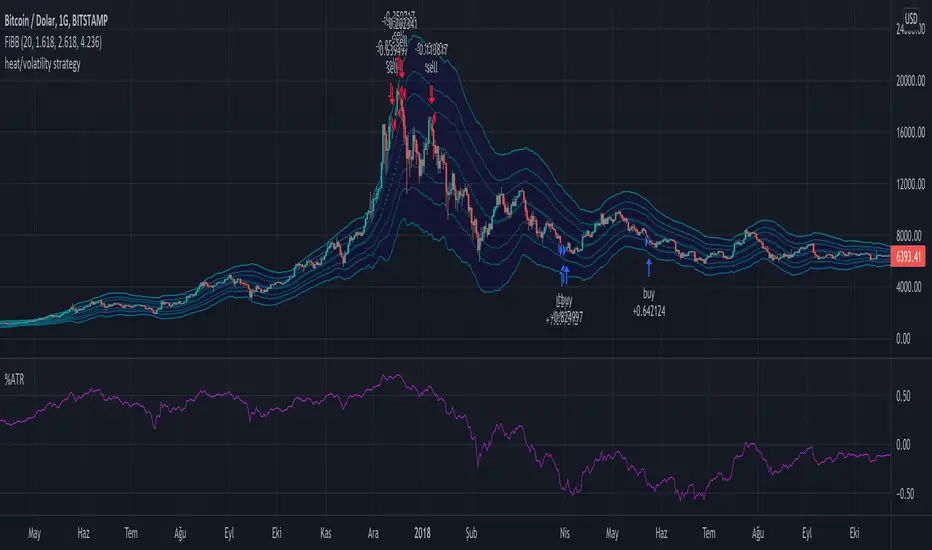
Long Term Heat/Volatility - Accumulation/Distribution v1This is a strategy specifically made for 1D BTC/USD with the aim of capturing cycle tops and bottoms. It's mainly based on two indicators: 21d average of ATR (volatility) and (BTC.price - 180d sma)/BTC.price (heat). The strategy only signals buys or sells after occurrences of high volatility, followed by extremely high or low heat values. It's optimized for utilizing accumulation and distribution at lower and higher prices respectively with respect to last 14 days. 2nd version will include dynamic dollar cost averaging during the accumulation and distribution periods.
Volatility Breakout StrategyThis is a strategy used by Larry R. Williams called Volatility Breakout.
By identifying a strong uptrend that exceeds 'a certain level' on a daily basis as a breakout signal, enter long position, take advantage of long at the the next day's open.
'a certain level (Entry Price)' is calculated by { close + 'k' * high -low }, and applied logarithmic calculation.
Stop loss level is calculated by half of the previous day's Low and Entry Price.
Strategy exit always at UTC+0.
And expressed day session with the background color.
Thanks and hope this helps you.
(kor)
이건 Larry R. Williams가 사용하는 변동성 돌파 전략입니다.
특정 수준을 넘는 강한 상승세를 돌파 신호로 파악하여 매수하고, 장시간이 종료될때에 빠르게 수익을 실현하는 전략입니다.
"특정 레벨(진입가)"은 close + 'k' * high -low 로 계산되며 로그 계산을 적용했습니다.
손절 레벨은 전일 저가 및 진입 가격의 절반으로 계산됩니다.
전략은 항상 UTC+0에서 종료합니다. ( 한국 기준 오전 9시 )
그리고 배경색으로 일일세션을 표현했습니다.
트뷰에 오픈소스의 래리윌리엄스 변동성전략이 없는것 같아 간단하게나마 만들어 보았습니다. 도움이 되었으면 좋겟워요..

ReversionStrategyThis strategy aims to identify condition of exhaustion to trade market reversal. It uses multiple indicators to enter a position. It uses following indicator:
1. RSI
2. ATR
Functionality of the Multi-Indicator:
1. RSI:
If RSI value is more then 70(input parameter) then market is over-brought. When less than 30 (input parameter) then market is over sold. Over brought or over sold market are good to play reversal.
2. ATR:
If current bar atr is more than 20 period (input) atr then it indicates over extended move.
3. Candle structure:
If a big candle closes near (within 10%) to its high then it indicates exhaustion. Same when big candle closes near to lows.
The combination of above 3 identifies buy or sell condition. Stop loss is 1.5 times atr. These parameter are input.
Sell condition:
1. RSI is more than 70
2. Current bar ATR is more than 20 perios ATR
3. Candle closes within 10% of its high.
If above 3 conditions are met on a candle then it indicates exhaustion of up move and sell order should be opened on next candle.
Buy condition:
1. RSI is less than 30
2. Current bar ATR is more than 20 perios ATR
3. Candle closes within 10% of its lows.
If above 3 conditions are met on a candle then it indicates exhaustion of down move and buy order should be opened on next candle.

Btcusdt - 4hr Trendreversal algoritmeIn this strategy we use a combination of differents indicators to catch the highs and lows and follow the right direction at all times.
The conditions of this 4hr algo are based on Ema's and WMA's that rise or fall:
Momentum;
Price Action
Volume
RSI
BB
I have backtested the algo for 2 years before i ran it live. I ran the algo live for 1 year now and ( October 2020) as for now the algo indicates a trend reversal 70-80% correctly.
The backtest result shown started from 01-10-2017and is simulated using 15% of the capital on BINANCE:BTCUSDT
I have varies Algo's on different Timeframes. If you're interested sent me a message.
Please be aware that past results are no guarantee for future performance!

Chandelier Exit - StrategyI created a strategy version for the Chandelier Exit indicator, originally owned by @everget . With the strategy I prepared, you can try both short-long and stop loss - trailing stop and take profit rates. I have also added a date filter feature so that you can test the strategy in the date range you want.
Orjinali @everget 'e ait olan Chandelier Exit indicator için strateji versiyonu oluşturdum. Hazırladığım strateji ile hem short-long deneyebilir hem de zarar durdur - takip eden stop ve kar al oranları denemeleri yapabilirsiniz. İstediğiniz tarih aralığında strateji testi yapabilmeniz için tarih filtre özelliği de ekledim.

CryptoGraph Multi Algo StrategyThis is a summary of how this strategy works.
CryptoGraph Multi Algo Strategy is the second profitable real-time trading strategy by the CryptoGraph team, that generates trade signal with exact entires, exits and risk management. The strategy is intended to work nearly every crypto coin pair, stock or index.
Principles behind the strategy
Entry:
Detection of trend direction with the use of an EMA . Default setting is a length of 550.
Detection of shorter term trend direction with the use of multiple Supertrend Indicators.
Detection of an even shorter term direction with the use of a crossover of the Stochastic RSI , below or above certain levels. This would be the final condition for an entry signal.
Exit:
Once an entry signal has fired, the script will look at the current ATR Value. In the script settings there will be an option to adjust the ATR factor. While ATR factor is equal to 1, it means it will use the default ATR value distance from the candle close. When ATR factor is for example 2, it will use two times the ATR distance from the candle close.
This is a simple representation of how this strategy works, in reality there are more underlying factors.
To find the best settings for the crypto coin pair or stock you want the strategy to trade with, simply switch up the EMA , ATR Profit Multiplier and ATR Stop Multiplier and experiment which settings would fit your style best.
What to look for when testing coins or stocks?
EMA, default exponential moving average is set to 550. When above the line, it will only look for longs, when below it will only look for shorts.
The Take Profit and Stop Loss are based on ATR multiplications, adjust these in the inputs interface and you will see the exits change.
Default parameters of the strategy
This is only an example of a profitable combination of all parameters. This would be the 30 minute timeframe Bybit chart on Bitcoin.
ATR take profit at x2, ATR stop loss at x4.1.
In this example we are using an initial capital of $1.000,- while each trade 100% of this capital is used and compounds over time. Meaning every profit or loss will be added to the next trade. Also there is a 0.05% commission used based on Bybit, since we expect most trades to market in and limit out.

Kitti-Playbook HHV LLV Simulation R0 Feb 4 2022
Objective : Visualization the result of price movement cross Higher High - Lower Low to generate Long Short Signal
Study The change of Equity curve when Changes
1) Look back for Higher High - Lower Low
2) Number of Position size
3) Type of Suorce
4) Effected when use EMA 12-26 filter
5) Effected form equity adjustment
6) Effected form margin adjustment
Conditions :
Long Conditions
If EMA 12-26 filter off
1)Source cross over Higher High value of price look back ' x ' bars
2) Addition 1 position when Source cross over Higher High value of price look back ' x ' bars again
3) Maximum Number of Long position not more than set up from input
If EMA 12-26 filter on
1)Source cross over Higher High value of price look back ' x ' bars and EMA 12 > EMA26
2) Addition 1 position when Source cross over Higher High value of price look back ' x ' bars again and EMA 12 > EMA 26
3) Maximum Number of Long position not more than set up from input
Exit long Condition
Exit all positions when Source cross under Lower Low value of price look back ' x ' bars
Short Conditions
If EMA 12-26 filter off
1)Source cross under Lower Low value of price look back ' x ' bars
2) Addition 1 position when Source cross under Lower Lower value of price look back ' x ' bars again
3) Maximum Number of Long position not more than set up from input
If EMA 12-26 filter on
1)Source cross under Lower Lower value of price look back ' x ' bars and EMA 12 < EMA26
2) Addition 1 position when Source cross under lower Low value of price look back ' x ' bars again and EMA 12 < EMA 26
3) Maximum Number of Short position not more than set up from input
Exit Short Condition
Exit all positions when Source cross Over Higher High value of price look back ' x ' bars
Program flow :
1) Initial Strategy Setting
2) Initial Input Setting
3) Data Processing
4) STRATEGY Entry And Exit
5) Information of System selection
6) Dashboard for result

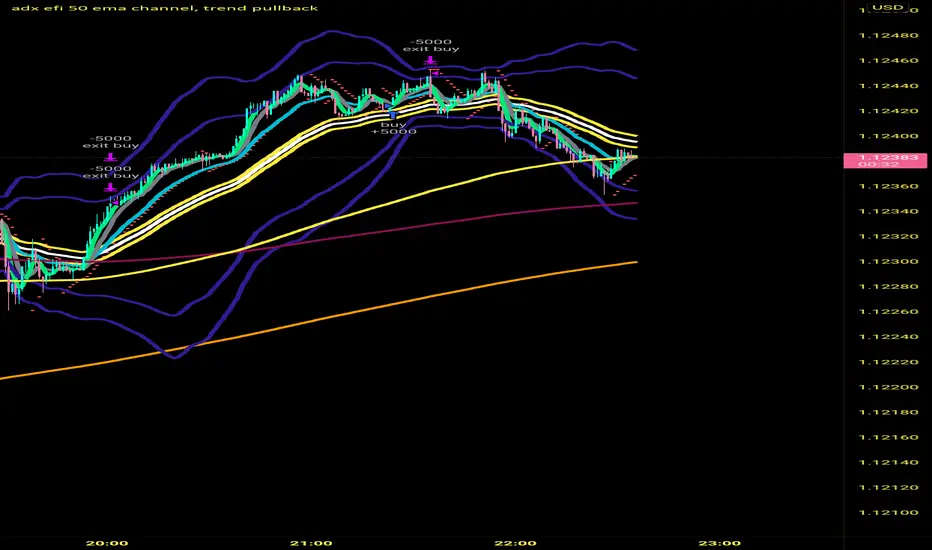
adx efi 50 ema channel, trend pullbackHi so this strategy is based off 50 ema channel and the 15 ma crossing it to generate signals. But with my adjusted strategy it's a 10 rma crossing 50 ema channels and a 5 and 9 wma to help see pullbacks. 50 period bollinger bands to gage volatility a0nd help during range markets. The strategy signals are generated when longer period efi is above 0 and shorter period efi is below zero and price has pulled back near 50 ema to buy long. And the reverse for shorts, I made this to help me trade more mechanically and to trade 1 minute time frame, that's where the strategy seems to Excell the most, I developed it on eur usd but a brief check seems like it still is profitable on gbp usd aud usd usd jpy I only trade the forex market so not sure about stocks and crypto. If you get signals I would place buy stops and sell stops above high and low of respective signal candle and let price take you into trade. Also adx 20 has to be greater than 20 to take trades. Let me know if this is helpful. I've only been coding for a month so it might look sloppy the way it's coded also there are a few other buy and sell conditions left in the source code if you want to switch between different buy and sell triggers, they all produce good results on 1 min timeframe
Hourly Bias on BTC in Bullish USA Session “Green Eagle”Name: Hourly Bias on BTC in Bullish USA Session
Category: Hourly Bias
Operating mode: Spot, only long
Trades duration: Intraday, 11 bars
Timeframe: 1H
Suggested usage: When the market is compressed, USA session has a bullish bias.
Entry: enter Long at 15:00 on specific days of the week. There is a volatility filter based on ATR which identifies compression.
Exit: exit at a pre-defined time at 01:00
Usage:
⁃ It can be useful to use alerts or webhooks to automate this strategy.
⁃ This is a core system that can be improved in different ways (e.g. Stop-loss, take-profit, position sizing) or studying more the behaviour in the specific days of the week or short when is red.
Configuration:
- N/A
Backtesting
⁃ Exchange: BINANCE
⁃ Pair: BTCUSDT
⁃ Timeframe: 1H
⁃ Fee 0.075%
⁃ Slippage 2
- Start : 2019-01-06
We decided to release this free BTC strategy.
How you or we can improve? Source code is open so share your ideas!

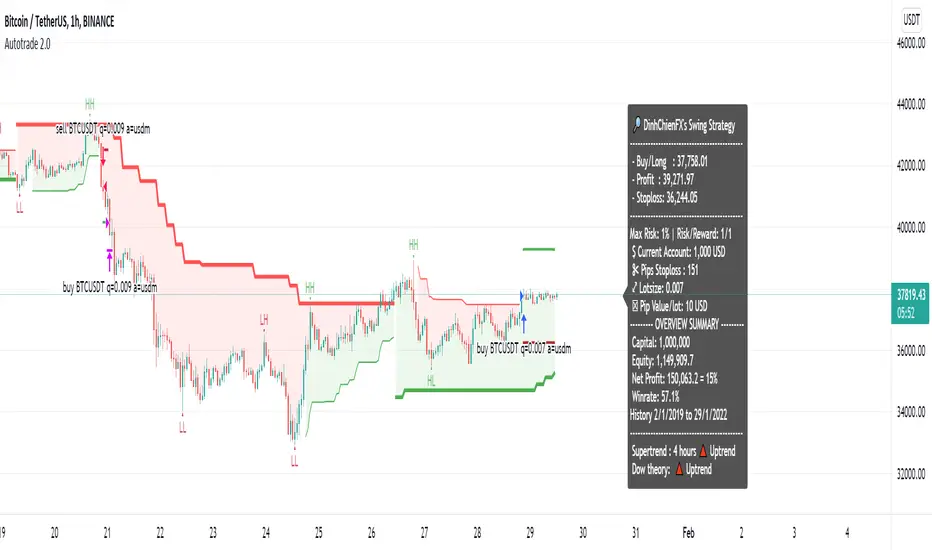
[Crypto] Autotrade 2.0* Auto quantity & commission = 0.06 (Binance future fee)
1. H4 timeframe: Supertrend indicator
- Long when the closes candles is above the green line.
- Short when the closes candles is below the red line.
2. H1 timeframe: Supertrend indicator
- Long when the closes candles is above the green line.
- Short when the closes candles is below the red line.
3. How signals work?
a. Short position:
- Supertrend 4h: Short, main trend.
- Wait for a corrective waves (long)
- Breakout the long corrective waves to sell (Short) follow the main trend (H4)
a. Long position:
- Supertrend 4h: Long, main trend.
- Wait for a corrective waves (short)
- Breakout the short corrective waves to buy (Long) follow the main trend (H4)
4. Backtest result (49 pairs) from Binance broker.
- 8 pairs is winrate > 60%.
- 23 pairs is winrate > 55%.
- 13 pairs is winrate > 52%
- 5 pairs is winrate
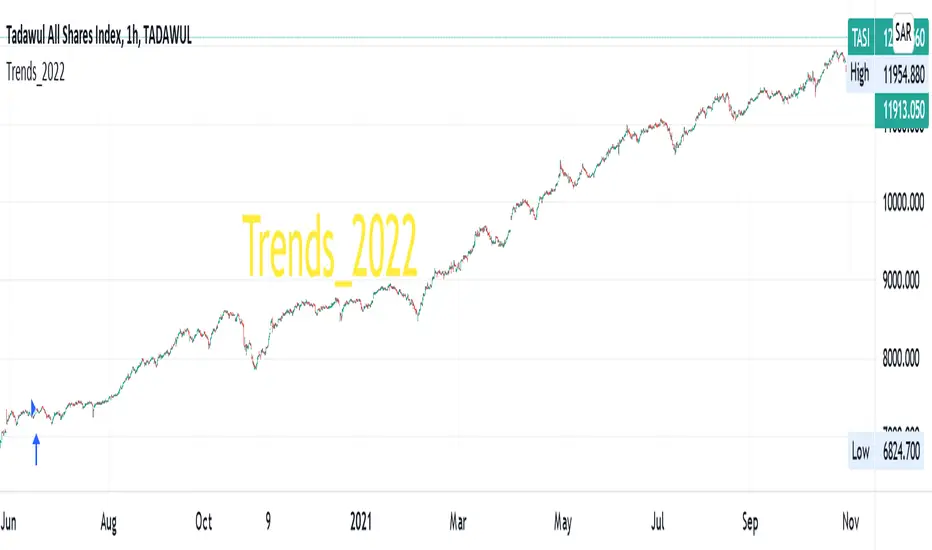
Trends_2022Hello everyone,
we are developing a strategy which is suited for people that likes to trade in small time frames.
Our strategy uses many indications for entries. These indicators can be used individually or better solution we combined them together for best prediction.
These indications like True Range, Average True Range , moving averages also previous bars highs, lows and closes values and finally mathematical equations to decide close price wave movement. Most of the work is in scaling price data and comparing them with the indicators to decide trend
The strategy is planned to go only long direction..
now we will discuss how each indicator is used to decide trend
* According to ATR trend prediction ...
it is up when the scaled bar price greater than ATR value
it turns down when the scaled bar price is less than ATR value
* According to MAs trend prediction ...
we use SMA and previous bar data averages then apply linReg ( Linear regression curve) this result in curve up and down zero
it is up when the value is up zero
it turns down when the value is down zero
* According to close price wave movement ...
we applied cos function on previous bars close data to get the sloping wave of close movement
If the slope is increasing ... this means the current wave value is greater than the previous value
If the slope is decreasing ... this means the current wave value is less than the previous value
Now as we mentioned before... The strategy goes only long direction.
LONG ENTRY Conditions (ANDing condition not ORing):
we can use any one of these indicators individually, or mix any two of them or use them all simultaneously
So... LONG ENTRY Conditions are as below:
if ATR trend is used .. it should be UP.
if MAs trend used .. it should be > 0.
if close wave slope is used .. it should be increasing.
On the other side… the Exit conditions are also (ANDing condition not ORing):
So... LONG Exit Conditions are as below:
if ATR trend is used .. it should be down.
if MAs trend used .. it should be < 0.
if close wave slope is used .. it should be decreasing.
Please send me private message for script authorization.
Happy trading everyone!
v1 Automatic Trading Bot | BacktestHello Friends.
We have been working on this script for a long time. Briefly, our scenario works as follows.
This test data includes results as of January 1, 2022 using a balance of $1000 and 10%.
WORKİNG LOGİC :
Relative Strength Index
Directional Movement Index
Relative Momentum Index
Indicators are Blended.
1 conditions are met in the overbought and oversold zone.
If the Directional Movement Index Signal is in the same direction, If all signals are in the same decision, it will be position.
We can set the take profit and stop loss levels on the algorithm as % over the entry price.
HOW TO ADJUST :
Formula a and formula b values are adjusted by increments or decrements of 1 each. these adjustments should be changed according to the time frame and chart layout.
You do not need to intervene in overbought and oversold zones. The Best Values were thus deemed appropriate.
If you still want to intervene, you need to know; When you change the overbought and oversold values, the entry time and risk will increase.
Together with the backtest script we are able to adjust the algorithm to all timeframes.
For example, while these settings are ideal for 5 minutes, it is necessary to change the strenght and formul values for a 15-minute period. This provides a user-specific adjustable strategy.
There are 6 different triggers in total on the alarm version.
Enter a long position.
Long position take profit
Long position stop loss
Enter a Short position.
Short position take profit
Short position stop loss
Currently, one platform is also connected to the binance exchange via an API .
The maximum leverage is set to 5 and a maximum of 5 trades are ordered to enter.
I will post the alarm version soon.
Good Luck Everyone !

TEMA/HMA/VWMACD - Short Strategy 4HAs we can discover by studying the history of BTCUSD, the fall is always swift. Confirmation of this - today's collapse. In this strategy, an attempt is made to catch such drop by using quick entry and quick exit.
Let's describe what this strategy consists of:
• TEMA (you can find this strategy separately on this page or on platform)
• VWMACD
• HMA
• Take-profit and Stop-losses
Logic:
Firstly we VWMACD (the difference between VWMACD and simple MACD is only in the way of calculating moving average) and plot it as a histogram.
Then HMA is adding as a trend filter. For easy understanding let's plot it now on chart separately.
Next step is to create and add TEMA. After it is needed to subtract slow TEMA from fast TEMA and plot this value around 0 on histogram. This is the main decision for the implementation of the short trade.
ENTRY the trade:
When VMACD is below 0 and price (src = close) is below the HMA and TEMA below 0.
CLOSE the trade:
When VWMACD is upper than 0 or price is upper than HMA or TEMA is upper than 0
You can find more strategies on tradingammo.pro.

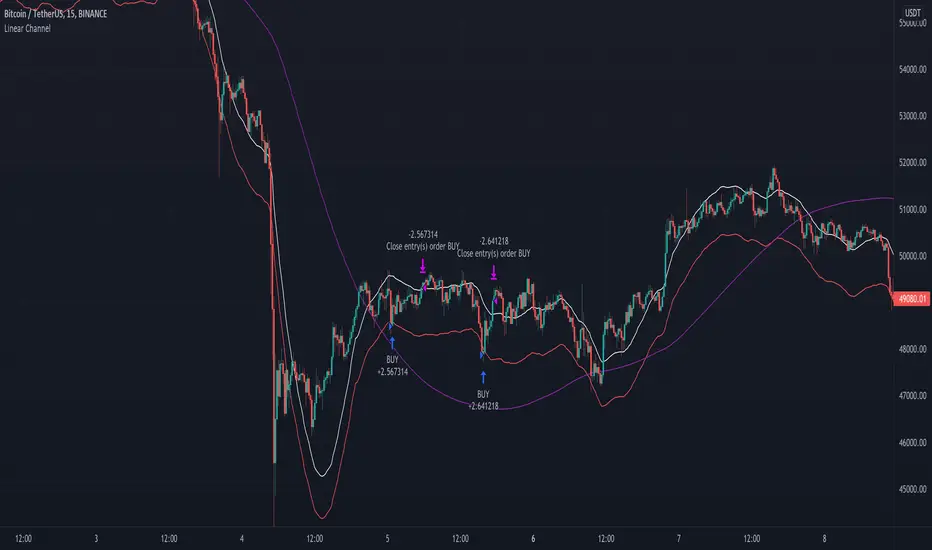
Linear Channel - Scalp Strategy 15MSimple way how to use Linear Regression for trading.
What we use:
• Linear Regression
• HMA as a trend filter
Logic:
Firstly we make simple linear regression moving. It is the white line which appears on the chart.
Then we make second line (named: band2) on the chart by multiplying linreg and value difference.
The third step is to ad HMA as a trend filter.
The trade open when price is below band2, but still upper than Hullma. The trade close when price again upper than linreg.
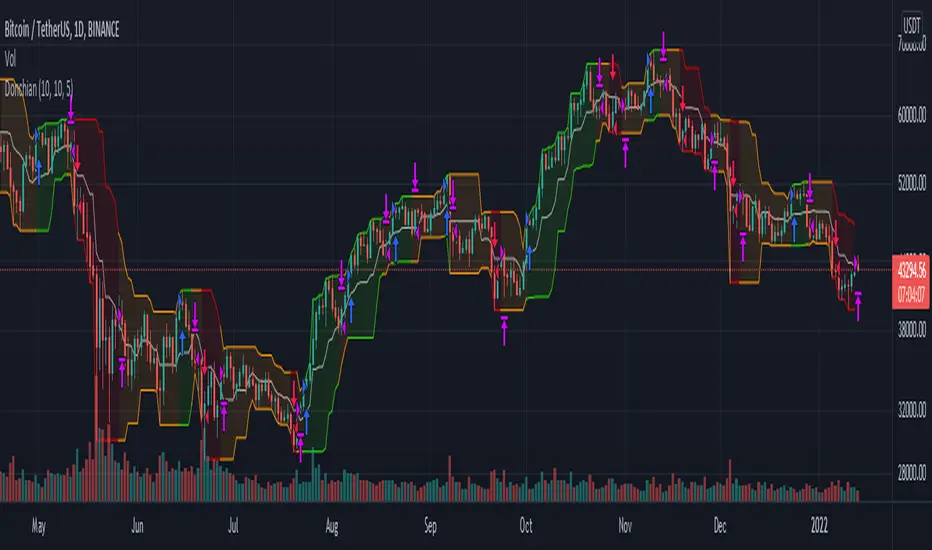
Donchian Channel Strategy IdeaThis strategy idea is a variation of the "Donchian Channel" trading strategy. It is built with a highest-high band, a lowest-low band, and a baseline which is average the highest-high and the lowest-low bands. This strategy is very useful in trending instruments on 1W and 1D timeframes. This is the implementation used in the QuantCT app.
You can set the operation mode to be Long/Short or long-only.
You also can set a fixed stop-loss or ignore it so that the strategy acts solely based on entry and exit signals.
Trade Idea
When the close price breaks up the previous highest-high, it is a long signal, the market is considered rising (bullish), and the plotted indicator becomes green. Long positions are held until the close price crosses under the baseline.
When the close price breaks down the previous lowest-low, it is a short signal, the market is considered falling (bearish), and the plotted indicator becomes red. Short positions are held until the close price crosses above the baseline.
Otherwise, if we have no position in the market, the market is considered ranging, and the plotted indicator becomes orange.
Entry/Exit rules
Enter LONG if the close price breaks up the previous highest-high (i.e. when the plotted indicator becomes green).
Exit LONG if the close price crosses under the baseline (i.e. when the plotted indicator becomes orange).
Enter SHORT if the close price breaks down the previous lowest-low (i.e. when the plotted indicator becomes red).
Exit SHORT if the close price crosses above the baseline (i.e. when the plotted indicator becomes orange).
CAUTION
It's just a bare trading idea - a profitable one. However, you can enhance this idea and turn it into a full trading strategy with enhanced risk/money management and optimizing it, and you ABSOLUTELY should do this!
DON'T insist on using Long/Short mode on all instruments! This strategy performs much better in Long-Only mode on many (NOT All) trending instruments (Like BTC, ETH, etc.).
MA Bollinger Bands + RSI This script uses the standard deviation of a given moving average along with an RSI direction.
When: rsi crossover neutral line + price crossover lower deviation boundary => long
When: rsi crossunder neutral line + price crossunder upper deviation boundary => short

Up & Down Trend following trading strategy for BTC/USDT 3hThis strategy is based on multi time frame technical indicators such as;
1. RSI (10,50,100)
2. MFI (10,50,100)
3. RVI (10,50,100)
4. BOP (10,50,100)
5. Super Trend
6. SAR indicator
7. Higher highs and lower lows
8. SMA (9,500)
9. EMA (9,200)
After evaluating different parameters provided by those indicators, script is in a possition to determine optimul positions to enter in to market as well as exit from the market. In some cases stratergy will exit fully or partially depends on the situation. Other than that, this strategy is in a possition to calculate and specify the quantity you need to buy or sell depending on market situation. You can specify amount available for investment and how many times you are going to average (if downtrend). Parameters are optimised to BTC/USDT, 3h standerd candlestic chart.
goodluck
