Divergence for Many Indicators v4 STHello Traders.
This is the Strategy version of Divergence for Many Indicators v4, an easy and comfortable indicator.
- - - -
*It's been modified a little bit from the original.
*I got permission from the original author.
*I'm not good at English, I'm sorry.
- - - -
< 4 things to check >
1. Since repainting is not performed, the first imprinted signal can be accurately seen.
2. It does not respond to continuous diversions.
3. If the opposite diversity is not imprinted, caution is required as it is designed not to indicate liquidation. Be careful when reading the figures shown in the strategy tester.
4. Added stop loss and take propirane.
< What changed? >
1. pivot period 5 - > 9
2. Money Flow index and Chaikin Money Flow are released.
- - - -
KOR SUB
< 4가지 확인 사항 >
1. 리페인팅이 없으므로 첫 번째로 각인된 신호를 정확히 볼 수 있습니다.
2. 연속된 다이버젼스에 대해서는 반응하지 않습니다.
3. 반대의 다이버젼스가 각인되지 않으면 청산 표시를 하지 않도록 설계되어 있으므로 주의를 요합니다.
4. 스탑 로스와 테이크 프로핏 항목을 추가하였습니다.
< 무엇이 변경되었나? >
1. 피봇 페리어드 값이 조금 수정되었습니다.
2. MFI & CMF 가 체크 해제된 상태입니다.
THANK YOU ^^
Ketidakstabilan

ETF 3-Day Reversion StrategyIntroduction: This strategy is a modification of the “3-day Mean Reversion Strategy” from the book "High Probability ETF Trading" by Larry Connors and Cesar Alvarez. In the book, the authors discuss a high-probability ETF mean reversion strategy for a 1-day time-frame with these simple rules:
The price must be above the 200 day SMA and below the 5 day SMA.
The low of today must be lower than the low of yesterday (must be true for 3 consecutive days)
The high of today must be lower than the high of yesterday (must be true for 3 consecutive days)
If the 3 rules above are true, then buy on the close of the current day.
Exit when the closing price crosses above the 5 day SMA.
In practice and in backtesting, I’ve found that the strategy consistently works better when using an EMA for the trend-line instead of an SMA. So, this script uses an EMA for the trend-line. I’ve also made the length of the exit EMA adjustable.
How it works:
The Strategy will buy when the buy conditions above are true. The strategy will sell when the closing price crosses over the Exit Moving Average
Plots:
Green line = Exit Moving Average (Default 5 Day EMA)
Blue line = 5 Day EMA (Used as Entry Criteria)
Disclaimer: Open-source scripts I publish in the community are largely meant to spark ideas that can be used as building blocks for part of a more robust trade management strategy. If you would like to implement a version of any script, I would recommend making significant additions/modifications to the strategy & risk management functions. If you don’t know how to program in Pine, then hire a Pine-coder. We can help!

Holyscalp v.3 A MACD 15 min trading strategy,
I set two macd trends that must match in trend direction to be traded,
along with that they must follow the moving average trend set in place
the trades trigger with an atr stop loss indicator "atr+" by zedartoftrading to be exact
It automates fully through autoview/oanda broker
the ma breach settings look back however many bars set in place and see if the bars are closing in opposite trend to the moving average
*TIP get another chart with same forex pair and take and change the candle sticks to heikin candles and set chart to 1D and trade only with that trend for the 15min settings, you can disable short trades by setting the threshold limit to 1 and to disable long trades set threshold to -1
Dec 31, 2021
Release Notes: for my use only
an hour ago
Release Notes: It trades based on these parameters I set in place.
1. The long term macd trend and the short term macd trend must match
2. The atr+ can not be more than 3x the previous atr.
3. It must trade with the trend set in place, I have two moving averages to choose from, to disable the second moving average set it to 1.
4. Don't touch the hammer and star fib level leave at zero, need to code that separately
5. the MA breach looks back a certain amount of bars to try and stop trading while its consolidating. I set at 1:0
an hour ago
Release Notes: Just updated the default settings, Remember they are set for optimization for 15mins but the same rules and parameters still apply to longer time frames, just change the moving averages to your liking if you want to move up timeframes.

TFO + ATR Strategy with Trailing Stop LossThis strategy is an experiment to learn what happens when The Trend Flex Oscillator (by Dr. John Ehlers) is used in conjunction with a volatility indicator like ATR. It was designed with cryptocurrency trading in mind.
The way I coded this experiment makes it unsuitable for bear market conditions.
When applied to a bull market, this trend-following strategy will open long positions when oversold price action appear to be reversing. It will typically close a position within a few days unless it gets caught in a bear market, in which case it holds on for dear life. I have tried to make back-testing very simple, but you should never trust it. It's merely and interesting tool for adjusting the many parameters that I've made editable in the configuration window. Those values include the ATR and TFO parameters, as well as setting a trailing stop loss. When closing a position, the strategy can optionally be told to ignore the trend analysis and only obey the trailing stop loss value. I've made an attempt to allow the user to define the minimum profit necessary to allow the strategy to close all all positions. In my observations, the 2H candlestick charts seem to produce the best results, although the parameters of the strategy could theoretically be adjusted to suit other time periods.
In summary...
This strategy has a bias for HODL (Holds on to Losses) meaning that it provides NO STOP LOSS protection!
Also note that the default behavior is designed for up to 15 open long orders, and executes one order to close them all at once.
Opening a long position is predicated on The Trend Flex Oscillator (TFO) rising after being oversold, and ATR above a certain volatility threshold.
Closing a long is handled either by TFO showing overbought while above a certain ATR level, or the Trailing Stop Loss. Pick one or both.
If the strategy is allowed to sell before a Trailing Stop Loss is triggered, you can set a "must exceed %". Do not mistake this for a stop loss.
Short positions are not supported in this version. Back-testing should NEVER be considered an accurate representation of actual trading results.
// portions © allanster (date window code)
// portions © Dr. John Ehlers (Trend Flex Oscillator)
This code is provided for educational purposes only. The results of this strategy should not be considered investment advice.
The user of this script acknowledges that it can result in serious financial loss when used as a trading tool

Configurable Multi MA Crossover Voting SystemThis strategy goes long when all fast moving averages that you have defined are above their counterpart slow moving averages.
Long position is closed when profit or loss target is hit and at least one of the fast moving averages is below its counterpart slow moving average.
The format of the config is simple. The format is : FASTxSLOW,FASTxSLOW,...
Example : If you want 2 moving averages fast=9,slow=14 and fast=20,slow=50 you define it like this : 9x14,20x50
Another example : 5x10,10x15,15x20 => means 3 moving average setups : first wih fast=5/slow=10, second with fast=10/slow=15, last with fast=15/slow=20
You can chose the type of moving average : SMA, WMA, VWMA (i got issues with EMA/RMA so i removed them)
You can chose the source of the moving average : high, close, hl2 etc.
You can chose the period on which ATR is calculated and ATR profit/loss factors.
Profit is calculated like : buy_price + atr_factor*atr
Loss is calculated like : buy_price - atr_factor*atr
Performance in backtest is variable depending on the timeframe, the options and the market.
Performance in backtest suggests it works better for higher timeframes like 1d, 4h etc.
Disclaimer
Please remember that past performance may not be indicative of future results.
Due to various factors, including changing market conditions, the strategy may no longer perform as well as in historical backtesting.
This post and the script don’t provide any financial advice.

Portfolio Performance - Effects of RebalancingFunction:
- Can be used to evaluate the performance of a portfolio containing 2 assets over a set time interval
- Shows the % return of the portfolio over the time interval defined by the user
- Includes a threshold rebalancing algorithm to show the effects that rebalancing has on the portfolio over the long term
- Created to evaluate of the performance of portfolios containing different weightings of stocks and bonds over time assuming that the user would rebalance the portfolio when asset weights crossed a threshold
Instructions:
- To be used with dividends adjustments turned on
- Add this script to a symbol. e.g. AMEX:SPY
- Click the chart to define the entry time and the exit time. i.e. the time interval
- Define the initial investment of the portfolio. Default setting is $100,000
- Define the second asset to be included in the portfolio. e.g. BATS:AGG
- The strategy comes pre-populated with a portfolio that has a weight of 80% asset 1 and 20% asset 2. i.e. 80% AMEX:SPY and 20% BATS:AGG if the symbols mentioned above were chosen
- The 7 lines show the weighted % return of each portfolio over the time period defined by the user
- Each line (except the blue) is the return based on a different rebalancing threshold. The default settings are 1%, 2.5%, 5%, 10%, 15%, 20%, 30%
- The blue line is the % return of a portfolio that was made up of 100% asset 1 over the time interval. i.e. 100% AMEX:SPY
- Asset weights and rebalancing thresholds are adjustable via the settings
- Each plot can be turned on and turned off via a tick box in the settings

[AXSUSDT] Multi signal Autotrade Binance* Commission: 0.06 and Autotrades Binance setting:
* Risk: 1%/trades and Stoploss moving formular:
1. H4 timeframe: Supertrend indicator
...Uptrend when closes candles is above the green line.
...Downtrend when closes candles is below the red line.
2. Pivot H/L:
- UPTREND:
... HH (Higher High) - HL (Higher Low)
... HH (Đỉnh sau cao hơn) - LH (Đáy sau cao hơn)
- DOWNTREND:
... LL (Lower Low) - LH (Lower High)
... LL (Đáy sau thấp hơn) - LH (Đỉnh sau thấp hơn)
3. Keltner Channels for detemined a trend & open trades: No repainting by checking previous closes candles.
* KELTNER BASIS = EMA(50)
- Zone for UPTREND: closes candle crossover Keltner Channels Upper 1, 2, 3
- Zone for DOWNTREND: closes candle crossunder Keltner Channels Lower 1, 2, 3
- Zone for opentrades: Keltner Channels Lower 1, Basis, Upper 1.
a. Open trades at Basis:
b. Open trades at Upper 1/Lower 1:
c. Open trades at SELL Upper 1/ BUY Lower 1:

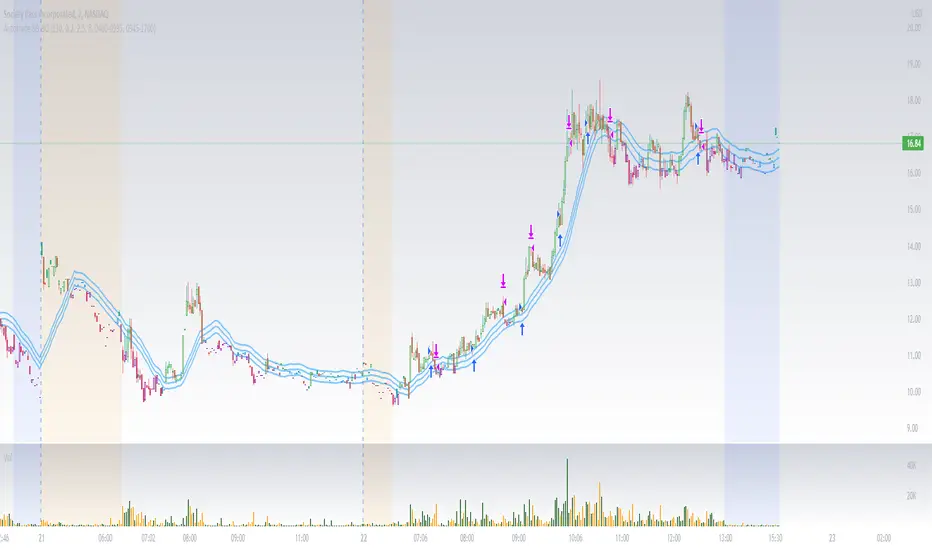
Super Auto Breakout Day Trade Volatile stocksThis strategy is looking at MA and distance from MA to determine entry and exit for highly volatile day trade stocks.
This trading strategy is not good for big-cap stocks as the movement there is not much in terms of %.
The target for open trade is to close at a 10% gain or at 2.8% loss which is a good risk to reward ratio.
Intraday Grid trading exampleHello everyone,
This was a grid trading example for intraday trading.
Please be advised that every commodity have diferent kind of reaction and rate of change between periods therefore the percentages need to be adjusted acording to the commodities change %.
In order to specify the adjustment rate we add the Zig Zag in the script.
For Example ;
Last 3 days zigzag high points are %25 , %13 and %8 , the average %is about %9 therefore you have to put the adjustment ratios something like;
Z%1 = %3
Z%2 = %6
Z%3 = %9
Feel free to use the script with caution( it was not a investment advice), this was only a example of grid trading strategy on our trading platform.
Regards.
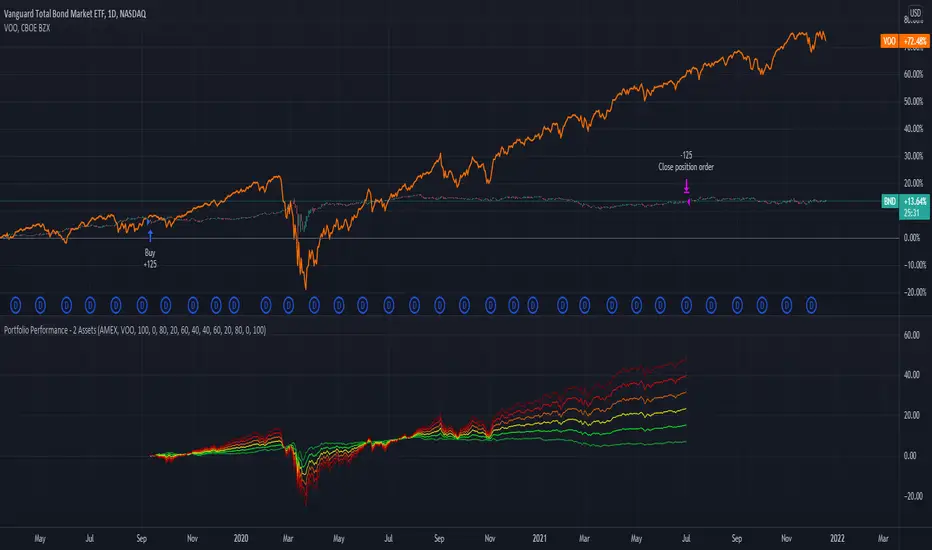
Portfolio Performance - 2 AssetsFunction:
- Can be used to evaluate the performance of portfolios containing 2 assets over a set time interval
- Created to evaluate of the performance of portfolios containing different weightings of stocks and bonds over time
- Shows the % return of each portfolio over the time interval defined by the user
- Capable of showing the risk adjusted % return of each portfolio over the time interval defined by the user (setting turned off by default)
Instructions:
- To be used with dividends adjustments turned on
- Add this script to a symbol. e.g. NASDAQ:BND
- Click the chart to define the entry time and the exit time. i.e. the time interval
- Define the second asset to be included in the portfolio. e.g. AMEX:VOO
- The strategy comes pre-populated with 6 portfolios with the most common stock/bond weightings (100% stocks/0% bonds, 80% stocks/20% bonds, 60% stocks/40% bonds, et cetera)
- The 6 lines show the weighted % return of each portfolio over the time period defined by the user
- All asset weights are adjustable via the settings
- Each plot can be turned on and turned off via a tick box in the settings
- There are 6 plots that show the risk adjusted returns of each portfolio (setting turned off by default)
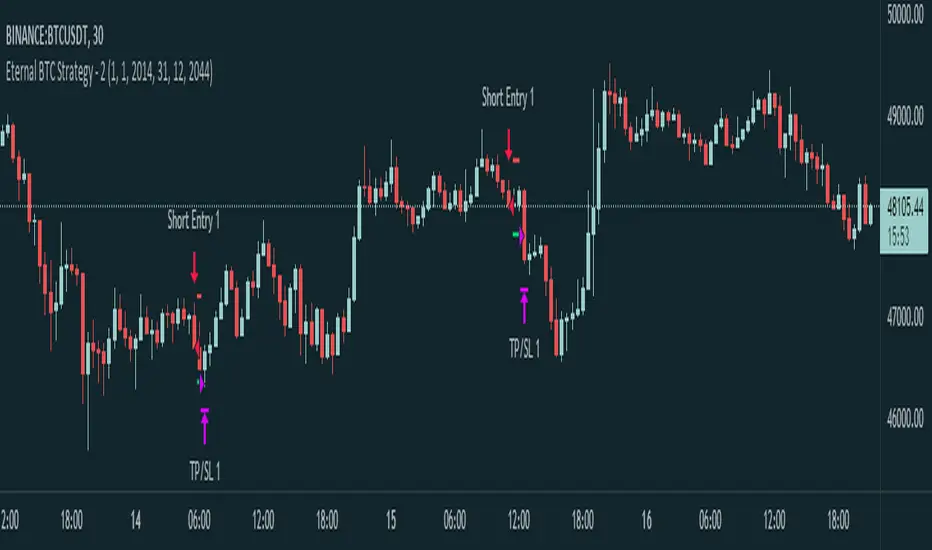
Eternal BTC Strategy - 2This is a summary of how this strategy works.
- Momentum, Volatility detection:
1. First of all detects market momentum
2. Uses volume indicators to make sure of the movement existence
- Trade execution:
3. Uses crossovers of some MAs
4. After crossovers, waits for trend analysis indicators signals to trigger the order
- Take profit & Stop loss:
5. Calculates SL and TP using a formula (combined of volume , MAs and others)
* This is just a simple representation of how this strategy works, It's coded in about a 2000 lines script.
This strategy works best on Bitcoin / TetherUS • BINANCE
No setting is needed to be applied by you, you'll just simply add the script and receive alarms.
Alarms are included opening of the trade, TP and SL touch.
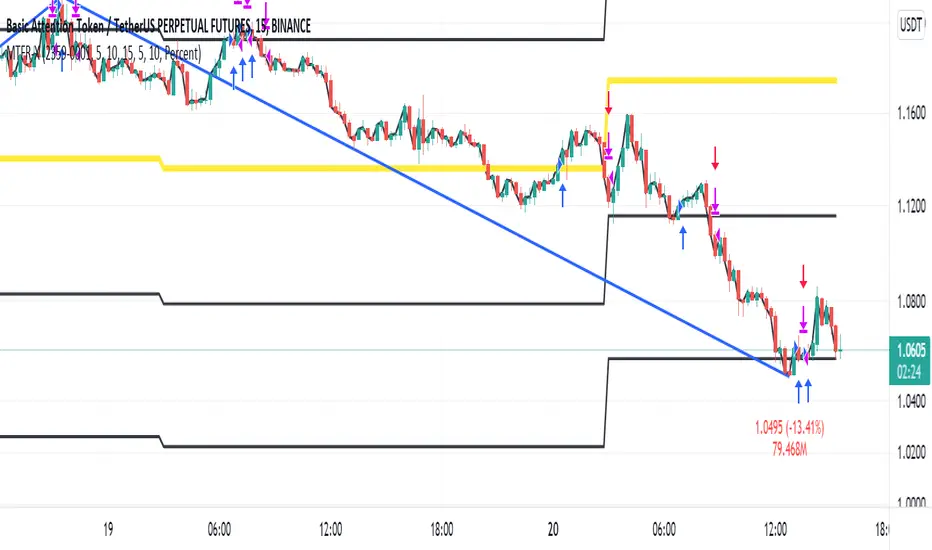
Up & Down Trend Trading Strategy - BNB/USDT 15minThis strategy will focus on up trend trading and down trend trading based on several indicators such as;
for up trend
1. SAR indicator
2. Super trend indicator
3. Simple moving average for the period of 100
down trend
1. RSI Indicator
2. Money flow index
3. Relative volatility index
4. Balance of powder

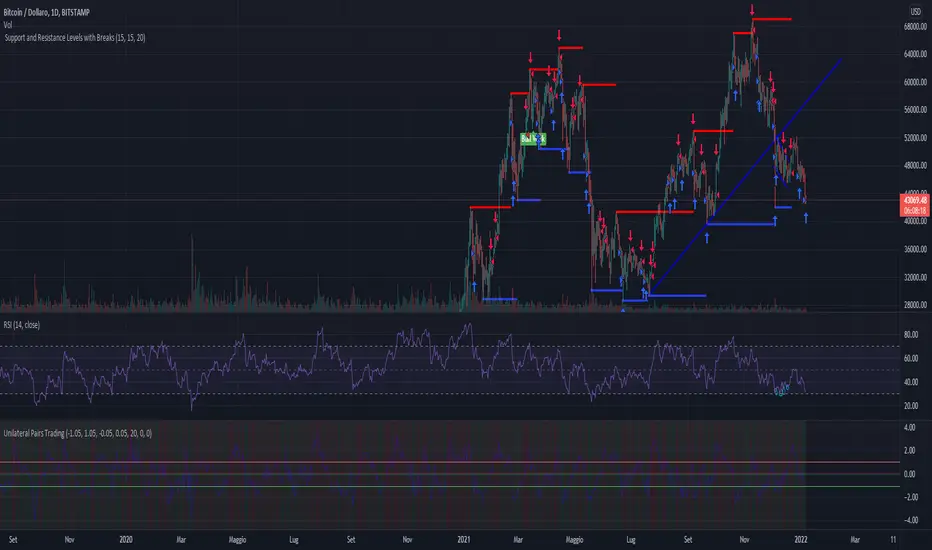
BTC Strategy - EternalThis is a summary of how this strategy works.
- Momentum, Volatility detection:
1. First of all detects market momentum
2. Uses volume indicators to make sure of the movement existence
- Trade execution:
3. Uses crossovers of some MAs
4. After crossovers, waits for trend analysis indicators signals to trigger the order
- Take profit & Stop loss:
5. Calculates SL and TP using a formula (combined of volume , MAs and others)
* This is just a simple representation of how this strategy works, It's coded in about a 2000 lines script.
As you can see, it has a great performance, 71.59% win rate in 989 trades so it's a very confident result.
This strategy works best on Bitcoin / TetherUS • BINANCE
No setting is needed to be applied by you, you'll just simply add the script and receive alarms.
Alarms are included opening of the trade, TP and SL touch.

ms hypersupertrendThis is a well-known strategy by using 3 different Supertrends and a trend-defining EMA,
feel free to play around with the settings, a backtest on 8h ETHUSDT pair brought some good results using
the 233EMA and investing 75% of a 10k start capital
the idea is to have at least 2 super trends going green above the trend-EMA to go long and exit by turning
2 super trends red (idea: 1 super trend in red could initialize a take profit)
shorts work vice versa
The EMA shows in green for uptrends and in red for downtrends, if it is blue no Signal will be taken because
the 3 super trends are not all above or below the trendline(EMA)
//-------------------------------------------------------------------------------------------------------------------------------------------------
Update 1:
- Fixed a minor input error
- Added ATR stoploss, and commented out the percentage stop loss
- Added time window to backtest
- Added exit on risk/reward is met
- This version is only buy...wait for next update adding shorts and more
As always, thanks for your ideas, likes, and support. Feel free to mess around with the settings and give me your feedback.

Super Breakout day trading This is an intraday indicator which uses Bollinger band and volume flow and MA to alert buy and sell signal.
A user can use this indicator to help make entry and exits. This indicator wont show entry and exist of larger time frames like Day week month.
This indicator uses Bollinger bands but try to minimize it shortcoming where it will buy and keep holding and eventually sell at a loss.
By adding addition parameters around volume it check if the price has reached its peak

Cyatophilum Accumulation StrategyAn indicator to backtest and automate accumulation/pyramiding custom strategies.
The goal of the strategy is to buy several times when the price is low and sell all when the position is in profit.
Configure your strategy using the entry options and entry filters, then set your Take Profit and StopLoss.
═════════════════════════════════════════════════════════════════════════
█ HOW IT WORKS
The strategy has pyramiding enabled, which means it can open several deals in a row.
It will keep buying until the Take Profit target is reached.
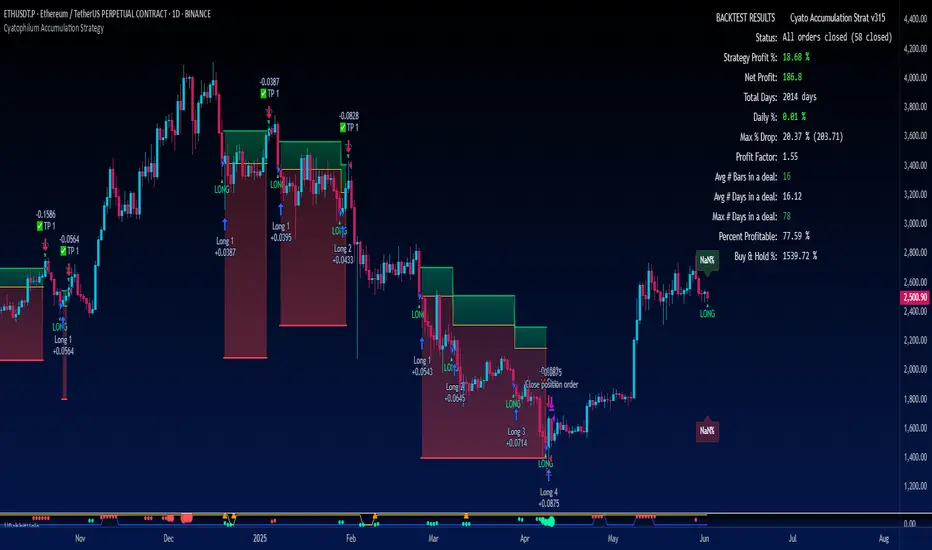
The indicator plots the Take Profit and Break Even line which are recalculated at each new deal.
The target corresponds to the average entry price plus a configurable percentage.
We can see the average entry price line drop lower at each Long Entry.
█ HOW TO USE
Choose a pair that you want to hold/invest in.
Pick a chart time frame that you like, according to how often you want the strategy to place orders. A benefit of this strategy is that it can work on low time frames as well as high time frames. Just keep in mind that the smaller the time frame, the bigger the impact of fees and slippage will be on the strategy results.
Configure your entry condition . You can combine several technical indicators to trigger an entry, such as Top & Bottom, Higher Lows and RSI divergences.
Example with double bottoms:
Filter your entry signal . Add filters to strengthen your entry signal.
Configure your profit target
Use the Take Profit feature to set a target in percentage of price. You can also make it trail.
There is a Trailing Stop Loss feature but the goal of the strategy is to never sell in loss, so it is turned off by default.
Check your backtest parameters
Make sure that the initial capital and order size make sense. Since it is a pyramiding strategy, the sum of all deals should not be bigger than the initial capital.
In this example: Initial capital is 10 k, max active deals is 10, so the max order size is 1 k.
If you use % equity as order size, please note that it will create compounding.
Check the fees, by default they are set to 0.1%.
I also recommend to set a slippage that corresponds to your exchange's spread.
Note: the pyramiding parameter has to be equal to the "Max Active deals" input.
█ FEATURES
• Entry settings
Configure wether to go long or short, or both.
Choose the Max Active deals : the maximum number of deals that you want to open at once.
The Minimum bar delay between deals parameter will help putting space between deals.
• Trend Filter
The trend filter will fitler off long deals when the trend is bearish, and short deals when it is bullish.
Choose a trend line from a list, or any external trend line you can find.
The Trend condition allows to choose wether the trend should switch from slope change or price cross.
• MTF Trend Filter
A secondary trend line, Multi Time Frame.
• Volume Filter
The volume filter will check the bar volume and prevent the entry if it is too low.
• Stop Loss and Take Profit
Configure your stop loss and take profit for long and short trades.
You can also make a trailing stoploss and a trailing take profit.
• Backtest Settings
Choose a backtest period, longs or shorts, wether to use limit orders or not.
An option to close open orders at the current bar if you have multiple open orders and are wondering what it would result to close them now.
Graphics
A Configuration panel with all the indicator settings, useful for sharing/saving a strategy.
A Backtest Results panel with additional information from the strategy tester.
█ ALERTS
The indicator is using the alert() calls: it only uses 1 alert slot to send order messages for each event. This means free TV plans can create 1 complete strategy.
To set your alert messages, open the indicator settings and scroll to the bottom of the "inputs" tab.
Create your alert after you set the messages in the indicator settings, and make sure "Any alert() function call" is set in the alert option.
█ LIMITATIONS
Things to keep in mind when using this strategy.
• No Stop loss
When trading without stop loss, your equity can drop without limit, and it can take a while until price recovers.
This is why when backtesting I recommend to keep an eye on the "Max # Days in trades" statistic which tells the maximum days a trade took to close in profit.
• Spot markets only
Obviously, trading without stop loss means no leverage.
█ BACKTEST RESULTS
The backtest settings used in this snapshot are the following:
Initial Capital: 10 000€
Order size: 1 000 €
Commission: 0.1€ per order
Slippage : 10 ticks
Please read the author instructions below for access and automation.
[Crypto] Dow theory strategy - Commission: 0.06 = Binance future fee.
- Autotrade by webhook to Binance future options:
1. Trend Identification:
a. UPTRENDTREND:
- HH_Trend: Higher High trend.
- HL_Trend: Higher Low trend.
b. DOWNTREND:
- LL_Trend: Lower Low trend.
- LH_Trend: Lower Low trend.
2. Open trades conditions:
a. LONG OPEN CONDITION: Điều kiện MUA.
- HH_E: Higher High entries.
- HL_E: Higher Low entries.
b. SHORT OPEN CONDITION: Điều kiện BÁN.
- LL_E: Lower Low entries.
- LH_E: Lower Low entries.
3. Stop loss and Take profit:
Stoploss, Profit = Entry Price +- ATR(20) * 5
4. Summary every year:
- 2021 to 15 Dec, 2021
- 2020 to 2021:
- 2019 to 2020:
- 2018 to 2019:
- 2017 to 2018:
- 2016 to 2017:
- 2015 to 2016:
- 2014 to 2015:
- 2013 to 2014:
5. Summary long-range:
- 2019 to 15 Dec, 2021:
- 2016 to 2019:
- 2013 to 2016:
6. List of other pairs:

Contrarian Scalping Counter Trend Bb Envelope Adx and StochasticContrarian Scalping is an trading strategy designed to take advanted of a counter-trend.
The advantage of these strrategies types is that they have a good profitability but with do not great gain (in relation at the time frame).
Indicators used:
Bollinger
Envelope
ADX
Stochastic
Rules for entry
For short: close of the price is above upper band from bb and envelope, adx is below 30 and stochastic is above 50
For long: close of the price is below lower band from bb and envelope, adx is below 30 and stochastic is below 50
Rules for exit
For short: either close of the candle is below lower band of bb or enveloper or stochastic is below 50
For long: either close o the candle is above upper band of bb or envelope or stochastic is above 50
If there are any questions let me know !

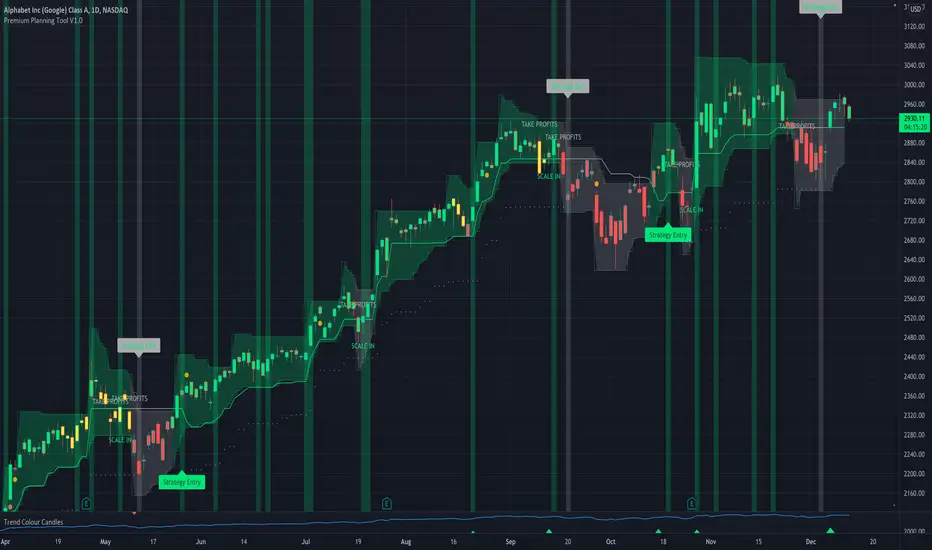
Premium Planning Tool V1.0Background to the tool
The tool was built out of frustration. Having traded for many years with a reasonable level of success I was always frustrated that my trading never went up a level. The world of trading is filled with people having so much more success than me and this level of FOMO really bothered me and resulted in inconsistency and countless hours sitting in front of a screen, hoping for the best. I also became a little bit of an indicator junkie - was there a holy grail indicator out there for me? I always felt that as a retail trader I was behind the curve. I started to investigate how the major market participants trade and make money and I was astounded at the level of success that they get from creating strategies and sticking to it. The market is driven largely by a "black boxes" which, for us retail traders are outside of our ability to access. I wanted to build a tool that could give me a traders edge.
Another factor that has always bothered me was when reading investing books there is a general assumption that a standard entry, say 8/13 cross over, works on all stocks. However, it is not the case and it can be frustrating for a trader using a set up and not realizing that the set up is the problem, not the trader. This realization alone has made a huge impact on my trading. The big boxes that control the market know this already.
Also, a lot of indicators that are available don’t take advantage of the backtesting capability provided in Tradingview. It is fairly simple to find 8-9 trades where a set up worked and then fall into the trade of assuming that it cannot fail. Knowing which set ups work and how frequently it will print will change the way that you trade.
The goal with the tool is to identify setups that have worked in the past with a high degree of profitability, high profit factor and low drawdown and using the planning tool allows you to customize the setup to find exactly what you are looking for across any tradeable asset on TradingView.
Over the past 20 years I have realized the following:
1) Not all entries and signals work the same on all stocks
2) Not having a plan in advance lowers your probability of success
3) Developing consistency in analysis is critical
4) Developing confidence in your own plan is more important than whose trades you try to copy
5) Having 30 indicators does not help you trade better - it leads to more frustration
So here is the product of these realisations:
1) The tool looks across the most common entry strategies (MA cross on 5 dimensions of type and 5 common crossovers) and can be used on 19 different time frames giving you guidance on what the best set up is for the stock you are analysing
2) It incorporates volatility into the strategy – when stocks are trading outside of a predetermined volatility band, a trade will not be entered. This accommodates traders who tend to get shaken out of trades too early.
3) It looks at the impact of “buying the dip” – often a common strategy employed by many traders which now can be backtested and reviewed to see if it actually helped or hindered the trade.
4) It measures your trade plan against your R – what you are willing to risk – and calculates your target profit based on your R multiple
5) It provides a non repaint signal on your base strategy and provides you with signals to trade smaller or shorter signals within the bigger strategy.
There are some additional visual tools:
• Squeeze signals - I am a big fan of the TTM squeeze however the Squeeze by itself can be hard to trade. Seeing a squeeze fire long on a chart can add to trade confidence.
• Seeing zones of support and resistance rather than single lines can also give you some leeway in terms of not getting pushed out of a trade too soon.
The backtester is always reviewed on a 2 to 3 year period to get an understanding of win rate %, profit ratio and average duration of trade. As an option trader knowing that a high probability move is playing out allows me to make sure that I don’t undercut the time frame for the expiration of the option relative to the historical average duration of a trade. Backtesting on shorter times is unrealistic.
Key benefits
1) It saves me a ton of time. I don’t have to sit in front of a screen watching ticks each day. I can plan for an entry, set an alert for a trade and when the conditions are met the TradingView system sends me a message and I will go and confirm a trade, execute it, set my alerts for control and move on with my life.
2) It allows me to review trade ideas in a consistent manner using the best trade plan and set up for a stock.
3) It forces me to be patient and not panic (always a good thing). With an adjustable volatility feature I can modify the volatility band in the trade plan to accommodate choppy market conditions.
4) It looks at both sides of the market (long and short) and you can calculate the impact of being market neutral or having a directional bias.
The setup is based on a reversal set up and we are doing a single entry trade here with a base of 4ATR stop using a long call or a bull call debit spread and allowing GOOGL to trade on a 1ATR price band on a daily basis. This strategy has only generated 10 signals since 2018 however it has been profitable 87.5% of the time with a profit factor of 25.26. Personally, on signals with this degree of strength I will trade a long stock purchase on a STRATEGY ENTRY signal and I will look to trade shorter duration option trades (both debit and credit spreads) on the trend signals INSIDE the major buy signal.
As a high probability set up you can trade this signal by itself or you can trade the trend inside the signal which will trigger at 2966. Either way, set your alerts and get on with your life.
I hope this tool helps you to achieve some degree of peace in your trading.
To get access to the tool, please contact the author.
AlphaScalp [Backtest, No RealTime]AlphaScalp tries to find volatility moves and profits from the small pullbacks.
Even though the performance of this script in a fair amount of cases will beat HODL it is not the purpose. AlphaScalp aims for a high accuracy and profitfactor to ensure a more or less stable profit taking.
The properties like " MA Length " and the " Short - " or " Long line % " tweaks the risk by increasing or lowering the requirements for a buy (Long or Short). Close/Exit of each order is then handled by TP, SL or volatility stop.
For high volatility assets it is recommended to use the " Sell LONG on Volatility DOWN " and " Sell SHORT on Volatility UP " to ensure a TA approach for StopLoss. Normal SL is also possible to set but is not recommended on high volatility assets since you quickly can be stopped out by wicks.
AlphaScalp works best on high volatility assets with a solid liquidity and volume - but it will also work on stocks and low volatility assets.
AlphaScalp is designed for scalping and is thereby recommended to use between 5M-1H.
This version is free for your to backtest on all assets - but be aware that alerts on RealTime bars are disabled - meaning you can add alerts but they will not trigger in real time. To ensure you have the latest backtesting results, you need to have the script added to your chart, save your chart and the refresh the page.
Enjoy and please let me know if you have any questions

Classic Long Term Trend Following SystemThis is a classic long term trend following system.
The breakout period is 50 days instead of 20 and the moving average crossover are 40 and 120.
The moving averages are also exponential instead of simple.
The stoploss is 4 ATRs away from the price.
Recommendations:
Donchian Channels settings > 50 days
Moving Averages > 40 and 120, 80 and 140
Important to note:
My first strategy, DC Breakout System | This is simplicity at its finest, is best used on the crypto market and this one for stocks, commodities, currencies, etc. Those markets tend to trend a lot longer than crypto do.

Trend Following with Bollinger BandsThis is a trend following system which uses the Bollinger Bands instead of the Donchian Channels.
Long position:
* Price closes above the middle line.
* The fast EMA (in this case the 40) crosses over or is above the slow one (in this case the 120)
Short position:
* Price closes below the middle line.
* The fast EMA crosses under or is below the slow one.
Stoploss:
* 4 ATRs away from the price.
