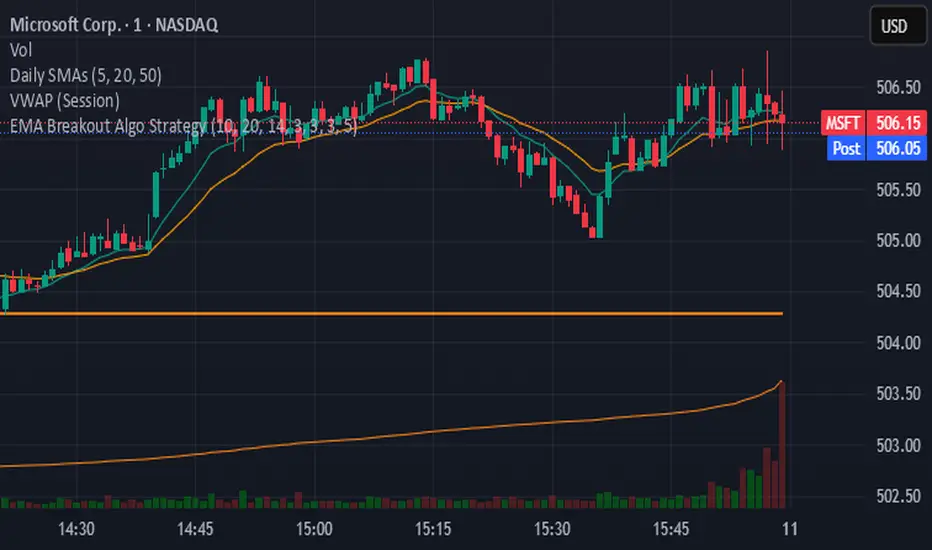
EMA Breakout Algo StrategyA volatility‑based breakout strategy using EMA alignment and ATR filters for risk‑managed entries and exits.
Ketidakstabilan
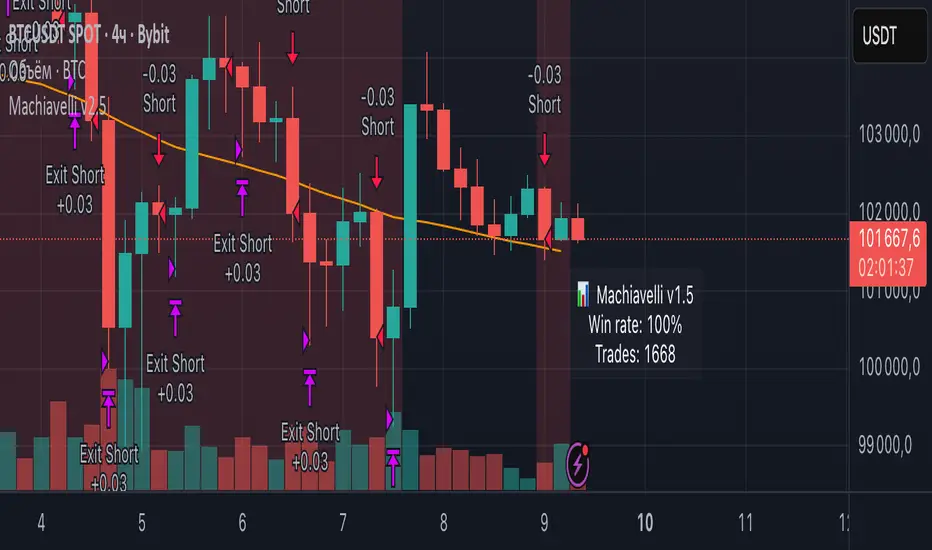
Machiavelli v2.5The purpose of this script is straightforward — to provide a reliable source of passive income.
Results speak for themselves.
WMAX-D-TPS1 (USD setup)Here I show you a strategy that I have been developing for years based on breakouts of maximum and minimum price levels.This work good in 1d

Velocity SmartMoney Engine work - Delta Exchange📈 Velocity SmartMoney Engine
Adaptive Breakout & Order Block Strategy with Dynamic Risk Control
---
🔍 Overview
The Velocity SmartMoney Engine is a next-generation trading strategy that fuses Smart Money breakout logic , Order Block structure detection , and Supertrend-based directional filtering into one precision-built system.
It identifies institutional-level breakouts , manages positions with ATR-based adaptive risk , and executes disciplined exits using stop-loss, trailing stop, and profit target logic.
Designed for swing and short-term system traders, this strategy performs excellently on BTC, ETH, NIFTY, BANKNIFTY, Gold, and major FX pairs — best on 15m to 4h timeframes .
---
⚙️ Core Components
1️⃣ Smart Money Breakout Logic
Detects real breakouts using dynamic support/resistance pivots.
Confirms entries only during strong volatility bursts.
Avoids false breakouts in sideways markets.
2️⃣ Order Block Gap Detection
Finds institutional imbalance zones (Smart Money footprints).
Bullish gaps = Long bias; Bearish gaps = Short bias.
Works with candle confirmation and momentum validation.
3️⃣ Supertrend Directional Filter
Trades only in direction of Supertrend bias.
Exits instantly when Supertrend flips.
Prevents entries against dominant trend.
4️⃣ ATR-Based Risk & Volatility Filter
Uses ATR × multiplier for adaptive stop sizing.
Volatility filter ensures trades trigger only during active markets.
Avoids whipsaw zones.
---
💰 Position Management
Stop-Loss: Adaptive ATR-based.
Take-Profit: Default 5% target (editable input).
Trailing Stop: Auto-adjusts to lock profits.
No-Exit Hold: Hold position for defined candles before exits.
Supertrend Flip Exit: Instant trend-based closure.
---
🧠 Built-In Trade Discipline
One-trade-per-bar guard prevents duplicate entries.
Volatility-weighted breakout validation.
Clean and conflict-free exit hierarchy.
---
🎯 Key Features
✅ Smart Money breakout + Order Block fusion
✅ Supertrend-based trend confirmation
✅ ATR dynamic stop + 5% profit target
✅ Adaptive trailing logic
✅ One-trade-per-bar control
✅ Works across Crypto, Indices, FX, Commodities
✅ Ideal for 1h–4h swing setups
---
📊 Recommended Settings
Parameter | Typical Value | Purpose
--- | --- | ---
Levels Period | 20 | Pivot lookback for S/R zones
Volatility Filter | 20–40 | Filters out low-momentum areas
ATR Multiplier | 1.5 | Adjust stop size by volatility
Supertrend Length | 10 | ATR period for trend bias
Supertrend Multiplier | 3.0 | Supertrend sensitivity
Target Profit | 5% | Default take-profit level
---
⚡ Suggested Use
• Best suited for swing entries on 1H / 4H charts .
• Combine with session filters or trend confluence for automation.
• Ideal as a base module for TradingView + Broker integrations .
---
🧩 Disclaimer
This script is for educational purposes only .
Past performance does not guarantee future returns.
Use responsibly. The developer assumes no liability for financial losses.
---
💬 Community & Access
Developed by: Shubham Singh
Version: Velocity SmartMoney Engine v1.0
For premium modules & automation: DM "Velocity Access" on chat to request access.
---
© 2025 Velocity SmartMoney Engine — All Rights Reserved

TitanEdge Algo Suite — 4H BTC & ETH (Delta Exchange Ready)TitanEdge Algo Suite — 4H BTC & ETH (Delta Exchange Ready)
TitanEdge Algo Suite is a next-generation trading system that fuses volatility-adaptive logic, order-block structure, SuperTrend direction filtering, and ATR-based exits into a single modular framework.
It’s engineered for 4-hour BTC and ETH swing trading, delivering institutional-grade entries, dynamic risk control, and precise exits.
⚙️ Core Features
1. Volatility Oscillator (0–100)
• Filters trades by volatility intensity.
• Uses ATR, Range, or Bollinger Band Width normalization.
• Trades trigger only when market volatility is high — filtering out sideways or weak trends.
• Ensures trades occur during real momentum expansions.
2. Breakout + Order Block Engine
• Detects pivot highs/lows to confirm authentic breakout levels.
• Identifies “smart money” gaps — institutional imbalance zones often leading to strong reversals or continuations.
• Captures both breakout continuations and order-block reversals.
• Works as a hybrid structure detector combining price action and volatility alignment.
3. SuperTrend Directional Filter
• Optional filter that only allows trades in the direction of the SuperTrend.
• Can automatically close trades when a SuperTrend flip occurs.
• Provides strong trend-following bias and helps avoid countertrend traps.
4. ATR-Based Stop & Trailing System
• Adaptive stop-loss and trailing logic that expands or tightens based on volatility.
• Supports three modes: StopOnly, TrailOnly, and StopAndTrail.
• Works in both ATR-based distance or percentage-based configuration.
• Keeps losing trades small and lets winning trades extend dynamically.
5. Volume-Based Exit Logic
• Detects low-volume exhaustion to identify momentum loss.
• Detects opposite-volume spikes as early reversal signals.
• Optional hybrid “Both” mode combines both detection methods for stronger reliability.
• Ideal for markets where volume surges indicate smart money exits or trap formations.
6. Session Filter & Anti-Churn Control
• Restrict trading hours (optional; not required for crypto).
• Prevents repeated signals and noise-based entries through minimum bars between trades.
• Cooldown logic ensures disciplined trading and avoids strategy overlap.
• Prevents multiple entries in a single bar and filters unconfirmed breakouts.
7. SmartMoney Preset Mode
• Institutional-grade configuration automatically adjusting volatility, ATR, and structural logic.
• Mimics smart money behavior by prioritizing clean structure and high liquidity volatility zones.
• Great for traders who want simplified institutional logic without manual tuning.
Optimized for 4H BTC & ETH
TitanEdge performs best on BTCUSDT and ETHUSDT pairs in the 4-hour timeframe.
The 4H chart captures high-volatility institutional swings, eliminates intraday noise, and provides clear order-block setups.
This timeframe aligns with BTC/ETH volatility cycles, providing consistent signals and cleaner trend confirmation.
Recommended settings for 4H charts:
• Levels Period: 25
• Volatility Filter: 20
• volatility oscillator Auto: disable ( it depend upon your plan test with Disable/enable)
• Volatility Method: BBWidth
• ATR Multiplier: 1.8
• ATR Stop %: 5
• SuperTrend ATR Length: 10
• SuperTrend Factor: 3
• ATR Mode: StopAndTrail
• Hold Bars: 1
• Volume Exit: Disable (Both)
• Session Filter: Off (Crypto runs 24/7)
Entry Logic
• Long Entry: Price breaks above resistance (pivot high), volatility above threshold, and optional SuperTrend confirmation.
• Short Entry: Price breaks below support (pivot low), volatility above threshold, and optional bearish SuperTrend confirmation.
• Additional Entry: Triggered by order-block gaps (smart money imbalances) in volatility expansion phases.
• Trades only when both direction and volatility align to ensure precision entries.
Exit Logic
• ATR Stop and Trail dynamically manage open trades.
• SuperTrend Flip forces exit on trend reversal.
• Volume Exit triggers when volume momentum drops or opposite spike occurs.
• Optional session close exit to flatten trades outside hours.
• Logic prevents premature exits with “Hold Bars” delay after entry.
Why You Need TitanEdge Algo Suite
• Trades only during high-volatility, strong-momentum phases — no false breakouts or choppy trades.
• ATR risk control automatically adjusts to each market’s volatility conditions.
• Identifies institutional order-blocks and clean breakouts for precise entries.
• SuperTrend filter adds directional bias, boosting win-rate consistency.
• Volume exit logic ensures profits are protected when market momentum fades.
• Works 24/7 across all major crypto pairs — fully automated and customizable.
• Built for 4H swing trades — fewer but higher-quality setups.
• Fully compatible with TradingView alerts and bot integration for hands-free execution.
How TitanEdge Makes Profit
• TitanEdge only trades during volatility expansion, when breakout continuation probability is statistically high.
• ATR dynamic stops prevent large losses by scaling protection according to real volatility.
• Trend filtering keeps positions aligned with major market flows.
• Order-block detection ensures entries are based on price structure rather than random signals.
• Volume-based exits secure profits early when momentum weakens.
• SmartMoney Preset provides optimal balance between trade frequency, accuracy, and drawdown control.
• The system compounds edge by maintaining trade discipline — fewer but stronger trades over time.
Delta Exchange Integration (TradingView Bot Ready)
TitanEdge is fully compatible with TradingView alert webhooks and can connect to Delta Exchange or any bot-supported broker.
Alert JSON message format:
{"symbol":"{{ticker}}","side":"{{strategy.order.action}}","qty":1,"trigger_time":"{{timenow}}","strategy_id":"code"}
qty 1 represent 1 lot so if you want to take trade with 5 lots or 0.05eth and write
{"symbol":"{{ticker}}","side":"{{strategy.order.action}}","qty":5,"trigger_time":"{{timenow}}","strategy_id":"code"}
Steps to automate:
Create an alert on TradingView using “Once Per Bar Close”.
Paste your bot or automation webhook URL.
Paste the JSON above as the message.
Configure your bot or API bridge (like PineConnector, AutoView, or WunderTrading) to route signals to Delta Exchange.
On Delta, use BTCUSD or ETHUSD Perpetual pairs with moderate leverage (3x–5x).
Enable Cross Margin for smooth drawdown handling.
Test first on Delta Testnet for safety.
Why 4H BTC & ETH Works Best
• 4H candles capture true volatility swings and filter lower-timeframe noise.
• Aligns with institutional liquidity cycles in BTC and ETH.
• ATR and volume-based stops perform optimally on larger bars.
• Smoother equity curve and less drawdown compared to intraday trading.
• Ideal for traders seeking structured, medium-term trades with high reward-to-risk.
Unique Edge
• Combines breakout, order-block, and volatility principles into one adaptive model.
• Incorporates volatility normalization (ATR/BBWidth) for multi-market adaptability.
• Dynamic ATR stops and trailing protect capital during unstable phases.
• Volume and trend exits create layered protection systems.
• 4H optimization eliminates noise and provides clear institutional alignment.
• SmartMoney preset auto-configures settings to mimic large-player behavior.
• Fully automated via webhooks — no manual execution required.
• Modular design lets you customize each component for different trading styles.
TradingView Bot Integration
TitanEdge is fully plug-and-play with all TradingView-compatible bots.
Each alert sends structured JSON data containing direction, symbol, and quantity, ready for execution on your connected broker.
You can route the data to:
• PineConnector (MT4/MT5 bridge)
• WunderTrading
• AutoView
• Custom Node/REST API handler
This makes TitanEdge a professional-grade strategy suitable for semi-automatic or fully automated crypto trading setups.
Professional Recommendations
• Timeframe: 4H
• Instruments: BTCUSDT, ETHUSDT
• Exchange: Delta Exchange (Perpetual Futures)
• Leverage: 3x–5x
• Session Filter: Off (crypto 24/7)
• Risk per trade: 0.5%–1% of total equity
• Alert Type: Once Per Bar Close
• Volatility Filter: 25–35 depending on market activity
• Always use realistic slippage and fees for backtests.
Summary
TitanEdge Algo Suite is a complete trading framework built to deliver institutional-quality precision with full automation support.
It captures powerful volatility expansions on 4H BTC and ETH charts using clean structure, adaptive stops, and directional trend filters.
Every feature — from entry logic to exits — is designed to protect capital and amplify performance through disciplined, volatility-aware execution.
TitanEdge is not just another script — it’s a professional-grade algorithm that combines volatility intelligence, structural precision, and adaptive risk control.
TitanEdge Algo Suite = Smart Logic × Trend Discipline × Adaptive Risk Control
Optimized for BTC & ETH on 4H charts. Built for traders who demand precision, control, and consistency.

Dynamic Momentum Scalper | Gold & Volatility Strategy V1.0This is a high-frequency trading strategy optimized for volatile instruments, specifically XAUUSD (Gold). It utilizes a proprietary blend of momentum, volume, and volatility metrics to identify minor market reversal points and trend exhaustion.
The system employs a sophisticated, dynamic stop-loss mechanism based on Average True Range (ATR) to adjust risk automatically to current market conditions. It manages trades via a two-tiered Take-Profit system to secure partial profits quickly and let the remaining position run to a secondary target, effectively locking in gains and achieving an optimal risk-reward balance.
Best suited for the 1-Minute (M1) timeframe.
Visibility: Invite-Only Script.

BB SPY Mean Reversion Investment StrategySummary
Mean reversion first, continuation second. This strategy targets equities and ETFs on daily timeframes. It waits for price to revert from a Bollinger location with candle and EMA agreement, then manages risk with ATR based exits. Uniqueness comes from two elements working together. One, an adaptive band multiplier driven by volatility of volatility that expands or contracts the envelope as conditions change. Two, a bias memory that re arms the same direction after any stop, target, or time exit until a true opposite signal appears. Add it to a clean chart, use the markers and levels, and select on bar close for conservative alerts. Shapes can move while the bar is open and settle on close.
Scope and intent
• Markets. Currently adapted for SPY, needs to be optimized for other assets
• Timeframes. Daily primary. Other frames are possible but not the default
• Default demo. SPY on daily
• Purpose. Trade mean reversion entries that can chain into a longer swing by splitting holds into ATR or time segments
Originality and usefulness
• Novelty. Adaptive band width from volatility of volatility plus a persistent bias array that keeps the original direction alive across sequential entries until an opposite setup is confirmed
• Failure modes mitigated. False starts in chop are reduced by candle color and EMA location. Missed continuation after a take profit or stop is addressed by the re arm engine. Oversized envelopes during quiet regimes are avoided by the adaptive multiplier
• Testability. Every module has Inputs and visible levels so users can see why a suggestion appears
• Portable yardstick. All risk and targets are expressed in ATR units
Method overview in plain language
The engine measures where price sits relative to Bollinger bands, confirms with candle color and EMA location, requires ADX for shorts(in our case long close since we use it currently as long only), and optionally requires a trend or mean reversion regime using band width percent rank and basis slope. Risk uses ATR for stop, target, and optional breakeven. A small array stores the last confirmed direction. While flat, the engine keeps a pending order in that direction. The array flips only when a true opposite setup appears.
Base measures
• Range basis. True Range smoothed over a user defined ATR Length
• Return basis. Not required
Components
• Bollinger envelope. SMA length and standard deviation multiplier. Entry is based on cross of close through the band with location bias
• Candle and EMA filter. Close relative to open and close relative to EMA align direction
• ADX gate for shorts. Requires minimum trend strength for short trades
• Adaptive multiplier. Band width scales using volatility of volatility so envelopes breathe with conditions
• Regime gate optional. Band width percent rank and basis slope identify trend or mean reversion regimes
• Risk manager. ATR stop, ATR target, optional breakeven, optional time exit
• Bias memory. Array stores last confirmed direction and re arms entries while flat
Fusion rule
Minimum satisfied gates count style. All required gates must be true. Optional gates are controlled in Inputs. Bias memory never overrides an opposite confirmed setup.
Signal rule
• Long setup when close crosses up through the lower band, the bar closes green, and close is above the long EMA
• Short setup when close crosses down through the upper band, the bar closes red, close is below the short EMA, and ADX is above the minimum
• While flat the model keeps a pending order in the stored direction until a true opposite setup appears
• IN LONG or IN SHORT describes states between entry and exit
What you will see on the chart
• Markers for Long and Short setups
• Exit markers from ATR or time rules
• Reference levels for entry, stop, and target
• Bollinger bands and optional adaptive bands
Inputs with guidance
Setup
• Signal timeframe. Uses the chart timeframe
• Invert direction optional. Flips long and short
Logic
• BB Length. Typical 10 to 50. Higher smooths more
• BB Mult. Typical 1.0 to 2.5. Higher widens entries
• EMA Length long. Typical 10 to 50
• EMA Length short. Typical 5 to 30
• ADX Minimum for short. Typical 15 to 35
Filters
• Regime Type. none or trend or mean reversion
• Rank Lookback. Typical 100 to 300
• Basis Slope Length and Threshold. Larger values reduce false trends
Risk
• ATR Length. Typical 10 to 21
• ATR Stop Mult. Typical 1.0 to 3.0
• ATR Take Profit Mult. Typical 2.0 to 5.0
• Breakeven Trigger R. Move stop to entry after the chosen multiple
• Time Exit. Minimum bars and extension when profit exceeds a fraction of ATR
Bias and rearm
• Bias flips kept. Array depth
• Keep rearm when flat. Maintain a pending order while flat
UI
• Show markers and levels. Clean defaults
Usage recipes
Alerts update in real time and can change while the bar forms. Select on bar close for conservative workflows.
Properties visible in this publication
• Initial capital 25000
• Base currency USD
• If any higher timeframe calls are enabled, request.security uses lookahead off
• Commission 0.03 percent
• Slippage 3 ticks
• Default order size method Percent of equity with value 5
• Pyramiding 0
• Process orders on close On
• Bar magnifier Off
• Recalculate after order is filled Off
• Calc on every tick Off
Realism and responsible publication
No performance claims. Costs and fills vary by venue. Shapes can move intrabar and settle on close. Strategies use standard candles only.
Honest limitations and failure modes
High impact releases and thin liquidity can break assumptions. Gap heavy symbols may require larger ATR. Very quiet regimes can reduce contrast in the mean reversion signal. If stop and target can both be touched inside one bar, outcome follows the TradingView order model for that bar path.
Regimes with extreme one sided trend and very low volatility can reduce mean reversion edges. Results vary by symbol and venue. Past results never guarantee future outcomes.
Open source reuse and credits
None.
Backtest realism
Costs are realistic for liquid equities. Sizing does not exceed five percent per trade by default. Any departure should be justified by the user.
If you got any questions please le me know

Super Frog Power - Cluster Flip %Super Frog Power - Cluster Flip %
🔄 Trade Smarter, Not Harder: Let the Cluster Decide
Welcome to the "Super Frog Power - Cluster Flip %" strategy, a sophisticated multi-system confluence engine designed to filter out market noise and pinpoint high-probability trade setups. This isn't just another indicator; it's a comprehensive trading system that aggregates signals from eight distinct technical methodologies, waiting for them to align into a powerful "cluster" before you enter a trade.
🎯 Core Philosophy: The Power of Confluence
A single indicator can give false signals. A cluster of indicators from uncorrelated systems agreeing on a direction is a much stronger signal. This strategy continuously monitors multiple independent systems and only executes a trade when a significant number of them flip to a consensus, dramatically increasing the likelihood of a successful move.
✨ The 8 Systems of Super Frog Power
This strategy synthesizes signals from the following powerful components:
Bollinger Bands®: Identifies overbought and oversold conditions relative to recent volatility.
CMI (Cluster Momentum Index) System: A unique multi-period momentum oscillator that identifies convergence and breakout moments with custom "Lion" (SELL) and "Car" (BUY) signals.
SMI (Stochastic Momentum Index) System: A refined momentum indicator that generates "Mouse" (BUY) signals and combines with CMI for "Green Angel" and "Red Devil" super signals.
Lucky Balls (NVI/PVI): Utilizes Negative and Positive Volume Index to gauge smart money flow and identify accumulation/distribution zones.
Momentum System: A triple-threat combo of RSI, CCI, and PPO, scaled and combined to generate robust momentum-based entries and exits.
Lucky Table (Oscillator Overload): Counts the number of key oscillators (SMI, RSI, CCI) in overbought or oversold territory, triggering a signal when a threshold is met.
Apples & Pairs System: A complex system analyzing price swings, accumulation, mass index, and doji patterns with fun, emoji-based signals like "Apple Cross Up" 🍎 and "Pig Cross Down" 🐖.
ZBT (Zonal Breakout Trend) System: A multi-timeframe trend-following system using dynamic EMA channels and an ATR-based trailing stop to identify the primary trend and robust breakout points.
⚙️ How It Works: The Cluster Flip Logic
The magic happens in the signal aggregation. The strategy counts every single BUY and SELL signal from all active systems.
A "Strong Buy" is triggered when 6 or more independent BUY signals occur simultaneously.
A "Strong Sell" is triggered when 5 or more independent SELL signals occur simultaneously.
This "cluster flip" mechanism ensures you are only trading when there is broad-based technical agreement, keeping you out of choppy and uncertain market conditions.
🛡️ Integrated Risk Management
We believe a strategy is nothing without proper risk management. This system comes with built-in, percentage-based order management:
User-Defined Profit Target (%): Lock in profits automatically at your specified percentage gain.
User-Defined Stop Loss (%): Protect your capital with a hard stop loss.
Position Sizing: Control your risk per trade with a customizable position size.
Trades are also managed logically: a new strong signal in the opposite direction will automatically close any existing position, ensuring you're always on the right side of the cluster's consensus.
🎨 Visual Features & Customization
Fully Customizable: Don't like one system? Turn it off! Every system can be toggled on/off from the inputs.
Clear Visuals: Each system is plotted in a distinct color, making the chart a rich source of information without being cluttered.
Signal Markers: Strong Buy and Strong Sell clusters are clearly marked with large circles below and above the bars.
Alert Ready: Built-in alerts for Strong Buy and Strong Sell signals so you never miss a cluster setup.
🚀 How to Use
Add the script to your chart (1H, 4H, or Daily timeframes are recommended for swing trading).
Adjust the inputs to your liking, especially the Profit Target %, Stop Loss %, and Position Size under the "Strategy Parameters" section.
Observe the clusters. Wait for the "Strong Buy" or "Strong Sell" circle to appear.
Enter the trade. The strategy will automatically plot the profit target and stop loss levels on the chart for your reference.
Manage your trade. Let the logic handle the exits, or use your own discretion.
💡 Ideal For
Swing Traders looking for high-confidence set-and-forget setups.
Technical Analysts who appreciate the depth of multi-system confluence.
Traders who want to avoid the paralysis of analyzing too many indicators separately.
Unleash the power of cluster trading. Add the "Super Frog Power - Cluster Flip %" to your chart today!

INTRA DAY BEAST The Intraday Beast doesn’t follow trends… it detects them before they roar.
It watches the market’s rhythm, waits in silence, and strikes only when the odds are loaded in its favor.
This isn’t your average flashy indicator — it doesn’t bark at every candle.
When it moves, it means business.
Each signal is a calculated attack — clean, disciplined, and deadly precise.
But listen carefully…
⚠️ The Beast hates boredom.
If your stock has no volume, no volatility, no life — it won’t even wake up.
Feed it only the hottest stocks, the wildest moves, and the loudest markets.
Then, and only then, you’ll see what this creature can do.
💬 Trade smart. Stay patient. Wait for chaos — then let the Beast strike.

tradingview_momentum_Hull-Suite-W-FVSO-NO-WeekendMomentum no weekend trades. It uses FVZO and Hull suite.
This strategy has low win rate but successfully catches trends. Works well on ETH in High Time Frame multi-year.
Sigma Trinity ModelAbstract
Sigma Trinity Model is an educational framework that studies how three layers of market behavior interact within the same trend: (1) structural momentum (Rasta), (2) internal strength (RSI), and (3) continuation/compounding structure (Pyramid). The model deliberately combines bar-close momentum logic with intrabar, wick-aware strength checks to help users see how reversals form, confirm, and extend. It is not a signal service or automation tool; it is a transparent learning instrument for chart study and backtesting.
Why this is not “just a mashup”
Many scripts merge indicators without explaining the purpose. Sigma Trinity is a coordinated, three-engine study designed for a specific learning goal:
Rasta (structure): defines when momentum actually flips using a dual-line EMA vs smoothed EMA. It gives the entry/exit framework on bar close for clean historical study.
RSI (energy): measures internal strength with wick-aware triggers. It uses RSI of LOW (for bottom touches/reclaims) and RSI of HIGH (for top touches/exhaustion) so users can see intrabar strength/weakness that the close can hide.
Pyramid (progression): demonstrates how continuation behaves once momentum and strength align. It shows the logic of adds (compounding) as a didactic layer, also on bar close to keep historical alignment consistent.
These three roles are complementary, not redundant: structure → strength → progression.
Architecture Overview
Execution model
Rasta & Pyramid: bar close only by default (historically stable, easy to audit).
RSI: per tick (realtime) with bar-close backup by default, using RSI of LOW for entries and RSI of HIGH for exits. This makes the module sensitive to intra-bar wicks while still giving a close-based safety net for backtests.
Stops (optional in strategy builds): wick-accurate: trail arms/ratchets on HIGH; stop hit checks with LOW (or Close if selected) with a small undershoot buffer to avoid micro-noise hits.
Visual model
Dual lines (EMA vs smoothed EMA) for Rasta + color fog to see direction and compression/expansion.
Rungs (small vertical lines) drawn between the two Rasta lines to visualize wave spacing and rhythm.
Clean labels for Entry/Exit/Pyramid Add/RSI events. Everything is state-locked to avoid spamming.
Module 1 — Rasta (Structural Momentum Layer)
Goal: Identify structural momentum reversals and maintain a consistent, replayable backbone for study.
Method:
Compute an EMA of a chosen price source (default Close), and a smoothed version (SMA/EMA/RMA/WMA/None selectable).
Flip points occur when the EMA line crosses the smoothed line.
Optional EMA 8/21 trend filter can gate entries (long-bias when EMA8 > EMA21). A small “adaptive on flip” option lets an entry fire when the filter itself flips to ON and the EMA is already above the smoothed line—useful for trend resumption.
Why bar close only?
Bar-close Rasta gives a stable, auditable timeline for the structure of the trend. It teaches users to separate “structure” (close-resolved) from “energy” (intrabar, via RSI).
Visuals:
Fog between the lines (green/red) to show regime.
Rungs between lines to show spread (compression vs expansion).
Optional plotting of EMA8/EMA21 so users can see the gating effect.
Module 2 — RSI (Internal Strength / Energy Layer)
Goal: Reveal the intrabar strength/weakness that often precedes or confirms structural flips.
Method:
Standard RSI with adjustable length and signal smoothing for the panel view.
Logic uses wick-aware sources:
Entry trigger: RSI of LOW (same RSI length) touching or below a lower band (default 15). Think of it as intraband reactivation from the bottom, using the candle’s deepest excursion.
Exit trigger: RSI of HIGH touching or above an upper band (default 85). Think of it as exhaustion at the top, using the candle’s highest excursion.
Realtime + Close Backup: fires intrabar on tick, but if the realtime event was missed, the close backup will note it at bar end.
Cooldown control: optional bars-between-signals to avoid rapid re-triggers on choppy sequences.
Why wick-aware RSI?
A close-only RSI can miss the true micro-extremes that cause reversals. Using LOW/HIGH for triggers captures the behavior that traders actually react to during the bar, while the bar-close backup preserves historical reproducibility.
Module 3 — Pyramid (Continuation / Compounding Layer)
Goal: Teach how continuation behaves once a trend is underway, and how adds can be structured.
Method:
Same dual-line logic as Rasta (EMA vs smoothed EMA), but only fires when already in a position (or after prior entry conditions).
Supports the same EMA 8/21 filter and optional adaptive-on-flip behavior.
Bar close only to maintain historical cohesion.
What it teaches:
Adds tend to cluster when momentum persists.
Students can experiment with add spacing and compare “one-shot entries” vs “laddered adds” during strong regimes.
How the Pieces Work Together
Rasta establishes the structural frame (when the wave flip is real enough to record at close).
RSI validates or challenges that structure by tracking intrabar energy at the extremes (low/high touches).
Pyramid shows what sustained continuation looks like once (1) and (2) align.
This produces a layered view: Structure → Energy → Progression. Users can see when all three line up (strongest phases) and when they diverge (riskier phases or transitions).
How to Use It (Step-by-Step)
Quick Start
Apply script to any symbol/timeframe.
In Strategy/Indicator Properties:
Enable On every tick (recommended).
If available, enable Using bar magnifier and choose a lower resolution (e.g., 1m) to simulate intrabar fills more realistically.
Keep On bar close unchecked if you want to observe realtime logic in live charts (strategies still place orders on close by platform design).
Default behavior: Rasta & Pyramid = bar close; RSI = per tick with close backup.
Reading the Chart
Watch for Rasta Entry/Exit labels: they define clean structural turns on close.
Watch RSI Entry (LOW touch at/below lower band) and RSI Exit (HIGH touch at/above upper band) to gauge internal energy extremes.
Pyramid Add labels reveal continuation phases once a move is already in progress.
Tuning
Rasta smoothing: choose SMA/EMA/RMA/WMA or None. Higher smoothing → later but cleaner flips; lower smoothing → earlier but choppier.
RSI bands: a common educational setting is 15/85 for strong extremes; 20/80 is a bit looser.
Cooldown: increase if you see too many RSI re-fires in chop.
EMA 8/21 filter: toggle ON to study “trend-gated” entries, OFF to study raw momentum flips.
Backtesting Notes (for Strategy Builds)
Stops (optional): trail is armed when price advances by a trigger (default D–F₀), ratchets only upward from HIGH, and hits from LOW (or Close if chosen) with a tiny undershoot buffer to avoid micro-wicks.
Order sequencing per bar (mirrors the script’s code comments):
Trail ratchet via HIGH
Intrabar stop hit via LOW/CLOSE → immediate close
If still in position at bar close: process exits (Rasta/RSI)
If still in position at bar close: process Pyramid Add
If flat at bar close: process entries (Rasta/RSI)
Platform reality: strategies place orders at bar close in historical testing; the intrabar logic improves realism for stops and event marking but final order timestamps are still close-resolved.
Inputs Reference (common)
Modules: enable/disable RSI and Pyramid learning layers.
Rasta: EMA length, smoothing type/length, EMA8/21 filter & adaptive flip, fog opacity, rungs on/off & limit.
RSI: RSI length, signal MA length (panel), Entry band (LOW), Exit band (HIGH), cooldown bars, labels.
Pyramid: EMA length, smoothing, EMA8/21 filter & adaptive adds.
Execution: toggle Bar Close Only for Rasta/Pyramid; toggle Realtime + Close Backup for RSI.
Stops (strategy): Fixed Stop % (first), Fixed Stop % (add), Trail Distance %, Trigger rule (auto D–F₀ or custom), undershoot buffer %, and hit source (LOW/CLOSE).
What to Study With It
Convergence: how often RSI-LOW entry touches precede the next Rasta flip.
Divergence: cases where RSI screams exhaustion (HIGH >= upper band) but Rasta hasn’t flipped yet—often transition zones.
Continuation: how Pyramid adds cluster in strong moves; how spacing changes with smoothing/filter choices.
Regime changes: use EMA8/21 filter toggles to see what happens at macro turns vs chop.
Limitations & Scope
This is a learning tool, not a trade copier. It does not provide financial advice or automated execution.
Intrabar results depend on data granularity; bar magnifier (when available) can help simulate lower-resolution ticks, but true tick-by-tick fills are a platform-level feature and not guaranteed across all symbols.
Suggested Publication Settings (Strategy)
Initial capital: 100
Order size: 100 USD (cash)
Pyramiding: 10
Commission: 0.25%
Slippage: 3 ticks
Recalculate: ✓ On every tick
Fill orders: ✓ Using bar magnifier (choose 1m or similar); leave On bar close unchecked for live viewing.
Educational License
Released under the Michael Culpepper Gratitude License (2025).
Use and modify freely for education and research with attribution. No resale. No promises of profitability. Purpose is understanding, not signals.

PSAR with ATR Trailing Stop + SMA Filter📈 Strategy Overview: PSAR + 6×ATR Trailing Stop with SMA Filter
This strategy is built around the principle of “Cut the losers, let the winners run” — a disciplined, trend-following approach that combines the Parabolic SAR indicator with dynamic risk management and a Simple Moving Average (SMA) trend filter.
🔍 Strategy Logic
Trend Filter Trades are only taken in the direction of the prevailing trend, defined by a user-selected SMA (default: 100).
✅ Long trades only when price is above the SMA
✅ Short trades only when price is below the SMA
Entry Signal: A trade is triggered when the Parabolic SAR flips to the opposite side of the price bars, signaling a potential trend reversal.
Stop Loss: The stop loss is dynamically set at 6×ATR from the entry price. This adapts to market volatility and is recalculated every bar — effectively acting as a trailing stop.
Exit Logic: There is no fixed take profit. The trade remains open until the trailing stop is hit — allowing winners to run and losers to be cut quickly.
Risk Management: Each trade risks 0.5% of total equity, ensuring consistent position sizing and capital preservation.
📊 Visual Elements
PSAR dots mark trend direction changes
SMA line shows the broader trend filter
Trailing stop crosses (with 50% opacity) indicate the current stop level without cluttering the chart
⚙️ Customizable Inputs
PSAR parameters: Start, Increment, Maximum
ATR length and multiplier
SMA length
Risk percentage per trade
This strategy is ideal for traders who want to stay aligned with the trend, automate disciplined exits, and avoid emotional decision-making. Clean, simple, and powerful.
Wishing you calm and successful trades!

coinbot_mr_table이 스크립트는 **"MA 리본(Moving Average Ribbon) 기반 자동매매 전략"**입니다.
이름(coinbot_mr_table)에 모든 기능이 요약되어 있습니다.
coinbot: user_id, exchange, leverage 등 자동매매 봇과 연동하기 위한 웹훅(Webhook) 신호 전송 기능이 포함되어 있습니다.
mr (MA Ribbon): 18개(5~90)의 이동평균선(EMA 또는 SMA)이 100 이평선을 기준으로 정배열/역배열되는지를 색상(LIME/RUBI)으로 구분하여 추세를 판단합니다.
table: 전략의 백테스팅 성과(총 승률, 일일 수익률 등)를 차트 위에 '누적 통계'와 '일일 통계' 테이블로 시각화해 줍니다.
이 스크립트의 매매 로직과 자동매매 신호에 대한 자세한 설명을 한글과 영어로 각각 제공해 드립니다.
🇰🇷 한글 (Korean)
이 스크립트는 **"MA 리본(Moving Average Ribbon)"**을 핵심 엔진으로 사용하는 완전 자동매매(Autotrade) 전략 신호 생성기입니다.
이 지표의 목적은 차트에서 추세를 시각적으로 보여주는 것을 넘어, 구체적인 매매 신호(진입, 분할 익절, 손절)가 발생할 때마다 JSON 형식의 명령어를 자동매매 봇으로 전송하는 것입니다.
1. 📈 매매 전략: MA 리본 추세 추종
이 전략은 18개의 단기/중기 이동평균선(5~90)과 1개의 장기 이동평균선(100)을 사용하여 추세를 정의합니다.
100 이평선: 장기 추세를 가르는 기준선(강/약을 나누는 분수령)입니다.
18개 리본: 이 리본들이 100 이평선 위에서 모두 상승(LIME 색상)하면 '강세 추세', 아래에서 모두 하락(RUBI 색상)하면 '약세 추세'로 판단합니다.
2. 🚦 진입 및 청산 신호
이 전략은 '전환(Reversing)' 전략입니다. 즉, 롱 신호가 발생하면 숏 포지션을 종료하고 롱으로 진입하며, 그 반대도 마찬가지입니다. (항상 롱 또는 숏 포지션을 유지합니다.)
진입 신호 (Long):
추세 확정: 모든 리본이 100 이평선 위에서 '강세(LIME)'로 통일될 때.
재진입 (불타기): 강세 추세 중, 리본이 일시적으로 조정(GREEN)을 보이다가 다시 '강세(LIME)'로 복귀할 때.
진입 신호 (Short):
추세 확정: 모든 리본이 100 이평선 아래에서 '약세(RUBI)'로 통일될 때.
재진입 (물타기): 약세 추세 중, 리본이 일시적으로 반등(MAROON)하다가 다시 '약세(RUBI)'로 복귀할 때.
청산 신호 (자동매매):
진입 (ENTRY): 롱/숏 신호 발생 시, 설정한 user_id, exchange, leverage 등을 포함한 JSON 메시지를 전송합니다.
익절 (TAKE_PROFIT): 롱/숏 포지션이 사용자가 설정한 TP1, TP2, TP3 목표가에 도달하면, 설정된 물량(qty_percent)만큼 분할 익절하라는 JSON 메시지를 전송합니다.
손절 (CLOSE): 포지션이 설정한 sl_percent에 도달하면, 포지션을 즉시 종료하라는 JSON 메시지를 전송합니다.
3. 📊 핵심 기능: 통계 테이블
이 스크립트는 백테스팅 성과를 두 개의 테이블로 요약하여 차트에 실시간으로 표시합니다.
누적 통계 (Total Stats): 전체 기간의 총 진입 횟수, 승/패, 승률(Winrate), 총수익률(Total Profit) 등을 보여줍니다.
일일 통계 (Daily Stats): '오늘' 하루 동안 발생한 매매의 성과(승/패, 승률, 수익률)만 따로 집계하여 보여줍니다.
🇺🇸 영어 (English)
This script is an automated trading (Autotrade) strategy signal generator based on a "Moving Average (MA) Ribbon."
Its purpose extends beyond visual trend analysis; it is designed to generate specific JSON-formatted commands and send them to an automated trading bot whenever a trade signal (entry, take-profit, stop-loss) occurs.
1. 📈 Trading Strategy: MA Ribbon Trend Following
This strategy uses 18 short-to-mid-term Moving Averages (5 to 90) and one long-term Moving Average (100) to define the trend.
100-MA: This acts as the baseline filter, dividing the market into a long-term bull or bear state.
18-MA Ribbon: When all 18 ribbons are above the 100-MA and rising (LIME color), it defines a 'Strong Bull Trend'. When all are below the 100-MA and falling (RUBI color), it defines a 'Strong Bear Trend'.
2. 🚦 Entry and Exit Signals
This is a 'Reversing' strategy. This means when a long signal occurs, it closes any existing short position and enters long, and vice-versa. It is designed to hold a position (either long or short) at all times.
Long Entry Signals:
Trend Confirmation: When all ribbons unify into a 'Strong Bull' (LIME) state above the 100-MA.
Re-entry (Buy the Dip): During a bull trend, if the ribbon shows a temporary pullback (GREEN) and then flips back to 'Strong Bull' (LIME).
Short Entry Signals:
Trend Confirmation: When all ribbons unify into a 'Strong Bear' (RUBI) state below the 100-MA.
Re-entry (Sell the Rally): During a bear trend, if the ribbon shows a temporary rally (MAROON) and then flips back to 'Strong Bear' (RUBI).
Exit Signals (For Automation):
ENTRY: When a long/short signal occurs, it sends a JSON message with the user's user_id, exchange, leverage, etc.
TAKE_PROFIT: When a position reaches the user-defined TP1, TP2, or TP3 price targets, it sends a JSON message to take profit on the specified quantity (qty_percent) for that portion.
CLOSE (Stop-Loss): When a position hits the sl_percent threshold, it sends a JSON message to immediately close the entire position.
3. 📊 Key Feature: Statistics Tables
The script provides two real-time summary tables on the chart to visualize backtesting performance.
Cumulative Stats: Shows lifetime performance, including total trades, wins, losses, win rate, and total profit.
Daily Stats: Isolates and displays the performance metrics (wins, losses, win rate, profit) for "Today's" trading activity only.

Vandan V2Vandan V2 is an automated trading strategy for NQ1! (E-mini Nasdaq-100) based on short-term mean reversion with dynamic risk control. It combines volatility filters and overbought/oversold signals to capture local market imbalances.
Backtested from 2015 to 2025, it achieved a +730% total return, Profit Factor of 1.40, max drawdown of only 1.61%, and over 106,000 trades. Designed for systematic scalping or intraday arbitrage with a limit of 3 simultaneous contracts.

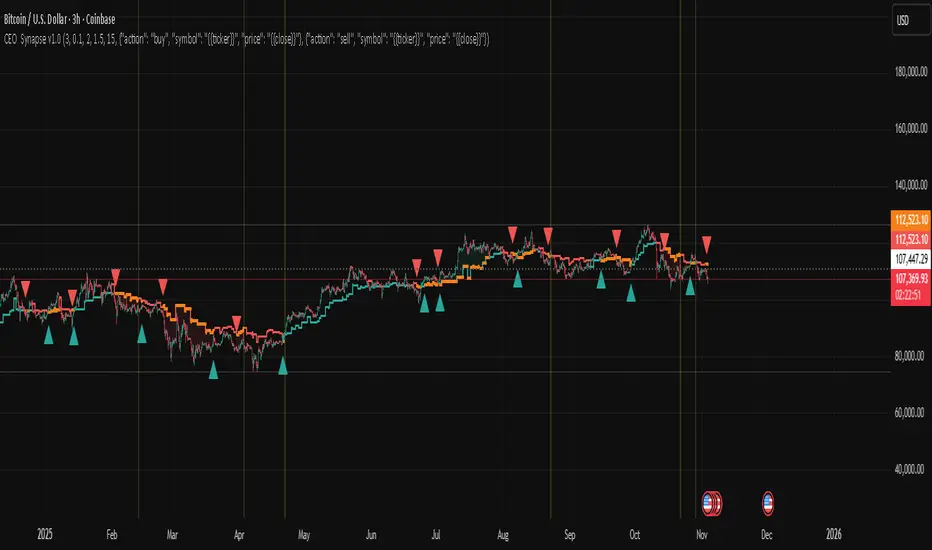
CEO Synapse v1.0CEO Synapse — Uyarlanabilir Rejim Stratejisi
This script is invite-only.
What Does This Strategy Do?
Markets are complex systems requiring various expertise. The "CEO Synapse" strategy adopts a "digital dashboard" approach based on the reality that a single viewpoint is insufficient. The strategy combines multiple analytical engines, each developed by me, analyzing different aspects of the market (structure, momentum, rhythm). It detects trend and momentum deviations in markets. A trading decision is made only when there is consensus among these expert engines. The "Synapse Engine" uses adaptive filtering and consensus logic for position management based on market regime (trend/range).
It eliminates the problem of traditional indicators generating misleading signals alone and failing to adapt to volatility and regime changes. Its dynamic threshold mechanism, adaptive periods, and special noise filters reduce unnecessary trades.
Original Methodology and Proprietary Logic: This algorithm does not rely on or copy any open source strategy code. The system uses commonly accepted indicators' mathematical principles such as ADX, EMA, SMA, ATR, True Range, etc., as data sources. The author's methodology combines dynamic period EMA, multi-filter consensus, adaptive threshold, and regime-based execution.
Though our strategy creates an original decision-making mechanism, it leverages foundational building blocks of technical analysis. The traditional indicators we use and their purposes are:
ADX (Average Directional Index): This indicator measures a trend’s strength, not its direction. Our strategy uses ADX as a filter to open positions only under sufficiently strong and distinct trend market conditions. This largely prevents misleading signals in weak or sideways markets.
Moving Averages (EMA and SMA): They form the backbone to determine the main trend direction. By smoothing price data, they reduce noise and reveal the market's general trend. But our strategy processes their outputs not as traditional crossover signals, but as input to an advanced consensus logic with dynamically adjusted periods based on market rhythm combined with other filters.
ATR (Average True Range): This indicator does not produce direct buy-sell signals but measures current market volatility. Especially in "Sideways Market" regime, take profit and stop loss levels are dynamically set based on ATR instead of fixed values, enabling risk management to adapt to market conditions.
Bollinger Band Logic (using Standard Deviation): Though the strategy does not plot Bollinger Bands directly, it uses Standard Deviation, the underlying mathematical concept, to detect excessive price deviations and volatility spikes, producing critical signals for the AMF PG core engine.
"Synapse Engine" consists of two layers: Decision Center (Dynamic Threshold) which automatically adjusts risk appetite based on performance and regime; and Filter Committee (Consensus Score) which weights separate filters to produce a single score. This combination is not reproducible and commercially valuable. Closed source is mandatory.
No classic open source code used. Only publicly available indicators are used. Parameters, order, and usage are fully customized.
Generated Signals: Trend/range entry/exit (long/short), adaptive trailing stop position management, additional risk control signals with Shock Absorber and Quantum Filter.
Purpose: Detect trend breaks and momentum deviations. Components: Volatility filters, adaptive signal weighting, EMA/SMA. Methodology: Combines price and volume change rates via dynamic weighting functions.
What Problem Does CEO Synapse Solve?
CEO Synapse addresses three main issues caused by traditional technical analysis and single indicator usage:
Problem: Misleading Signals and Market Noise
Traditional indicators (MACD, RSI, etc.) generate many "false" buy-sell signals, especially in sideways and choppy markets, causing traders to constantly enter and exit positions (whipsaw) and incur losses.
CEO Synapse Solution: The strategy never relies on a single signal. The Consensus-Based Decision Mechanism ensures no position is opened unless different analytical engines (structural, momentum, rhythm) agree. This "board of directors" approach filters market noise, processing only high-probability signals.
Problem: Static Analysis and Changing Market Conditions
Markets constantly change character; sometimes strong trend, sometimes narrow range. Most strategies try to function with fixed parameters across all conditions, leading to failure.
CEO Synapse Solution: The strategy has Adaptive Regime Switching. It actively analyzes whether the market is in "Trend Mode" or "Sideways Market Mode" and automatically adjusts entry/exit rules and risk management (take profit/stop loss) to the current regime, allowing chameleon-like adaptation to conditions.
Problem: Fixed Parameters and Declining Performance
Many traders believe they find the "best" settings and never change them for months or years. But as market volatility and cycles change, fixed settings lose effectiveness.
CEO Synapse Solution: The strategy operates on Full Adaptation principle.
Market Rhythm Adaptation: Dynamically adjusts analysis speed (e.g., EMA periods) according to market’s natural cycles.
Performance Adaptation: Continuously optimizes risk appetite (signal threshold) based on recent strategy performance, becoming bolder with gains and more cautious with losses.
In summary, CEO Synapse simplifies decision-making, eliminates market noise, and smartly adapts to changing market conditions, protecting the user from common mistakes.
Why "Invite-Only"?
Offering CEO Synapse as "Invite-Only" is a strategic decision to protect the strategy's commercial value and intellectual property and to provide users with the highest quality experience. Key reasons:
Protection of Proprietary IP:
CEO Synapse is the result of hundreds of hours of research, development, and testing. Its consensus logic, adaptive threshold mechanism, and engine integration are unique and patented. Open sourcing it would instantly destroy this trade secret and competitive edge.
Maintaining Performance Integrity and Effectiveness:
Uncontrolled distribution could lead to misuse or signal theft and sale by malicious actors. The invite-only model preserves the strategy’s integrity and ensures access only for serious investors.
Quality User Experience and Support:
Controlled distribution allows better user experience. High-quality documentation explaining features and best practices can be provided, and future updates and support services can be managed better for a limited user base.
Business Model:
CEO Synapse is positioned as a premium analysis tool. Invite-only access reflects its value and compensates the developer for ongoing maintenance, support, and future improvements.
Usage: Available on all timeframes.
Based entirely on my own adaptive filtering methodology.
Proprietary logic: The algorithm’s unique, non-reproducible logic and methodology. Example: Multi-filter consensus + adaptive threshold + regime-based execution.
Why Is This a Premium Tool?
"CEO Synapse"’s value stems from being a proprietary, integrated system beyond free standard indicators:
Advanced Noise Filtering: Not just reduces noise but adjusts filter sensitivity to current market character. Inspired by public mathematical concepts (cycle analysis, statistical filtering) but uniquely combined with proprietary weighting mechanisms and adaptive consensus logic forming the strategy's commercial value. Core indicators (EMA, ATR, ADX, DMI, etc.) are uniquely processed inside this proprietary system.
Full Adaptation: Instead of fixed parameters, the strategy continuously adapts to the market's natural rhythm, volatility, and past performance.
Consensus-Based Decision Making: Relies on collective intelligence of multiple analytical engines, not a single failure point.
These features substantially increase the ability to extract meaningful, actionable insights from raw market data, making it premium. It improves signal accuracy, reduces risk, and adapts to regime shifts. The dynamic threshold mechanism continuously adjusts risk appetite based on recent performance (profitability) and market regime.
By using this script, you agree not to redistribute, sell, or reverse engineer the source code.
This strategy is for educational purposes only. Past performance does not guarantee future results. Always apply proper risk management and protect your capital.
Risk Management: Maximum Drawdown Protection
The strategy includes a built-in capital protection mechanism. Users can specify the percentage drop from peak capital they tolerate. If the capital hits this drawdown limit, protection activates, closing all open positions and blocking new trades, acting as an emergency brake to guard capital against unexpected market conditions.
Automation Ready: Customizable Webhook Alerts
Fully Compatible Automation (JSON): The strategy outputs fully configurable JSON-formatted alert messages for buy, sell, and close actions. This allows connecting CEO Synapse signals to automation platforms like 3Commas and PineConnector for fully automated trading. Dynamic values like position size ({{strategy.order.contracts}}) are automatically included in alerts.
Strategy Backtest Information
Please remember past performance is not indicative of future results. The published chart and report are based on the BTCUSD pair in a 3-hour timeframe with the following settings:
Test Period: January 1, 2018 – November 3, 2025
Default Position Size: 15% of capital
Pyramiding: Off
Commission: 0.0008
Slippage: 2 ticks
Test Approach: The published test contains 201 trades and is statistically significant. Performing your own tests on different assets and timeframes is strongly recommended. Default settings are a template and should be adjusted per your analysis.
Tristan's Tri-band StrategyTristan's Tri-band Strategy - Confluence Trading System
Strategy Overview:
This strategy combines three powerful technical indicators - RSI, Williams %R, and Bollinger Bands - into a single visual trading system. Instead of cluttering your chart with separate indicator panels, all signals are displayed directly on the price chart using color-coded gradient overlays, making it easy to spot high-probability trade setups at a glance.
How It Works:
The strategy identifies trading opportunities when multiple indicators align (confluence), suggesting strong momentum shifts:
📈 Long Entry Signals:
RSI drops to 30 or below (oversold)
Williams %R reaches -80 to -100 range (oversold)
Price touches or breaks below the lower Bollinger Band
All three conditions must align during your selected trading session
📉 Short Entry Signals:
RSI rises to 70 or above (overbought)
Williams %R reaches 0 to -20 range (overbought)
Price touches or breaks above the upper Bollinger Band
All three conditions must align during your selected trading session
Visual Indicators:
(faint) Green gradients below candles = Bullish oversold conditions (buying opportunity)
(faint) Red/Orange gradients above candles = Bearish overbought conditions (selling opportunity)
Stacked/brighter gradients = Multiple indicators confirming the same signal (higher probability) will stack and show brighter / less faint
Blue Bollinger Bands = Volatility boundaries and mean reversion zones
Exit Strategy:
Long trades exit when price reaches the upper Bollinger Band OR RSI becomes overbought (≥70)
Short trades exit when price reaches the lower Bollinger Band OR RSI becomes oversold (≤30)
Key Features:
✅ Session Filters - Trade only during NY (9:30 AM-4 PM), London (3 AM-11:30 AM), or Asia (7 PM-1 AM EST) sessions
✅ No Repainting - Signals are confirmed on candle close for realistic backtesting and live trading
✅ Customizable Parameters - Adjust RSI levels, BB standard deviations, Williams %R periods, and gradient visibility
✅ Visual Clarity - See all three indicators at once without switching between panels
✅ Built-in Alerts - Get notified when entry and exit conditions are met
How to Use Effectively:
Choose Your Trading Session - For day trading US stocks, enable only the NY session. For forex or 24-hour markets, select the sessions that match your schedule.
Look for Gradient Stacking - The brightest, most visible gradients occur when both RSI and Williams %R signal together. These are your highest-probability setups.
Confirm with Price Action - Wait for the candle to close before entering. The strategy enters on the next bar's open to prevent repainting.
Respect the Bollinger Bands - Entries occur at the outer bands (price extremes), and exits occur at the opposite band or when momentum reverses.
Backtest First - Test the strategy on your preferred instruments and timeframes. Works best on liquid assets with clear trends and mean reversion patterns (stocks, major forex pairs, indices).
Adjust Gradient Visibility - Use the "Gradient Strength" slider (lower = more visible) to make signals stand out on your chart style.
Best Timeframes: 5-minute to 1-hour charts for intraday trading; 4-hour to daily for swing trading (I have also found the 3 hour timeframe to work really well for some stocks / ETFs.)
Best Markets: Liquid instruments with volatility - SPY, QQQ, major stocks, EUR/USD, GBP/USD, major indices
Risk Management: This is a mean reversion strategy that works best in ranging or choppy markets. In strong trends, signals may appear less frequently. Always use proper position sizing and stop losses based on your risk tolerance.
----------------------------------------------
Note: Past performance does not guarantee future results. This strategy is provided for educational purposes. Always backtest thoroughly and practice proper risk management before live trading.RetryClaude can make mistakes. Please double-check responses. Sonnet 4.5

NY VIX Channel Trend US Futures Day Trade StrategyNY VIX Channel Trend Strategy
Summary in one paragraph
Session anchored intraday strategy for index futures such as ES and NQ on one to fifteen minute charts. It acts only after the first configurable window of New York Regular Trading Hours and uses a VIX derived daily implied move to form a realistic channel from the session open. Originality comes from using a pure implied volatility yardstick as portable support and resistance, then committing in the direction of the first window close relative to the open. Add it to a clean chart and trade the simple visuals. For conservative alerts use on bar close.
Scope and intent
• Markets. Index futures ES and NQ
• Timeframes. One to thirty minutes
• Default demo. ES1 on five minutes
• Purpose. Provide a portable intraday yardstick for entries and exits without curve fitting
• Limits. This is a strategy. Orders are simulated on standard candles
Originality and usefulness
• Unique concept. A VIX only channel anchored at 09:30 New York plus a single window trend test
• Addresses. False urgency at session open and unrealistic bands from arbitrary multipliers
• Testability. Every input is visible and the channel is plotted so users can audit behavior
• Portable yardstick. Daily implied move equals VIX percent divided by square root of two hundred fifty two
• Protected status. None. Method and use are fully disclosed
Method overview in plain language
Take the daily VIX or VIX9D value, convert it to a daily fraction by dividing by square root of two hundred fifty two, then anchor a symmetric channel at the New York session open. Observe the first N minutes. If that window closes above the open the bias is long. If it closes below the open the bias is short. One trade per session. Exits occur at the channel boundary or at a bracket based on a user selected VIX factor. Positions are closed a set number of minutes before the session ends.
Base measures
Return basis. The daily implied move unit equals VIX percent divided by square root of two hundred fifty two and serves as the distance unit for targets and stops.
Components
• VIX Channel. Top, mid, bottom lines anchored at 09:30 New York. No extra multipliers
• Window Trend. Close of the first N minutes relative to the session open sets direction
• Risk Bracket. Take profit and stop loss equal to VIX unit times user factor
• Session Window. Uses the exchange time of the chart
Fusion rule
Minimum gates count equals one. The trade only arms after the window has elapsed and a direction exists. One entry per session.
Signal rule
• Long when the window close is above the session open and the window has completed
• Short when the window close is below the session open and the window has completed
• Exit on channel touch. Long exits at the top. Short exits at the bottom
• Flat thirty minutes before the session close or at the user setting
Inputs with guidance
Setup
• Use VIX9D. Width source. Typical true for fast tone or false for baseline
• Use daily OPEN. Toggle for sensitivity to overnight changes
Logic
• Window minutes. Five to one hundred twenty. Larger values delay entries and reduce whipsaw
• VIX factor for TP. Zero point five to two. Raising it widens the profit target
• VIX factor for SL. Zero point five to two. Raising it widens the stop
• Exit minutes before close. Fifteen to ninety. Raising it exits earlier
Properties visible in this publication
• Initial capital one hundred thousand USD
• Base currency USD
• request.security uses lookahead off
• Commission cash per contract two point five $ per each contract. Slippage one tick
• Default order size method FIXED with value one contract. Pyramiding zero. Process orders on close ON. Bar magnifier OFF. Recalculate after order is filled OFF. Calc on every tick ON
Realism and responsible publication
No performance claims. Past results never guarantee future outcomes. Fills and slippage vary by venue. Shapes can move while a bar forms and settle on close. Strategy uses standard candles.
Honest limitations and failure modes
Economic releases and thin liquidity can break the channel. Very quiet regimes can reduce signal contrast. Session windows follow the exchange time of the chart. If both stop and target can be hit within one bar, assume stop first for conservative reading without bar magnifier.
Works best in liquid hours of New York RTH. Very large gaps and surprise news may exceed the implied channel. Always validate on the symbols you trade.
Entries and exits
• Entry logic. After the first window, go long if the window close is above the session open, go short if below
• Exit logic. Long exits at the channel top or at the take profit or stop. Short exits at the channel bottom or at the take profit or stop. Flat before session close by the configured minutes
• Risk model. Initial stop and target based on the VIX unit times user factors. No trail and no break even. No cooldown
• Tie handling. Treat as stop first for conservative interpretation
Position sizing
Fixed size one contract per trade. Target risk per trade should generally remain near one percent of account equity. Risk is based on the daily volatility value, the max loss from the tests for one year duration with 5min chart was 4%, while the avg loss was below <1% of the total capital.
If you have any questions please let me know. Thank you for coming by !

High Accuracy Engulfing Strategy [PIPNEXUS]Title: EMA Engulfing Setup
Description:
This indicator focuses on identifying strong engulfing patterns that form around the EMA line, helping traders catch high-probability moves in line with market direction.
Concept Overview:
The idea is simple — when both the engulfing candle and the candle being engulfed have their bodies touching the EMA line, it often represents a key point of rejection or continuation. These areas can produce clean entries with strong momentum.
How to Use:
1. Wait for a valid engulfing formation near the EMA line.
Both the engulfing and the engulfed candles should have their bodies touching the EMA.
2. Enter in the direction of the engulfing candle once the pattern is confirmed.
3. For pinpoint entries, observe the market during session changes (especially in the first 3–5 minutes after a session opens).
4. For longer and more stable trades, look for the same pattern on 15-minute or 1-hour charts.
5. Always align your trades with the prevailing market structure and avoid counter-trend setups.
Note:
This indicator is designed for technical and educational use. It does not generate buy or sell signals automatically, nor does it guarantee performance. Use it alongside your own market analysis and proper risk management.

KCB Strategy [Ncentry]This strategy is a strong trend breaking strategy based on the Keltner channel.
Optimized for the bitcoin okx exchange chart.
AMF PG Strategy v2.3AMF PG Strategy v2.3
1. Core Philosophy: Filtered and Volatility-Aware Trend Following
"AMF PG Strategy" is an advanced trend-following system designed to adapt to the dynamic nature of modern markets. The strategy's core philosophy is not just to follow the trend but also to wait for the right conditions to enter the market.
This is not a "black box." It is a rules-based framework that gives the user full control over various market filters. By requiring multiple conditions to be met simultaneously, the strategy aims to filter out low-quality signals and focus only on high-probability trend opportunities.
2. Core Engine: AMF PG Trend Following
At the heart of the strategy is a proprietary, volatility-aware trend-following mechanism called AMF PG (Praetorian Guard). This engine operates as follows:
Dynamic Bands: Creates a dynamic upper and lower band around the price that is constantly recalculated. The width of these bands is not fixed; It dynamically adjusts based on recent market volatility, volume flow, and price expansion. This adaptive structure allows the strategy to adapt to both calm and high-volatility markets.
Entry Signals: A buy signal is triggered when the price rises above the upper band. A sell signal is triggered when the price falls below the lower band. However, these signals are executed only when all the active filters described below give the green light.
Trailing Stop-Loss: When a position is entered, the opposite band automatically acts as a trailing stop-loss level. For example, when a buy position is opened, the lower band follows the price as a stop-loss. This allows for profit retention and trend continuation.
3. Multi-Layered Filter System: Understanding the Market
The power of this strategy comes from its modular filter system, which allows the user to filter market conditions based on their own analysis. Each filter can be enabled or disabled individually in the settings:
Filter 1: Trend Strength (ADX Filter): This filter confirms whether there is a strong trend in the market. It uses the ADX (Average Directional Index) indicator and only allows trades if the ADX value is above a certain threshold. This helps avoid trading in weak or directionless markets. It also confirms the direction of the trend by checking the position of the DMI (+DI and -DI) lines.
Filter 2: Sideways Market (Chop Index Filter): This filter determines whether the market is excessively choppy or directionless. Using the Chop Index, this filter aims to protect against fakeouts by blocking trades when the market is highly indecisive.
Filter 3: Market Structure (Hurst Exponent Filter): This is one of the strategy's most advanced filters. It analyzes the current market behavior using the Hurst Exponent. This mathematical tool attempts to determine whether a market tends to trend (permanent), tends to revert to the mean (anti-permanent), or moves randomly. This filter ensures that signals are generated only when market structure supports trending trades.
4. Risk Management: Maximum Drawdown Protection
This strategy includes a built-in capital protection mechanism. Users can specify the percentage of their capital they will tolerate to decline from its peak. If the strategy's capital reaches this set drawdown limit, the protection feature is activated, closing all open positions and preventing new trades from being opened. This acts as an emergency brake to protect capital against unexpected market conditions.
5. Automation Ready: Customizable Webhook Alerts
The strategy is designed for traders who want to automate their signals. From the Settings menu, you can configure custom alert messages in JSON format, compatible with third-party automation services (via Webhooks).
6. Strategy Backtest Information
Please note that past performance is not indicative of future results. The published chart and performance report were generated on the 4-hour timeframe of the BTCUSD pair with the following settings:
Test Period: January 1, 2016 - October 31, 2025
Default Position Size: 15% of Capital
Pyramiding: Closed
Commission: 0.0008
Slippage: 2 ticks (Please enter the slippage you used in your own tests)
Testing Approach: The published test includes 423 trades and is statistically significant. It is strongly recommended that you test on different assets and timeframes for your own analysis. The default settings are a template and should be adjusted by the user for their own analysis.


Vandan V2Vandan V2 is an automated trend-following strategy for NASDAQ E-mini Futures (NQ1!).
It uses multi-timeframe momentum and volatility filters to identify high-probability entries.
Includes dynamic risk management and trailing logic optimized for intraday trading.

BH BTC LS Atopetrader Bitcoin 15M Advanced Trading Strategy
This strategy is designed to trade Bitcoin on the 15-minute timeframe for long and short positions. It uses an advanced system adapted to price action, combined with automated risk management through stop loss and take profit. It is optimized to adapt to the high volatility and speculative nature of BTC, seeking out trend-driven momentum opportunities and avoiding low-probability periods detected through historical analysis.
Timeframe Compatibility
While the strategy is specifically adapted and optimized for the 15-minute timeframe (15M), it has been engineered to perform across multiple timeframes ranging from 5-minute to 4-hour intervals. This multi-timeframe versatility allows traders to adjust the strategy parameters according to their preferred trading style and market conditions.
This adaptability across different timeframes significantly enhances the strategy's robustness, making it more resilient to varying market regimes and reducing over-optimization to a single timeframe. By testing and validating across 5-minute to 4-hour intervals, the strategy demonstrates consistent edge across diverse trading environments, which strengthens confidence in its performance across broader market conditions.
Cross-Asset Testing
Beyond Bitcoin, this strategy could be tested and adapted for trading other cryptocurrencies, making it a flexible framework for exploring momentum-based opportunities across different digital assets with varying volatility profiles.
Performance Summary
This strategy has significantly outperformed a simple buy-and-hold approach over the 6-year backtest period. Here are the standout metrics:
Total P&L: +$41,277.80 USDT (+2,063.89%)
Net Profit: +$41,277.80 USDT with only 18.35% max drawdown
Total Trades: 2,169 with 44.63% win rate
Profit Factor: 2.17x (strong edge)
Key Advantage Over Buy & Hold
The Buy & Hold return was +$16,576.63 USDT (+828.83%), meaning this strategy more than doubled Buy & Hold returns over the same period. The active trading approach consistently captured momentum while the 2.17x profit factor demonstrates edge-based entries.
Commission Structure: A 0.1% commission per trade has been factored into the backtesting analysis, which is more than sufficient to cover typical exchange trading fees on major platforms. This conservative fee structure ensures the reported results account for real-world trading costs while still demonstrating substantial profitability.
Important Disclaimer
This strategy does not guarantee future profits and should be used after testing and analyzing in a simulated environment. A disciplined approach and appropriate risk management are recommended for the cryptocurrency market. Past performance is not indicative of future results, and actual trading may differ from backtested scenarios due to market slippage, liquidity conditions, and changing market dynamics.
