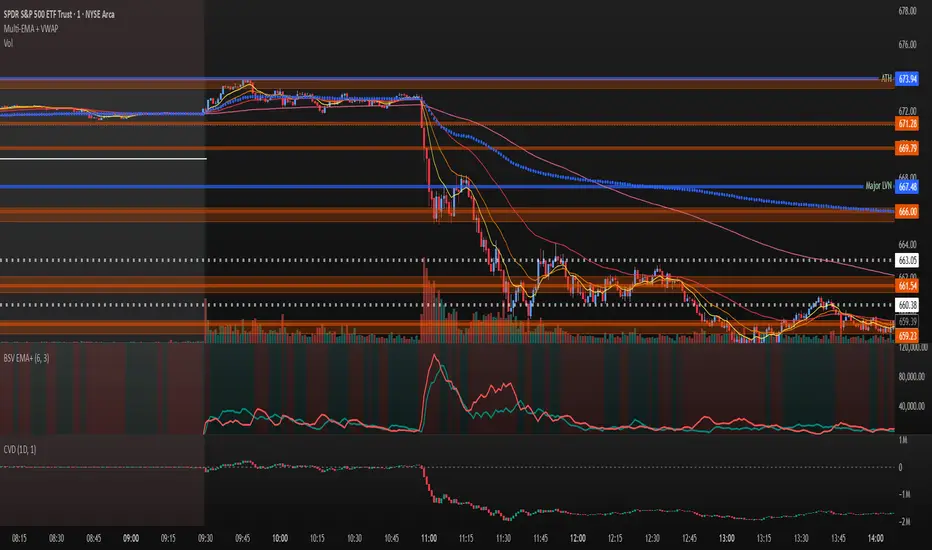
Volume Exponential Moving Averages (EMA)
Description:
This script is a simple script that plots a desired exponential moving average of buy and sell volume as a line chart with a tunable smoothing factor. There is a highlight on the plot area of either green or red to denote if the EMA of buy volume or sell volume is of a higher value. This indicator uses basic math of exponential averages and calculates volume using the formulas: "buy volume" = the product of total volume and the "closing price" minus the "low price" divided by "high price" minus the "low price" for a specific candle. Conversely, "sell volume" = the product of "total volume" and the "high price" minus the "close price" divided by "high price" minus the "low price" for a specific candle.
Utility:
This indicator is an effective way to gauge the acceleration/ deceleration of buyers and sellers in the market and can be used in combination with market structure and important levels to understand if buyers or sellers are taking over at any given time.
How to use this indicator:
There are two settings for this indicator:
1. The Length of the EMA: The length of the EMA can be adjusted based on your preference for a running number of candles' data. If you are interested to know short term changes in volume (e.g. over the past few candles at a major level) you can adjust this setting lower (~3-9 length). Conversely, if you are interested in volume trends over a greater number of candles you can increase this to your liking.
Personal preference : Because I am a short term daytrader/ scalper, I keep this setting at 6 length to see immediate changes in the acceleration or deceleration of buyers/ sellers.
2. The Smoothing Factor: The smoothing factor can be adjusted to further tune the size of trend you are interested in with 1 = No smoothing of the EMA line. Smoothing of the EMA line increases as the value for smoothing increases, resulting in a less volatile, more smooth EMA line. However, the more smooth the line, the less sensitive the EMA will be to immediate changes in volume pace. The less smoothing factor is applied, the more volatile data will be, resulting in quicker observation of shorter term trends. Again the same rules apply as the EMA length as these are similar in function: If you are interested to know short term changes in volume (e.g. over the past few candles at a major level) you can adjust this setting lower (~2-6). Conversely, if you are interested in volume trends over a greater number of candles you can increase this to your liking.
Personal preference : Because I am a short term daytrader/ scalper, I keep this setting at 2-4 smoothing factor to see immediate changes in the acceleration or deceleration of buyers/ sellers.
You should, of course, play with these settings to your exact preferences based on your trading style.
Tips for using this indicator:
General Use:
When the buy volume EMA is moving up, buyers are increasing the pace of buying and when the buy volume EMA is moving down, buyers are decreasing the pace of buying. Conversely, when the sell volume EMA is moving up, sellers are increasing the pace of selling and when the sell volume EMA is moving down, sellers are decreasing the pace of selling. The overall movement of the stock is relative to the combination of these rates. e.g. If both buyers and sellers are increasing at the same rate (EMAs slopes are roughly equal) there will be not a large change in price. If the slope of the buy volume EMA is greater than the slope of sell volume EMA, the price should move up. Conversely, if the slope of the sell volume EMA is greater than the slope of buy volume EMA, the price should move down.
Predicting pullbacks, reversals, and continuations:
This indicator allows you to see if buyers or sellers are increasing their pace, even if the stock price is in consolidation. This allows you to predict if out of the consolidation buyers or sellers are likely to win based on the momentum of the volume in consolidation. e.g. If price is in consolidation after an uptrend and the buy volume EMA starts to decrease, this could be a sign that buyers are running out of steam at this price level. Another example, If at a major support the buy volume EMA begins to trend up then buyers are accelerating the pace of buying at this level.
EMA crosses: There is something to be said about the point at which the buy volume EMA and sell volume EMA cross. This signifies that at this moment there is a shift in which the acceleration of one party outpaces that of the other and can result in increased speed of the movement of the stock price.
Considerations
Because volume changes constantly, this indicator is best to identify short term changes in volume that could impact price movements. It is not guaranteed to continue just because buyers or sellers have had a change in pace. Therefore it is advised to use this indicator in combination with significant price levels such as pivot points, or price levels from volume profile tools to identify the price zones where significant volume changes are likely to impact price movements. It is also advised to continue to monitor the changes in pace in buyers and sellers using this volume EMA indicator to determine if a change in pace is short lived or if it will continue for a longer duration.
Examples of use:
Bullish Reversal:
Bearish Continuation:
Bearish EMA Crossover: (Settings: Length 6, Smoothing factor 3)
Bullish EMA Crossover: (Settings: Length 6, Smoothing factor 4)
Penunjuk Volum
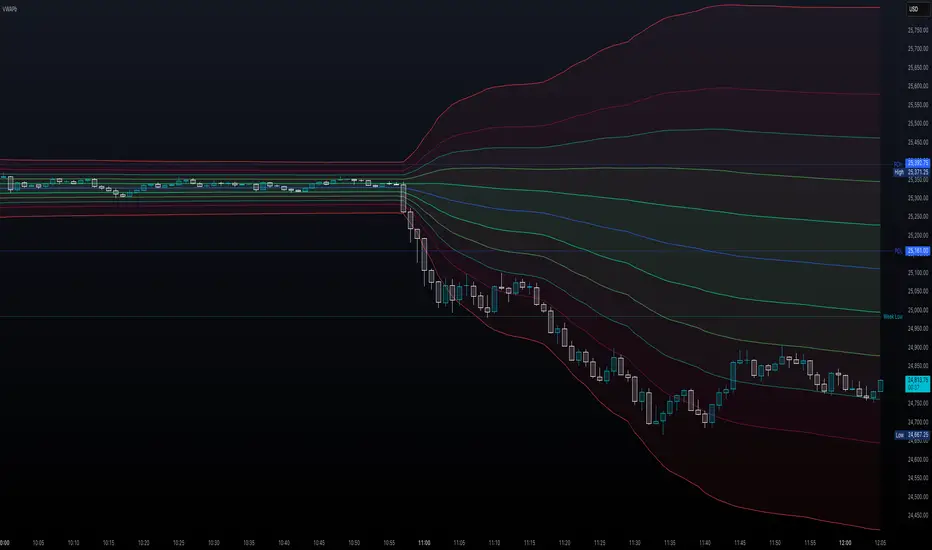
Volume Weighted Average Price Band Extension## Volume Weighted Average Price Band Extension (VWAPb)
**Volume Weighted Average Price Band Extension** is an enhanced VWAP indicator that extends the traditional three-band system to include up to **five configurable standard deviation bands**, making it particularly well-suited for analyzing volatile market conditions where price action frequently extends beyond conventional boundaries.
### Key Features
**Extended Band System**
Unlike standard VWAP indicators that typically offer three bands, this indicator provides five independently configurable bands with customizable multipliers (default: 0.5x, 1.0x, 1.5x, 2.0x, and 3.0x). Each band can be toggled on or off, allowing traders to adapt the display to current market volatility and their specific trading strategy.
**Dual Calculation Modes**
The indicator offers flexibility in how bands are calculated:
- **Standard Deviation Mode**: Traditional statistical approach measuring price dispersion from the VWAP
- **Percentage Mode**: Distance calculated as a percentage of VWAP (1 multiplier = 1%), useful for comparing relative moves across different price levels
**Flexible Anchor Periods**
Calculate VWAP from multiple timeframes and events:
- Time-based: Session, Week, Month, Quarter, Year, Decade, Century
- Event-based: Earnings reports, Dividend announcements, Stock splits
- Customizable source (default: hlc3)
**Visual Clarity**
Color-coded bands with semi-transparent fills between upper and lower boundaries help identify key support and resistance zones at a glance. The indicator automatically hides on daily and higher timeframes when enabled, keeping charts clean.
### Ideal For
- **Volatile Markets**: The extended band system captures extreme price movements that often exceed traditional 2-3 standard deviation bounds
- **Scalping & Day Trading**: Multiple bands provide granular entry and exit zones for short-term trades
- **Mean Reversion Strategies**: Identify overextended price action relative to volume-weighted fair value
- **Institutional Order Flow Analysis**: VWAP remains a key benchmark for institutional execution
### How It Works
The Volume Weighted Average Price represents the average price weighted by volume throughout the selected anchor period. The surrounding bands act as dynamic support and resistance levels, with each successive band representing areas of increasing deviation from the volume-weighted mean. In volatile conditions, price may regularly test the outer bands (2.0x, 3.0x), which would be invisible on standard three-band implementations.
**Trading Applications:**
- Price near outer bands (±2.0x, ±3.0x) may signal exhaustion and potential reversal opportunities
- Price oscillating between inner bands (±0.5x, ±1.0x) indicates consolidation
- VWAP itself acts as a dynamic pivot point—bullish above, bearish below
### Settings Overview
- **VWAP Settings**: Anchor period selection, source input, offset capability, option to hide on D/W/M timeframes
- **Bands Settings**: Toggle each of the five bands independently, adjust multipliers, choose between Standard Deviation or Percentage calculation mode
---
**Note**: This indicator requires volume data to function properly. A runtime error will display if volume data is unavailable for the selected symbol.
**Disclaimer**: This indicator is designed for technical analysis and should be used in conjunction with other forms of analysis and proper risk management. Past performance and indicator signals do not guarantee future results.
Cumulative Volume DeltaCumulative Volume Delta (CVD) Indicator
This indicator is a modification of the Trading View CVD indicator. Cumulative Volume Delta (CVD), which represents the net difference between up volume (volume traded as the price increases) and down volume (volume traded as the price decreases) over a chosen Anchor Period.
The data for the CVD calculation is requested using the built-in ta.requestVolumeDelta function from a lower timeframe to approximate the directional volume with greater precision. This lower timeframe is either automatically selected based on the chart's timeframe or can be customized by the user.
Key Features and Inputs
Anchor Period: Defines the period over which the volume delta is accumulated and plotted. The default is "1D" (Daily), but it can be changed to any higher timeframe (e.g., "1W" for Weekly) to analyze CVD across different cycles.
CVD Candle Plot: The calculated volume delta values are plotted as a custom candle, where:
The open and close of the CVD candle represent the volume delta at the start and end of the anchor period, respectively.
The high and low represent the maximum and minimum volume delta reached during that period.
Up/Down Coloring Logic: The color of the CVD candle is determined by the directional movement of the price during the anchor period, allowing traders to quickly correlate volume delta with price action. Users can select between two methods via the "Strong Up/Down Coloring" input:
Strong Up/Down (Default): The candle is colored bullish (Teal) if the current price closes above the previous bar's high or bearish (Red) if it closes below the previous bar's low. This logic highlights significant momentum.
Regular Up/Down: The candle is colored bullish (Teal) if the close is greater than the open (price moved up) or bearish (Red) if the close is less than the open (price moved down).
Lower Timeframe Selection: This determines the resolution of the up and down volume components.
By default, the script automatically selects an appropriate lower timeframe (e.g., "1" minute for intraday charts, "5" minutes for daily charts) to balance historical data availability with calculation precision.
An option is provided to customize this "Lower Timeframe" for advanced users seeking higher or lower resolution.
The CVD indicator is a powerful tool for analyzing order flow dynamics and assessing the genuine strength of price movements by comparing the aggregate buying pressure (up volume) against the selling pressure (down volume).
Technical Notes (Code Details)
Language: Pine Script® //@version=6.
Function: Utilizes the ta.requestVolumeDelta() function with a user-defined anchorInput (default "1D") and a determined lowerTimeframe to retrieve the relevant delta data: .
Error Handling: Includes a check to confirm the symbol provides volume data, preventing runtime errors.

Magic Volume - Projected [MW]Magic Volume – Projected
This lower-pane volume tool estimates the full-bar volume before the bar closes by measuring the current bar’s elapsed time and the rate of incoming volume. It then contrasts that “expected volume” against typical activity and recent momentum to spotlight potential burst conditions (breakout/acceleration), color-codes the live volume stream, and annotates when the projected surge is likely bullish or bearish based on bar structure and recent highs/lows.
Settings
Projected / Expected Volume
Moving Average: EMA length used for volume baseline comparisons. (Default: 14)
Minimum Volume: Hard floor the bar’s raw volume must exceed to qualify as notable. (Default: 10,000)
Consecutive Volume Above 14 EMA: Count required for “sustained” high-volume context. (Default: 3)
Stochastic Volume Burst
Stochastic Length: Window for the Stochastic calculation on volume. (Default: 8)
Smoothing: Smoothing applied to Stochastic volume and its signal. (Default: 3)
Stochastic Volume Breakout Threshold: Level above which Stochastic volume is considered a breakout. (Default: 20)
Volume Bar Increase Amount: Multiplier the current bar’s volume must exceed vs. prior bar to be considered a “burst.” (Default: 1.618)
Plotted Items
Expected Volume (columns): Magenta columns projecting the full-bar volume from intrabar rate. Turns lime when a high expected-volume condition aligns with bullish bar structure; turns red under analogous bearish conditions.
Actual Volume (columns): Live volume columns, color-coded by state:
• Blue = baseline;
• Orange = “burst” (volume rising fast above prior × factor and above baseline);
• Yellow = “burst at breakout” (burst + Stochastic volume breakout);
• Light Blue = Stochastic breakout only.
Volume EMA (line): Yellow EMA for baseline comparison (default 14).
Calculations
Compute elapsed time in the current bar (ms → seconds) and convert the current bar’s accumulated volume into a rate (volume per second).
Project full-bar Expected Volume = (volume so far / seconds elapsed) × bar-seconds.
Compute Volume EMA (default 14) for baseline; derive Stochastic(volume, length) and smoothed signal for momentum.
Define “Burst” conditions:
• Volume > prior volume × Volume Bar Increase Amount;
• Volume > Minimum Volume;
• Volume > Volume EMA;
• Stochastic(volume) rising and/or above threshold.
Classify “Burst at Breakout” when Burst aligns with Stochastic crossover above the Breakout Threshold.
Classify Bullish/Bearish Expected Volume: if Expected Volume is ≥ 1.618 × prior bar volume and prior volume > Volume EMA, then:
• Bullish if bar is green with a rising low;
• Bearish if bar is red with a falling high.
Color-map actual volume columns by state; overlay Expected Volume columns (magenta) and paint conditional overlays (lime/red) when directional context is detected.
How to Use
Spot the Surge Early
When Expected Volume spikes well above typical (and especially above ~1.618× the prior bar) before the bar closes, it often precedes a volatile move. Use this to prepare entries with tight, structure-based risk (e.g., just beyond the current bar’s wick) and asymmetric targets.
Confirm with Momentum
Yellow/orange volume columns indicate burst/breakout behavior in the live tape. When this aligns with a lime (bullish) or red (bearish) Expected Volume column, the probability of follow-through improves—particularly if aligned with prevailing trend or key levels.
Context Matters
Combine with your preferred S/R or structure tools (e.g., order blocks, channels, VWAP) to avoid chasing into obvious supply/demand. The projected surge can mark both continuations and sharp reversals depending on location and broader context.
Alerts
High Expected Volume – Bullish: When projected volume surges and the price action meets bullish conditions (green body with rising low).
High Expected Volume – Bearish: When projected volume surges and the price action meets bearish conditions (red body with falling high).
Other Usage Notes and Limitations
Projected volume depends on intrabar pace; abrupt pauses/flushes can change the projection quickly, especially on very small timeframes.
Minimum Volume and EMA baselines help filter thin markets; adjust upward on illiquid symbols to reduce noise.
A rising projection does not pick direction on its own—directional coloring (lime/red) requires price-action confirmation; otherwise treat magenta projections as “heads-up” only.
As with any single indicator, use within a broader plan (risk management, structure, confluence) to mitigate false positives and improve selectivity.
Inputs (Quick Reference)
Moving Average (int, default 14)
Stochastic Length (int, default 8)
Smoothing (int, default 3)
Stochastic Volume Breakout Threshold (int, default 20)
Volume Bar Increase Amount (float, default 1.618)
Minimum Volume (int, default 10,000)
Consecutive Volume Above 14 EMA (int, default 3)

Adaptive Volume Delta Map---
📊 Adaptive Volume Delta Map (AVDM)
What is Adaptive Volume Delta Map (AVDM)?
The Adaptive Volume Delta Map (AVDM) is a smart, multi-timeframe indicator that visualizes buy and sell volume imbalances directly on the chart.
It adapts automatically to the best available data resolution (tick, second, minute, or daily), allowing traders to analyze market activity with micro-level precision .
In addition to calculating volume delta (the difference between buying and selling pressure), AVDM can display a Volume Distribution Map — a per-price-level visualization showing how volume is split between buyers and sellers.
Key Features
✅ Adaptive Resolution Selection — Automatically chooses the highest possible data granularity — from tick to daily timeframe.
✅ Volume Delta Visualization — Displays delta candles reflecting the dominance of buyers (green), sellers (red), and delta (orange).
✅ Per-Level Volume Map (optional) — Shows detailed buy/sell volume distribution per price level, grouped by `Ticks Per Row`.
✅ Bid/Ask Classification — When enabled, AVDM uses bid/ask logic to classify trade direction with greater accuracy.
✅ Smart Auto-Disable Protection — Automatically disables volume map if too many price levels (>50) are detected — preventing performance degradation.
Inputs Overview
Use Seconds Resolution — Enables use of second-level data (if your TradingView subscription allows it).
Use Tick Resolution — Enables tick-based analysis for the most detailed view. If available, enable both tick and seconds resolution.
Use Bid/Ask Calculated — Uses bid/ask midpoint logic to classify trades.
Show Volume Distribution — Toggles per-price-level buy/sell volume visualization.
Ticks Per Row — Controls how many ticks are grouped per volume level. Reduce this value for finer detail, or increase it to reduce visual load.
Calculated Bars — Sets how many historical bars the indicator should process. Higher value increases accuracy but may impact performance.
How to Use
1. Add the indicator to your chart.
2. Ensure that your symbol provides volume data (and preferably tick or second-level data).
3. The indicator will automatically select the optimal timeframe for detailed calculation.
4. If your TradingView subscription allows second-level data , enable “Use Seconds Resolution.”
5. If your subscription allows tick-level data , enable both “Use Tick Resolution” and “Use Seconds Resolution.”
6. Adjust the “Calculated Bars” input to set how many historical bars the indicator should process.
7. Observe the Volume Delta Candles :
* Green = Buy pressure dominates
* Red = Sell pressure dominates
8. To see buy/sell clustering by price, enable “Show Volume Distribution.”
9. If the indicator disables the map and shows:
" Volume Distribution disabled: Too many price levels detected (>50). Try decreasing 'Ticks Per Row' or using a lower chart resolution. If you don’t care about the map, just turn off 'Show Volume Distribution'. "
— follow the instructions to reduce chart load.
Notes
* Automatically adapts to your chart’s resolution and data availability.
* If your symbol doesn’t provide volume data, a runtime warning will appear.
* Works best on futures , FX , and crypto instruments with high-frequency volume streams.
Why Traders Love It
AVDM combines adaptive resolution , volume delta analysis , and visual distribution mapping into one clean, efficient tool.
Perfect for traders studying:
* Market microstructure
* Aggressive vs. passive participation
* Volume absorption
* Order flow imbalance zones
* Delta-based divergence signals
Technical Highlights
* Built with Pine Script v6
* Adaptive resolution logic (`security_lower_tf`)
* Smart memory-safe map rendering
* Dynamic bid/ask classification
* Automatic overload protection
---

Vol-Pace Projected-ATR-ADX-Alert-MAThe VolSC indicator analyzes stock volume trends with a focus on the Pace metric, which projects today's volume as a percentage of the 30-day average, highlighting unusual activity (e.g., over 200% turns bright green with alerts). The phantom projection bar, a wide green histogram to the right of the last bar, visually represents this projected volume on daily charts only, aiding quick identification of potential volume surges without cluttering intraday or weekly views. Additional features include ADX strength, ATR averages, and customizable table display for comprehensive insights.
Key Features:
* Primary Indicator: Volume with ADX (Average Directional Index) text.
* Pacing and Alerts: Calculates the volume pace for the day. Features an unusual volume alert with an adjustable threshold (e.g., 200%).
* Volume Projection: Projects a visual "Phantom Volume" for the day, offset to the right of the actual volume bar.
* ATR Indicator: Displays the 2x ATR (Average True Range) value as text.
* Volume Average: Displays the ADV (Average Daily Volume) Moving Average as text.
* Customization: Most settings are adjustable.

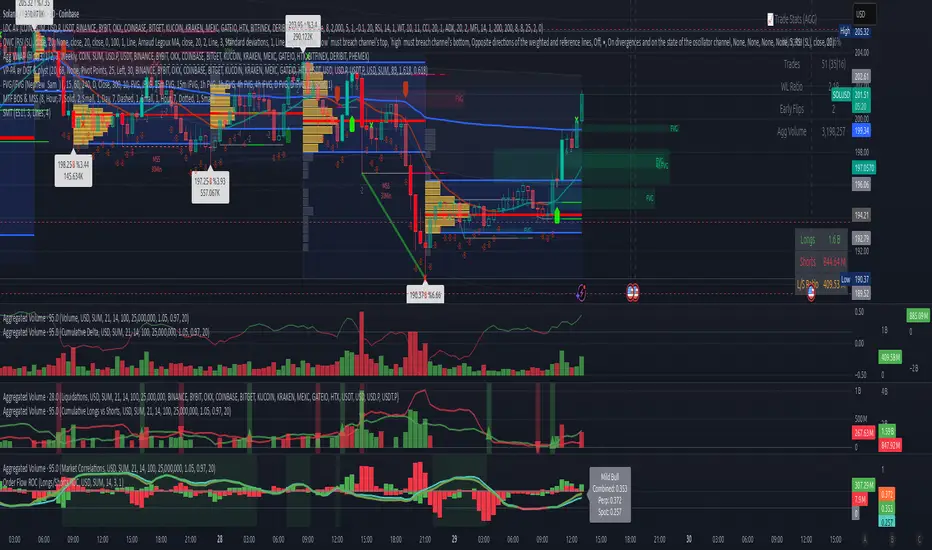
Volume Aggregated Spot & Futures -- Crypto (by plyst & more)📊 Volume Aggregated Spot & Futures - Enhanced Edition
🎯 Overview
Advanced volume aggregation indicator that combines spot and perpetual futures volume across the top 10 cryptocurrency exchanges. This enhanced version builds upon the original work by @HALDRO Project with optimized calculations and expanded functionality.
✨ Key Features
- 📈 Real-time aggregated volume from 10 major exchanges (Binance, Bybit, OKX, Coinbase, Bitget, KuCoin, Kraken, MEXC, Gate.io, HTX)
- 🔄 Multiple visualization modes: Volume, Delta, Cumulative Delta, Spot vs Perp analysis, Liquidations, OBV, and MFI
- 💱 Multi-currency support: Display volume in COIN, USD, or EUR
- 🎨 Clean, single-color bar chart showing total cumulative volume
- 📊 Multiple calculation methods: SUM, AVG, MEDIAN, VARIANCE
- 🎯 Separate spot (USDT, USD, USDC, etc.) and perpetual futures (.P contracts) tracking
🔧 Technical Improvements
✓ Corrected MFI formula for accurate money flow calculations
✓ Optimized volume aggregation logic with proper NA handling
✓ Support for 10 exchanges (up from 9)
✓ Streamlined codebase for better performance
✓ Updated perpetual contract naming conventions (.P format)
📖 Usage
Perfect for analyzing total market volume, identifying liquidation events, tracking buyer/seller pressure through delta analysis, and understanding the spot vs futures market dynamics.
🙏 Credits
Original concept and framework by @HALDRO Project. This version includes mathematical corrections, code optimizations, and expanded exchange support.
⚠️ Note
Aggregated volume is calculated from external exchange data using request.security(). Ensure your plan supports the necessary security calls for optimal performance.
Fixed-Range Volume-Profile ZonesFixed Range Volume Profile Zones (with Dynamic Percentile Buffers)
This indicator calculates a fixed‑range volume profile over a user‑defined lookback period and identifies three key zones:
– VAL (Value Area Low)
– POC (Point of Control)
– VAH (Value Area High)
Volume is grouped into user‑selected price bins to create a profile of where the most trading activity occurred.
The script then splits the distribution into three zones and highlights the extremes (VAL/VAH) and the highest‑volume price (POC).
Dynamic Percentile Buffers
Instead of static offsets, this version computes the 10th and 90th percentile prices (user‑adjustable) of recent closes over the same lookback window.
These percentiles are used to create adaptive buffers above VAH and below VAL.
The buffers automatically expand or contract with market volatility and recent price distribution, filtering out weak or noisy touches.
Visual Elements:
– Green/orange/red horizontal lines = VAL / VAH / POC
– Green shading below VAL = buy zone
– Red shading above VAH = sell zone
– Down arrows above bars = closes above VAH + buffer
– Up arrows below bars = closes below VAL – buffer
Inputs:
– Lookback Days: number of bars used to build the profile
– Number of Bins: controls resolution of the volume profile
– VAH Percentile and VAL Percentile: choose which percentile levels to use for dynamic buffers
Use Cases:
– Quickly identify areas of high participation (POC) and potential support/resistance (VAL/VAH)
– Filter out weak breakouts using dynamic buffers
– Combine with other signals to improve entries/exits
⚠️ Disclaimer:
This script is for educational and informational purposes only.
It does not constitute financial advice or a recommendation to buy or sell any security.
Past performance or historical data does not guarantee future results.
Always perform your own analysis and use risk management when trading.

VWAP Daily/Weekly/Monthly - Automatic AnchoredExplanation:
This script plots Volume-Weighted Average Price (VWAP) lines that are automatically anchored to the beginning of key timeframes — daily, weekly, and monthly. VWAP is a widely used trading indicator that shows the average price of an asset weighted by trading volume, making it useful for identifying fair value and institutional trading levels.
The “automatic anchored” feature means that you don’t have to manually select starting points. Instead, the script automatically resets the VWAP at the start of each day, week, or month, depending on the chosen setting. This ensures the VWAP always reflects the true average price for that period, providing traders with a consistent reference for support, resistance, and trend direction across multiple timeframes.
Notice:
On the chart, you may notice visible “jumps” in the VWAP lines. These are intentional. Each jump marks the reset point at the start of a new day, week, or month, depending on the selected setting. This design keeps the VWAP history from the previous period intact, allowing you to clearly see how price interacted with VWAP in past sessions.
By keeping these historical resets, you can easily compare short-term (daily) VWAP behavior against longer-term levels like weekly and monthly VWAP. This provides valuable context, helping you spot when price respects or diverges from fair value across different timeframes.
In short:
Daily VWAP resets at the start of each trading day.
Weekly VWAP resets at the beginning of each trading week.
Monthly VWAP resets at the start of each month.
This makes it easy to analyze how price interacts with VWAP levels across different time horizons without manual adjustments.

Volume Profile 3D (Zeiierman)█ Overview
Volume Profile 3D (Zeiierman) is a next-generation volume profile that renders market participation as a 3D-style profile directly on your chart. Instead of flat histograms, you get a depth-aware profile with parallax, gradient transparency, and bull/bear separation, so you can see where liquidity stacked up and how it shifted during the move.
Highlights:
3D visual effect with perspective and depth shading for clarity.
Bull/Bear separation to see whether up bars or down bars created the volume.
Flexible colors and gradients that highlight where the most significant trading activity took place.
This is a state-of-the-art volume profile — visually powerful, highly flexible, and unlike anything else available.
█ How It Works
⚪ Profile Construction
The price range (from highest to lowest) is divided into a number of levels (buckets). Each bar’s volume is added to the correct level, based on its average price. This builds a map of where trading volume was concentrated.
You can choose to:
Aggregate all volume at each level, or
Split bullish vs. bearish volume , slightly offset for clarity.
This creates a clear view of which price zones matter most to the market.
⚪ 3D Effect Creation
The unique part of this indicator is how the 3D projection is built. Each volume block’s width is scaled to its relative size, then tilted with a slope factor to create a depth effect.
maxVol = bins.bu.max() + bins.be.max()
width = math.max(1, math.floor(bucketVol / maxVol * ((bar_index - start) * mult)))
slope = -(step * dev) / ((bar_index - start) * (mult/2))
factor = math.pow(math.min(1.0, math.abs(slope) / step), .5)
width → determines how far the volume extends, based on relative strength.
slope → creates the angled projection for the 3D look.
factor → adjusts perspective to make deeper areas shrink naturally.
The result is a 3D-style volume profile where large areas pop forward and smaller areas fade back, giving you immediate visual context.
█ How to Use
⚪ Support & Resistance Zones (HVNs and Value Area)
Regions where a lot of volume traded tend to act like walls:
If price approaches a high-volume area from above, it may act as support.
From below, it may act as resistance.
Traders often enter or exit near these zones because they represent strong agreement among market participants.
⚪ POC Rejections & Mean Reversions
The Point of Control (POC) is the single price level with the highest volume in the profile.
When price returns to the POC and rejects it, that’s often a signal for reversal trades.
In ranging markets, price may bounce between edges of the Value Area and revert to POC.
⚪ Breakouts via Low-Volume Zones (LVNs)
Low volume areas (gaps in the profile) offer path of least resistance:
Price often moves quickly through these thin zones when momentum builds.
Use them to spot breakouts or continuation trades.
⚪ Directional Insight
Use the bull/bear separation to see whether buyers or sellers dominated at key levels.
█ Settings
Use Active Chart – Profile updates with visible candles.
Custom Period – Fixed number of bars.
Up/Down – Adjust tilt for the 3D angle.
Left/Right – Scale width of the profile.
Aggregated – Merge bull/bear volume.
Bull/Bear Shift – Separate bullish and bearish volume.
Buckets – Number of price levels.
Choose from templates or set custom colors.
POC Gradient option makes high volume bolder, low volume lighter.
-----------------
Disclaimer
The content provided in my scripts, indicators, ideas, algorithms, and systems is for educational and informational purposes only. It does not constitute financial advice, investment recommendations, or a solicitation to buy or sell any financial instruments. I will not accept liability for any loss or damage, including without limitation any loss of profit, which may arise directly or indirectly from the use of or reliance on such information.
All investments involve risk, and the past performance of a security, industry, sector, market, financial product, trading strategy, backtest, or individual's trading does not guarantee future results or returns. Investors are fully responsible for any investment decisions they make. Such decisions should be based solely on an evaluation of their financial circumstances, investment objectives, risk tolerance, and liquidity needs.

Breakout Volume
指标名称:Breakout Volume (BrkVol)
功能:本指标用于识别成交量异常放大,同时结合价格新高,帮助交易者发现潜在突破机会。
主要特性:
可调成交量均线周期(MA Length)
可调放量倍数(Volume Multiplier)
可调价格新高周期(Lookback High Length)
成交量柱颜色区分:绿色=阳线放量,红色=阴线放量,灰色=无信号
蓝色均量阈值线,可直观比较放量情况
出现成交量突破 + 新高时,图表上显示绿色三角形标记
支持提醒功能,可在条件触发时收到通知
使用建议:
调整参数以适应不同品种和时间周期
可结合趋势、支撑阻力位使用,避免假信号
适合快速发现短线或中长线突破机会
English Description
Name: Breakout Volume (BrkVol)
Function: This indicator detects unusual volume spikes combined with new highs in price, helping traders identify potential breakout opportunities.
Key Features:
Adjustable moving average period (MA Length) for volume
Adjustable volume multiplier (Volume Multiplier)
Adjustable lookback period for price highs (Lookback High Length)
Color-coded volume bars: Green = bullish candle with volume breakout, Red = bearish candle with volume breakout, Gray = normal volume
Blue threshold line (volume MA × multiplier) for easy comparison
Green triangle marker appears when both volume breakout and new high conditions are met
Supports alerts for real-time notifications
Usage Tips:
Adjust parameters to suit different symbols and timeframes
Combine with trend or support/resistance levels to reduce false signals
Useful for spotting short-term or medium/long-term breakout opportunities

Delta Volume Signals by Claudio [hapharmonic]Modifications:
Percentages without decimals.
I replaced the 'Current Volume' row with two boxes: "Δ Vol" and its value, which changes color depending on the direction of the bearish/bullish candle.
Signals can change color in the settings.
Box spacing so the table doesn't constantly change size.
To be modified:
The Net Volume sign shouldn't change to negative when the candle is red.
If anyone does this, let me know...
claudio.ventola@hotmail.com
Best regards!

Quadro Volume Profile [BigBeluga]🔵 OVERVIEW
The Quadro Volume Profile is a precision-engineered volume profiling tool that segments market activity into four distinct quadrants surrounding the current price. By separating bullish and bearish volume above and below the current price, it helps traders identify dominant forces and high-interest price zones with ease. Each quadrant includes label annotations showing total volume and its share of overall activity — delivering powerful insights into the market’s internal structure.
🔵 CONCEPTS
Four-Quadrant Volume Distribution : Volume is separated into Buy and Sell profiles both above and below the current price.
Directional Volume Logic : Bullish and bearish candle volume is allocated to specific bins, creating color-coded volume stacks.
Dynamic PoC Detection : Point of Control (PoC) levels are calculated per quadrant and optionally displayed.
Lookback-Based Anchoring : The volume histogram is anchored to a fixed lookback window, ensuring consistency and historical context.
Label-Based Analytics : Each quadrant displays a labeled breakdown of direction, total volume, and percentage weight of total activity.
🔵 FEATURES
Four separate volume profiles:
Upper Left: Bearish volume (Sell Quad above price)
Upper Right: Bullish volume (Buy Quad above price)
Lower Left: Bullish volume (Buy Quad below price)
Lower Right: Bearish volume (Sell Quad below price)
Live Labels for Each Quad:
Displays BUY or SELL direction
Shows total volume per quadrant (e.g. 607.49K)
Displays percent share of total quad volume (e.g. 18.87%)
Toggle visibility for each profile and each Point of Control (PoC) dashed PoC lines with volume annotations
Adjustable calculation period (lookBack), number of bins, and horizontal offset
Color gradient intensity represents volume strength per bin
Auto-cleaning visuals to keep the chart uncluttered
Gradient color control for Buy and Sell volumes
Clean midline split between upper and lower quadrants
🔵 HOW TO USE
Select your desired calculation period (default: 200 bars) to define the range for volume analysis.
Adjust the bins parameter for more or less resolution in volume distribution.
Toggle each quadrant on/off depending on your preference using the settings panel:
“Upper Sell Quad” – shows bearish volume above current price (left)
“Upper Buy Quad” – shows bullish volume above current price (right)
“Lower Buy Quad” – shows bullish volume below current price (left)
“Lower Sell Quad” – shows bearish volume below current price (right)
Enable or disable PoC lines for each quad to highlight where volume peaked.
Use the gradient coloring to identify volume imbalances — sharp differences between opposing quads often indicate key zones of rejection or breakout.
Monitor the midline level which splits the four quadrants — it serves as a psychological pivot zone.
🔵 CONCLUSION
The Quadro Volume Profile offers a powerful and visually intuitive way to dissect market activity around price. By splitting volume into four quadrants, traders can better interpret order flow, identify dominant volume zones, and spot potential reversals or continuation setups. Whether you're trading breakouts, liquidity sweeps, or range-bound behavior — this tool adds a structured layer of volume context to your charting workflow.

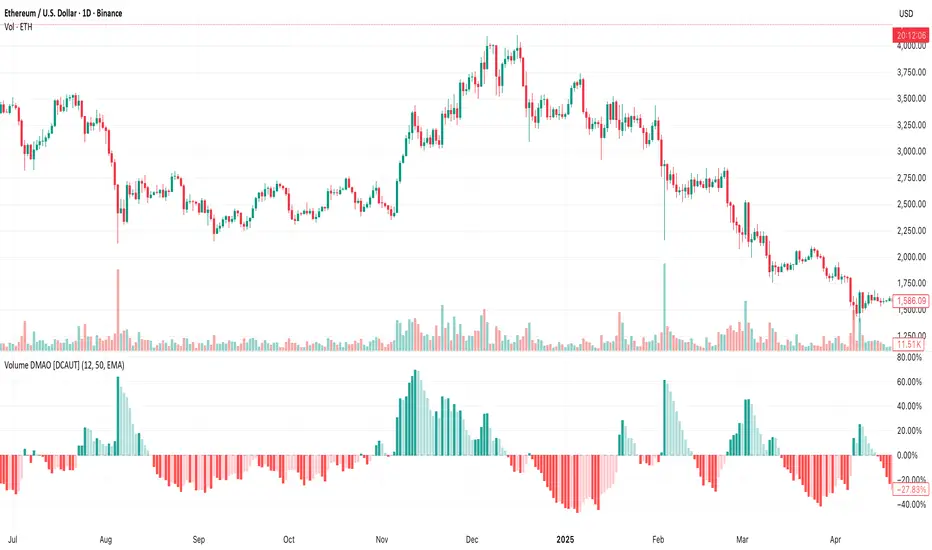
Volume DMAO [DCAUT]█ Volume DMAO Indicator
📊 OVERVIEW
The Volume DMAO (Dual Moving Average Oscillator) applies PPO-style calculation to volume data rather than price. It measures the percentage difference between fast and slow moving averages of volume, providing insights into volume momentum and market participation trends.
🎯 CONCEPTS
Signal Interpretation
Positive Values : Current volume above historical average (expansion phase)
Negative Values : Current volume below historical average (contraction phase)
Rising Trend : Volume momentum accelerating (increasing participation)
Falling Trend : Volume momentum decelerating (decreasing participation)
Primary Applications
Volume Confirmation : Validate price movements with volume momentum analysis
Divergence Detection : Spot potential reversals when volume diverges from price
Trend Strength : Assess volume participation in price trends
Entry/Exit Signals : Time trades based on volume momentum shifts
📋 PARAMETER SETUP
Input Parameters
Fast Length : Period for fast moving average (default: 12)
Slow Length : Period for slow moving average (default: 50)
MA Type : Moving average algorithm (default: EMA)
📊 COLOR CODING
Histogram Colors
Dark Green : Positive and rising (strong volume expansion)
Light Green : Positive and falling (weakening volume expansion)
Light Red : Negative and rising (recovering from volume contraction)
Dark Red : Negative and falling (strong volume contraction)
💡 CORE VALUE
Unlike traditional volume indicators, Volume DMAO provides normalized percentage readings that:
- Enable comparison across different timeframes and instruments
- Reveal volume momentum changes before price movements
- Identify market phases through volume participation analysis
Volume ClusteringThis Volume Clustering script is a powerful tool for analyzing intraday trading dynamics by combining two key metrics: volume Z-Score and Cumulative Volume Delta (CVD). By categorizing market activity into distinct clusters, it helps you identify high-conviction trading opportunities and understand underlying market pressure.
How It Works
The script operates on a simple, yet effective, premise: it classifies each trading bar based on its statistical significance (volume Z-Score) and buying/selling pressure (CVD).
Volume Z-Score
The volume Z-Score measures how far the current bar's volume is from its average, helping to identify periods of unusually high or low volume. This metric is a powerful way to spot when institutional or large players might be entering the market. A high Z-Score suggests a significant event is taking place, regardless of direction.
Cumulative Volume Delta (CVD)
CVD tracks the net buying and selling pressure across different timeframes. The script uses a lower timeframe (e.g., 1-minute) and anchors it to a higher timeframe (e.g., 1-day) to capture intraday pressure. A positive CVD indicates more buying pressure, while a negative CVD suggests more selling pressure.
Cluster Categories
The script analyzes the confluence of these two metrics to assign a cluster to each bar, providing actionable insights. The clusters are color-coded and labeled to make them easy to interpret:
🟢 High Conviction Bullish: Unusually high volume (high Z-Score) combined with significant buying pressure (high CVD). This cluster suggests strong bullish momentum.
🔴 High Conviction Bearish: Unusually high volume (high Z-Score) coupled with significant selling pressure (low CVD). This cluster suggests strong bearish momentum.
🟡 Low Conviction/Noise: Low to moderate volume and mixed buying/selling pressure. This represents periods of indecision or consolidation, where market noise is more prevalent.
🟣 Other Clusters: The script also identifies other combinations, such as high volume with moderate CVD, or low volume with high CVD, which can provide additional context for understanding market dynamics.
Key Features & Customization
The script offers several customizable settings to tailor the analysis to your specific trading style:
Z-Score Lookback Length: Adjust the lookback period for calculating the average volume. A shorter period focuses on recent volume trends, while a longer period provides a broader context.
CVD Anchor & Lower Timeframe: Define the timeframes used for CVD calculation. You can anchor the analysis to a daily or weekly timeframe while using a lower timeframe (e.g., 1-minute) to capture granular intraday pressure.
High/Low Volume Mode: Toggle between "High Volume" mode (which uses 90th and 10th percentiles for clustering) and "Low Volume" mode (which uses 75th and 25th percentiles). This allows you to choose whether to focus on extreme events or more subtle shifts in market sentiment.

VOLUME Full [Titans_Invest]VOLUME Full
Designed for traders who want to take volume analysis to the next level.
This version delivers deeper insight into volume activity, integrating multiple customizable filters to highlight key buying and selling pressure. It's a comprehensive solution for volume-based decision-making.
⯁ WHAT IS THE VOLUME❓
The Volume indicator is a fundamental technical analysis tool that measures the number of shares or contracts traded in a security or market during a given period. It helps traders and investors understand the strength or weakness of a price movement, confirm trends, and predict potential reversals. Volume is typically displayed as a histogram below a price chart, with each bar representing the volume traded during a specific time interval.
⯁ HOW TO USE THE VOLUME❓
The Volume indicator can be used in several ways to enhance trading decisions:
• Trend Confirmation: High volume during a price move confirms the strength of that trend, while low volume can indicate a weak or unsustainable trend.
• Breakouts: A price breakout from a pattern or range accompanied by high volume is more likely to be valid and sustainable.
• Divergence: When the price moves in one direction and volume moves in the opposite direction, it can signal a potential reversal.
• Overbought/Oversold Conditions: Extreme volume levels can sometimes indicate that an asset is overbought or oversold, though this is less straightforward than with oscillators like the RSI.
⯁ ENTRY CONDITIONS
The conditions below are fully flexible and allow for complete customization of the signal.
______________________________________________________
🔹 CONDITIONS TO BUY 📈
______________________________________________________
▪︎ Signal Validity: The signal will remain valid for X bars .
▪︎ Signal Sequence: Configurable as AND or OR .
🔹 volume Positive
🔹 volume Negative
🔹 volume > volume
🔹 volume < volume
🔹 volume > volume_MA
🔹 volume > volume_MA * Trigger Signal (close > open)
🔹 volume > volume_MA * Trigger Signal (Keep State P)
🔹 volume > volume_MA * Trigger Signal (close < open)
🔹 volume > volume_MA * Trigger Signal (Keep State N)
______________________________________________________
______________________________________________________
🔸 CONDITIONS TO SELL 📉
______________________________________________________
▪︎ Signal Validity: The signal will remain valid for X bars .
▪︎ Signal Sequence: Configurable as AND or OR .
🔸 volume Positive
🔸 volume Negative
🔸 volume > volume
🔸 volume < volume
🔸 volume > volume_MA
🔸 volume > volume_MA * Trigger Signal (close > open)
🔸 volume > volume_MA * Trigger Signal (Keep State P)
🔸 volume > volume_MA * Trigger Signal (close < open)
🔸 volume > volume_MA * Trigger Signal (Keep State N)
______________________________________________________
______________________________________________________
🤖 AUTOMATION 🤖
• You can automate the BUY and SELL signals of this indicator.
______________________________________________________
______________________________________________________
⯁ UNIQUE FEATURES
______________________________________________________
Signal Validity: The signal will remain valid for X bars
Signal Sequence: Configurable as AND/OR
Condition Table: BUY/SELL
Condition Labels: BUY/SELL
Plot Labels in the Graph Above: BUY/SELL
Displays Positive & Negative Volume.
Automate and Monitor Signals/Alerts: BUY/SELL
Signal Validity: The signal will remain valid for X bars
Signal Sequence: Configurable as AND/OR
Table of Conditions: BUY/SELL
Conditions Label: BUY/SELL
Plot Labels in the graph above: BUY/SELL
Displays Positive & Negative Volume.
Automate & Monitor Signals/Alerts: BUY/SELL
______________________________________________________
📜 SCRIPT : VOLUME Full
🎴 Art by : @Titans_Invest & @DiFlip
👨💻 Dev by : @Titans_Invest & @DiFlip
🎑 Titans Invest — The Wizards Without Gloves 🧤
✨ Enjoy!
______________________________________________________
o Mission 🗺
• Inspire Traders to manifest Magic in the Market.
o Vision 𐓏
• To elevate collective Energy 𐓷𐓏

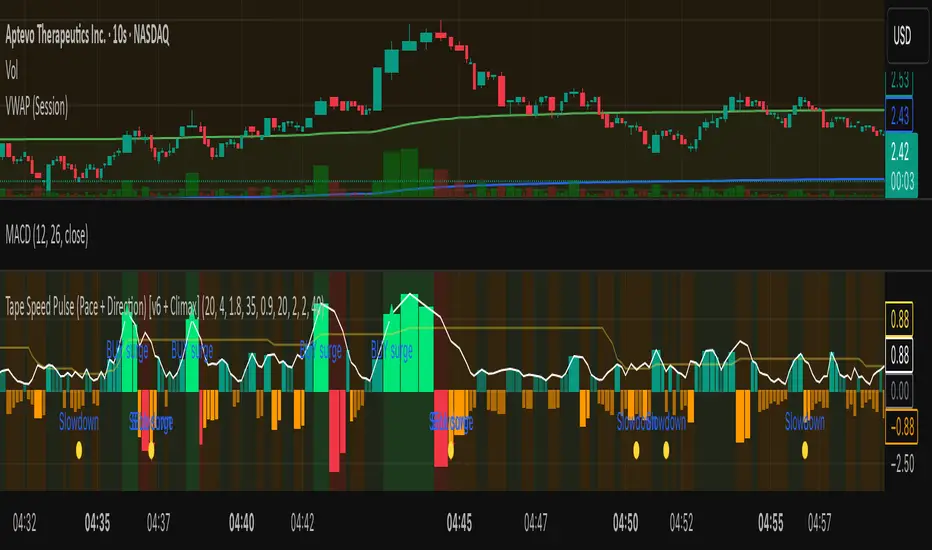
Tape Speed Pulse (Pace + Direction) [v6 + Climax]Tape Speed Pulse (Pace + Direction)
One-liner:
A lightweight “tape pulse” that turns intraday bursts of buying/selling into an easy-to-read histogram, with surge, slowdown, and climax (exhaustion) markers for fast decision-making. Use on sec and min charts.
What it measures
Pace (RVOL): current bar volume vs the recent average (smoothed).
Direction proxy: uptick/downtick by comparing close to close .
Pulse (histogram): direction × pace, so you see who’s pushing and how fast.
Colors
- Lime = Buy surge (pace ≥ threshold & upticking)
- Red = Sell surge (pace ≥ threshold & downticking)
- Teal = Buy pressure, sub-threshold
- Orange = Sell pressure, sub-threshold
- Faded/gray = Near-neutral pace (below the Neutral Band)
Lines (toggleable)
-White = Pace (RVOL)
- Yellow = Slowdown line = a drop of X% from the last 30-bar peak pace
Background tint mirrors the current state so you can glance risk: greenish for buy pressure, reddish for sell pressure.
Signals & alerts
- BUY surge – fires when pace crosses above the surge threshold with uptick direction (optional acceleration & uptick streak filters; cooldown prevents spam).
- SELL surge – mirror logic to downside.
- Slowdown – fires when pace crosses below the yellow slowdown line while direction ≤ 0 (early fade warning).
Climax (exhaustion)
- Buy Climax: previous bar was a buy surge with a large upper wick; current bar slows (below slowdown line) and direction ≤ 0.
- Sell Climax: mirror (large lower wick → slowdown → direction ≥ 0).
- Great for trimming/tight stops or fade setups at obvious spikes.
- Create alerts via Add alert → Condition: this indicator → choose the specific alert (BUY surge, SELL surge, Slowdown, Buy Climax, Sell Climax).
How to use it (playbook)
- Longs (e.g., VWAP reclaim / micro pullback)
- Only take entries when the pulse is teal→lime (buy pressure to buy surge).
- Into prior highs/VWAP bands, take partials on lime spikes.
- If you get a Slowdown dot and bars turn orange/red, tighten or exit.
Shorts (failed reclaim / lower-high)
- Look for teal→orange→red with rising pace at a level.
- Add confidence if a Buy Climax printed right before (exhaustion).
- Risk above the spike; don’t fight true ignitions out of bases.
Simple guardrails
- Avoid new longs when the histogram is orange/red; avoid new shorts when teal/lime.
- Use with VWAP + 9/20 EMA or your levels. The pulse is confirmation, not the whole thesis.
Inputs (what they do & when to tweak)
- Pace lookback (bars) – window for average volume. Lower = faster; higher = steadier.
Too jumpy? raise it. Missing quick bursts? lower it.
- Smoothing EMA (bars) – smooths pace. Higher = calmer.
Use 4–6 during the open; 3–4 midday.
- Surge threshold (× RVOL) – how fast counts as a surge.
Too many surges? raise it. Too late? lower it slightly.
- Slowdown drop from 30-bar max (%) – how far below the recent peak pace to call a slowdown.
Higher % = later slowdown; lower % = earlier warning.
- Neutral band (× RVOL) – paces below this fade to gray.
Raise to clean up noise; lower to see subtle pressure.
- Min seconds between signals – cooldown to prevent spam.
Increase in chop; reduce if you want more pings.
- BUY/SELL: min consecutive upticks/downticks – tiny streak filter.
Raise to avoid wiggles; lower for earlier signals.
Require pace accelerating into signal – ON = avoid stall breakouts; OFF = earlier pings.
Climax options: wick % threshold & “require slowdown cross”.
Raise wick% / require cross to be stricter; lower to catch more fades.
Quick presets
- Low-float runner, 5–10s chart
- Lookback 20, Smoothing 3–4, Surge 2.2–2.8, Slowdown 35–45, Neutral 1.0–1.2, Cooldown 15–25s, Streaks 2–3, Accel ON.
- Thick large-cap, 1-min
- Lookback 20–30, Smoothing 5–7, Surge 1.5–1.9, Slowdown 25–35, Neutral 0.8–1.0, Cooldown 30–60s, Streaks 2, Accel ON.
- Open vs Midday vs Power Hour
- Open: higher Surge, more Smoothing, longer Cooldown.
- Midday: lower Surge, less Smoothing to catch subtler pushes.
- Power hour: moderate Surge; keep Slowdown on for exits.
Reading common patterns
- Ignition (likely continuation): lime spike out of a base that holds above a level while pace stays above yellow.
- Exhaustion (likely fade): lime spike late in a run with upper wick → Slowdown → orange/red. The Buy Climax diamond is your tell.
Limits / notes
This is an OHLCV-based proxy (TradingView Pine can’t read raw tape/DOM). It won’t match Bookmap/Jigsaw tick-for-tick, but it’s fast and objective.
Use with levels and a risk plan. Past performance ≠ future results. Educational only.
Volume Pressure Arrows[Blk0ut]Volume Pressure Arrows are an innovative (I think) market pressure tool designed to cut through noise and provide traders with a realistic, but quick insight into buying vs selling pressure and which has real control. Rather than relying on any single classic indicator, this script blends five complementary measures of price–volume dynamics—Cumulative Volume Delta (CVD), VWAP distance, OBV slope, ATR expansion, and the DMI ratio—into a unified “pressure score.”
Each component is normalized, weighted, and combined into a single metric that can be read at a glance through intuitive up and down arrows plotted directly on the chart. By transforming multiple complex data streams into a single aggregated signal, Volume Pressure Arrows help traders answer some of the hardest questions we can face: is the current move backed by conviction? is there true momentum? Is price action about to reverse?
Why It’s Different
Traditional oscillators often create conflicting signals, forcing traders to guess which one to trust. This indicator integrates five perspectives on volume and momentum pressure into a single framework, balancing raw flow (CVD), relative positioning (VWAP), trend conviction (OBV slope), volatility expansion (ATR), and directional bias (DMI). The result is a weighted, probability-minded score capped between -100 and +100 for consistency and clarity.
Important note : Inspiration for the use of directly plotted arrows came from dgtrd "https://www.tradingview.com/u/dgtrd/" and their brilliant work on LazyBear's Squeeze Indicator "https://www.tradingview.com/script/Dsr7B2xE-Squeeze-Momentum-Indicator-LazyBear-vX-by-DGT/"
How to Read It
Bullish Arrows appear below the candles when the pressure score pushes above the neutral threshold, signaling meaningful buyer dominance.
Bearish Arrows appear above the candles when pressure drops below the negative threshold, indicating strong selling pressure.
Neutral Arrows (smaller, faded) mark conditions where pressure exists but is not decisive—useful for spotting early rotations or fading momentum.
Color Gradients dynamically adjust with score intensity, making stronger signals visually brighter and weaker ones softer.
How to Use It Effectively
This tool is best applied as a confirmation and timing layer. It is not meant to replace your core strategy, but to validate whether momentum pressure supports your trade thesis.
Combine with trendlines, chart patterns, or breakouts to gauge conviction.
Use bullish or bearish arrows as filters, only take trades when price action aligns with strong directional pressure.
Watch neutral arrows near key levels; they often foreshadow balance breaking into directional moves.
Adjust the weightings to emphasize the components that matter most to your style (e.g., more weight on CVD for scalpers, or ATR expansion for volatility traders).
As with any indicator, this is not a magic ball and does not guarantee success. But it does allow you to increase the probability odds to your favor if you align it with your edge. Happy trading!

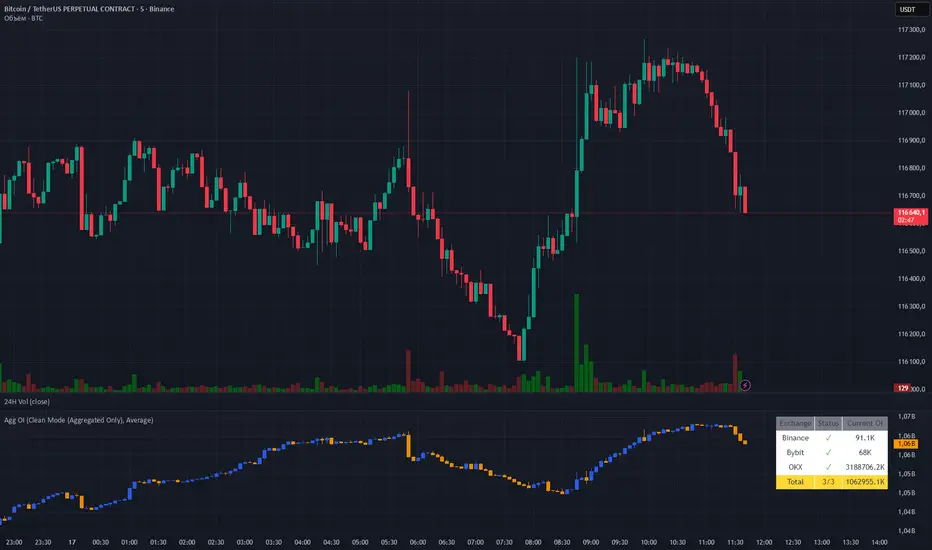
Aggregated OI by MalexThis indicator aggregates Open Interest data from multiple major exchanges (Binance, Bybit, OKX) to provide a comprehensive view of market positioning across platforms.
Original idea by Alex Nikulin.
FEATURES:
Multi-exchange OI aggregation with customizable exchange selection
Choose between Sum or Average aggregation methods
Individual exchange OI display (optional)
Clean mode - show only aggregated data
Real-time status monitoring for each exchange
Candlestick visualization matching standard OI indicators
Information panel showing current values and active exchanges
USAGE:
Enable/disable specific exchanges in settings
Choose aggregation method (Average recommended for balanced view)
Toggle individual exchange display or use clean mode
Monitor the info panel for data availability status
COMPATIBILITY:
Works with any symbol that has Open Interest data available on the selected exchanges.
Best used on perpetual futures contracts (e.g., BTCUSDT, ETHUSDT, etc.)
Volume Profile Auto POC📌 Overview
Volume Profile Auto POC is a trend-following strategy that uses the automatically calculated Point of Control (POC) from the volume profile, combined with ATR zones, to capture reversals and breakouts.
By basing decisions on volume concentration, it dynamically visualizes the price levels most watched by market participants.
⚠️ This strategy is provided for educational and research purposes only.
Past performance does not guarantee future results.
🎯 Strategy Objectives
Automatically detect the volume concentration area (POC) to improve entry accuracy
Optimize risk management through ATR-based volatility adjustment
Provide early and consistent signals when trends emerge
✨ Key Features
Automatic POC Detection : Updates the volume profile over a defined lookback window in real time
ATR Zone Integration : Defines a POC ± 0.5 ATR zone to clarify potential reversals/breakouts
Visual Support : Plots the POC line and zones on the chart for intuitive decision-making
📊 Trading Rules
Long Entry:
Price breaks above the POC + 0.5 ATR zone
Volume is above average to support the breakout
Short Entry:
Price breaks below the POC - 0.5 ATR zone
Volume is above average to support the downside move
Exit (or Reverse Position):
Price returns to the POC area
Or touches the ATR band
⚙️ Trading Parameters & Considerations
Indicator Name: Volume Profile Auto POC
Parameters:
Lookback Bars: 50
Bins for Volume Profile: 24
ATR Length: 14
ATR Multiplier: 2.0
🖼 Visual Support
POC line plotted in red
POC ± 0.5 ATR zone displayed as a semi-transparent box
ATR bands plotted in blue for confirmation
🔧 Strategy Improvements & Uniqueness
This strategy is inspired by traditional Volume Profile + ATR analysis,
while adding the improvement of a sliding-window mechanism for automatic POC updates.
Compared with conventional trend-following approaches,
its strength lies in combining both price and volume perspectives for decision-making.
✅ Summary
Volume Profile Auto POC automatically extracts key market levels (POC) and combines them with ATR-based zones,
providing a responsive trend-following method.
It balances clarity with practicality, aiming for both usability and reproducibility.
⚠️ This strategy is based on historical data and does not guarantee future profits.
Always use proper risk management when applying it.

VIM (Volume in Money)Volume in Money + MA (Short Numbers & Coloring)
This indicator visualizes the monetary volume traded in each candle, calculated as:
Money Volume
=
Volume
×
Close Price
Money Volume=Volume×Close Price
🔹 Features:
Plots bars representing the money volume (total traded value).
Coloring options:
• Prev Close → Green if the current close is higher than the previous close, Red if lower.
• Candle Direction → Green if the candle is bullish (close > open), Red if bearish (close < open).
Moving Average (default length: 14) applied on the money volume for trend analysis.
Axis values and labels displayed in a shortened format (K, M, B, T) for readability.
📊 This helps traders quickly identify whether large amounts of money flowed into or out of the asset, making it easier to detect unusual activity compared to regular volume indicators.

Trading Activity Index (Zeiierman)█ Overview
Trading Activity Index (Zeiierman) is a volume-based market activity meter that transforms dollar-volume into a smooth, normalized “activity index.”
It highlights when market participation is unusually low or high with a dynamic color gradient:
Light Blue → Low Activity (thin participation, low liquidity conditions)
Red/Orange → High Activity (active markets, large trades flowing in)
Additional percentile bands (20/40/60/80%) give context, helping you see whether the current activity level is in the bottom quintile, mid-range, or near historical extremes.
█ How It Works
⚪ Dollar Volume Transformation
Each bar, dollar volume is computed:
float dlrVol = close * volume
float dlrVolAvg = ta.sma(dlrVol, len_form)
Dollar volume = price × volume, smoothed by a configurable SMA window.
The result is log-transformed, compressing large outliers for a more stable signal.
⚪ Rolling Percentiles & Ranking
The log-dollar-volume series is compared to its rolling history (len_hist bars):
float p20 = ta.percentile_linear_interpolation(vscale, len_hist, 20)
float p40 = ta.percentile_linear_interpolation(vscale, len_hist, 40)
float p60 = ta.percentile_linear_interpolation(vscale, len_hist, 60)
float p80 = ta.percentile_linear_interpolation(vscale, len_hist, 80)
A normalized rank (0–1) is produced to color the main Trading Activity line.
█ How to Use
⚪ Detect High-Impact Sessions
Quickly see if today’s session is active or quiet relative to its own history — great for filtering setups that need activity.
⚪ Spot Breakouts & Traps
Combine with price action:
High activity near breakouts = strong follow-through likely.
Low activity breakouts = vulnerable to fake-outs.
⚪ Market Regime Context
Percentile bands help you assess whether participation is building up, in the middle of the range, or drying out — valuable for timing mean-reversion trades.
Above 80th percentile (red/orange) → Market is highly active, breakout trades and trend strategies are favored.
Below 20th percentile (light blue) → Market is quiet; fade moves or wait for expansion.
Watch transitions from blue → orange as a signal of growing institutional participation.
█ Settings
Formation Window (bars) – Number of bars used to average dollar volume before log transform.
History Window (bars) – Lookback period for percentile calculations and rank normalization.
-----------------
Disclaimer
The content provided in my scripts, indicators, ideas, algorithms, and systems is for educational and informational purposes only. It does not constitute financial advice, investment recommendations, or a solicitation to buy or sell any financial instruments. I will not accept liability for any loss or damage, including without limitation any loss of profit, which may arise directly or indirectly from the use of or reliance on such information.
All investments involve risk, and the past performance of a security, industry, sector, market, financial product, trading strategy, backtest, or individual's trading does not guarantee future results or returns. Investors are fully responsible for any investment decisions they make. Such decisions should be based solely on an evaluation of their financial circumstances, investment objectives, risk tolerance, and liquidity needs.

Liquidity Void Detector (Zeiierman)█ Overview
Liquidity Void Detector (Zeiierman) is an oscillator highlighting inefficient price displacements under low participation. It measures the most recent price move (standardized return) and amplifies it only when volume is below its own trend.
Positive readings ⇒ strong up-move on low volume → potential Buy-Side Imbalance (void below) that often refills.
Negative readings ⇒ strong down-move on low volume → potential Sell-Side Imbalance (void above) that often refills.
This tool provides a quantitative “void” proxy: when price travels far with unusually thin volume, the move is flagged as likely inefficient and prone to mean-reversion/mitigation.
█ How It Works
⚪ Volume Shock (Participation Filter)
Each bar, volume is compared to a rolling baseline. This is then z-scored.
// Volume Shock calculation
volTrend = ta.sma(volume, L)
vs = (volume > 0 and volTrend > 0) ? math.log(volume) - math.log(volTrend) : na
vsZ = zScore(vs, vzLen) // z-scored volume shock
lowVS = (vsZ <= vzThr) // low-volume condition
Bars with VolShock Z ≤ threshold are treated as low-volume (thin).
⚪ Prior Return Extremeness
The 1-bar log return is computed and z-scored.
// Prior return extremeness
r1 = math.log(close / close )
retZ = zScore(r1, rLen) // z-scored prior return
This shows whether the latest move is unusually large relative to recent history.
⚪ Void Oscillator
The oscillator is:
// Oscillator construction
weight = lowVS ? 1.0 : fadeNoLow
osc = retZ * weight
where Weight = 1 when volume is low, otherwise fades toward a user-set factor (0–1).
Osc > 0: up-move emphasized under low volume ⇒ Buy-Side Imbalance.
Osc < 0: down-move emphasized under low volume ⇒ Sell-Side Imbalance.
█ Why Use It
⚪ Targets Inefficient Moves
By filtering for low participation, the oscillator focuses on moves most likely driven by thin books/noise trading, which are statistically more likely to retrace.
⚪ Simple, Robust Logic
No need for tick data or order-book depth. It derives a practical void proxy from OHLCV, making it portable across assets and timeframes.
⚪ Complements Price-Action Tools
Use alongside FVG/imbalance zones, key levels, and volume profile to prioritize voids that carry the highest reversal probability.
█ How to Use
Sell-Side Imbalance = aggressive sell move (price goes down on low volume) → expect price to move up to fill it.
Buy-Side Imbalance = aggressive buy move (price goes up on low volume) → expect price to move down to fill it.
█ Settings
Volume Baseline Length — Bars for the volume trend used in VolShock. Larger = smoother baseline, fewer low-volume flags.
Vol Shock Z-Score Lookback — Bars to standardize VolShock; larger = smoother, fewer extremes.
Low-Volume Threshold (VolShock Z ≤) — Defines “thin participation.” Typical: −0.5 to −1.0.
Return Z-Score Lookback — Bars to standardize the 1-bar log return; larger = smoother “extremeness” measure.
Fade When Volume Not Low (0–1) — Weight applied when volume is not low. 0.00 = ignore non-low-volume bars entirely. 1.00 = treat volume condition as irrelevant (pure return extremeness).
Upper Threshold (Osc ≥) — Trigger for Sell-Side Imbalance (void below).
Lower Threshold (Osc ≤) — Trigger for Buy-Side Imbalance (void above).
-----------------
Disclaimer
The content provided in my scripts, indicators, ideas, algorithms, and systems is for educational and informational purposes only. It does not constitute financial advice, investment recommendations, or a solicitation to buy or sell any financial instruments. I will not accept liability for any loss or damage, including without limitation any loss of profit, which may arise directly or indirectly from the use of or reliance on such information.
All investments involve risk, and the past performance of a security, industry, sector, market, financial product, trading strategy, backtest, or individual's trading does not guarantee future results or returns. Investors are fully responsible for any investment decisions they make. Such decisions should be based solely on an evaluation of their financial circumstances, investment objectives, risk tolerance, and liquidity needs.
