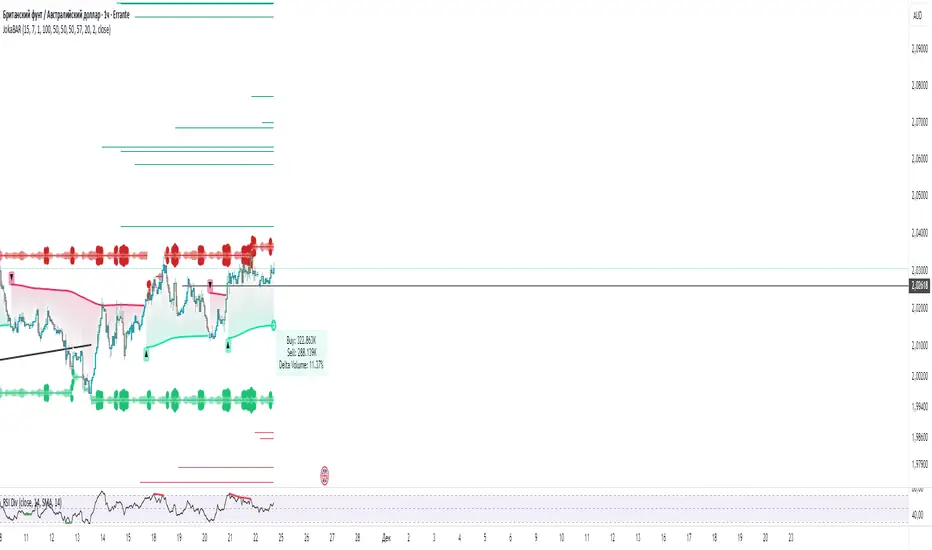
Delta Volume BubblesDelta Volume Bubbles
Visualize order flow delta at specific price levels with automatic threshold detection
Overview
Delta Volume Bubbles is an order flow indicator that displays volume delta at individual price levels within each candle, rather than showing aggregate candle delta. This level-by-level analysis shows where buying and selling pressure is concentrated, helping identify key support and resistance zones based on actual order flow.
Key Features
Level-Based Delta Calculation : Unlike traditional delta indicators that show total candle delta, this indicator calculates and displays delta for each price level within the candle's range, providing granular order flow information.
Automatic Threshold Detection : The indicator automatically calculates dynamic thresholds using a rolling window analysis (similar to volume spike detection). Three threshold levels are determined:
2.5x average delta (normal bubbles)
3.5x average delta (large bubbles)
5.0x average delta and above (huge bubbles)
Intrabar Analysis : Uses lower timeframe intrabar data to calculate delta for each price level. The indicator automatically selects the appropriate lower timeframe based on your chart timeframe.
Delta Calculation : Uses proprietary delta deduction logic that considers:
Candle body size and range
Upper and lower shadows (wicks)
Body-to-range ratio
Price action characteristics
Proportional Delta Distribution : When an intrabar crosses multiple price levels, its delta is distributed proportionally based on the overlap between the intrabar's range and each level.
Dynamic Level Sizing : Price levels are calculated using ATR (Average True Range) divided by 10, with a minimum of the symbol's minimum tick size.
Visual Bubble Sizes : Three distinct bubble sizes correspond to the three threshold multipliers, indicating the magnitude of delta at each level.
Color Coding :
Green bubbles indicate bullish delta (buying pressure)
Red bubbles indicate bearish delta (selling pressure)
Optional Labels : Display delta values directly on bubbles with K/M/B formatting (K for thousands, M for millions, B for billions).
How It Works
Level Creation : For each confirmed candle, the indicator divides the price range into multiple levels based on ATR calculations. Each level represents a specific price zone within the candle.
Intrabar Data Collection : The indicator requests lower timeframe intrabar data (OHLCV) to analyze price action within the main candle. The lower timeframe is automatically selected based on your chart timeframe.
Delta Calculation : For each intrabar, the indicator calculates delta using proprietary logic that considers body size, wicks, and price action characteristics.
Level Distribution : Each intrabar's delta is distributed across all price levels it crosses, proportionally based on the overlap between the intrabar's range and each level.
Threshold Calculation : The indicator maintains a rolling window of maximum deltas from previous candles (last 300 bars). It calculates separate averages for positive and negative deltas, then applies multipliers (2.5x, 3.5x, 5.0x) to determine thresholds.
Bubble Display : Only price levels with delta exceeding the 2.5x threshold are displayed as bubbles. The bubble size indicates which threshold was exceeded:
Normal size = 2.5x threshold
Large size = 3.5x threshold
Huge size = 5.0x+ threshold
Label Display : If enabled, labels show the exact delta value for each displayed bubble, formatted with K/M/B notation for readability.
Use Cases
Support and Resistance Identification : Large delta concentrations at specific price levels often indicate significant support or resistance zones where institutional traders are active.
Order Flow Analysis : Understand where buying and selling pressure is concentrated within each candle, helping identify potential reversal or continuation zones.
Entry and Exit Timing : Use delta bubbles to identify optimal entry and exit points based on actual order flow, not just price action.
Market Structure Analysis : Identify key price levels where significant order flow activity occurs, helping understand market structure and potential price reactions.
Confirmation Tool : Combine with other technical analysis tools to confirm signals. For example, a bullish delta bubble at a support level can confirm a potential bounce.
Settings
Show Delta Bubbles : Toggle to enable/disable bubble display
Show Numbers in Bubbles : Toggle to show/hide delta value labels
Bullish Delta Color : Customize color for bullish (positive) delta bubbles
Bearish Delta Color : Customize color for bearish (negative) delta bubbles
Technical Notes
The indicator uses barstate.isconfirmed to ensure calculations only occur on confirmed bars, preventing repainting.
Thresholds are calculated automatically and adapt to market conditions.
The rolling window maintains the last 610 maximum deltas for threshold calculations.
Level size is calculated using ATR(14) divided by 10, adapting to current market volatility.
Delta distribution uses proportional overlap calculations when intrabars cross multiple levels.
Best Practices
Use on timeframes where intrabar data is available (typically 5 minutes and above for most symbols).
Combine with price action analysis - delta bubbles show where order flow is concentrated, but price action confirms the significance.
Look for clusters of bubbles at similar price levels - multiple bubbles at the same level may indicate support or resistance.
Pay attention to bubble sizes - larger bubbles indicate higher order flow activity.
Use in conjunction with other order flow tools for comprehensive market analysis.
This indicator breaks down delta into price levels, providing level-by-level order flow information based on market microstructure.
Volumedelta

JokaBAR
This script combines my own liquidity/liq-levels engine with open-source code from BigBeluga’s Volumatic indicators:
• “Volumatic Variable Index Dynamic Average ”
• “Volumatic Support/Resistance Levels ”
The original code is published under the Mozilla Public License 2.0 and is reused here accordingly.
What this script does
Joka puts Volumatic trend logic, dynamic support/resistance and a custom liquidation-levels module into a single overlay. The idea is to give traders one clean view of trend direction, key reactive zones and potential liquidation areas where leveraged positions can be forced out of the market.
Volumatic logic is used to build a dynamic average and adaptive levels that react to volume and volatility. On top of that, the script plots configurable liquidation zones for different leverage tiers (e.g. 5x, 10x, 25x, 50x, 100x).
How to use it
Apply the script on pairs where leverage is actually used (perpetual futures / margin).
Use the Volumatic average as a trend filter (above = long bias, below = short bias).
Treat Volumatic support/resistance levels as key reaction zones for entries, partials and stops.
Read the liquidation levels as context: clusters show where forced liquidations can fuel strong moves and bounces.
Keep the chart clean — this tool is designed to be used without stacking extra indicators on top.
The script is published as open-source in line with TradingView House Rules so that other traders can study, tweak and build on it.
VIDYA + MA Cloud + Volume Chaser Co-Pilot + Duration+TRPThis indicator has been designed to automate entries and exits, combining a unique set of volume indicators for entry conditions, and another set of probability indicators for exit conditions.
Entry Conditions:
-VIDYA (Volumatic Variable Index Dynamic Average) Indicator for the over-arching trend
-EMA/RMA cloud is the dynamic trend confirmation. A crossover confirms entry conditions when in-line with the VIDYA trend.
-MTF VIDYA Dashboard is our visual confirmation of volume
-Co-pilot monitors LTF volume and exits or re-enters depending on the 3 LTF confluences
Exit Conditions:
-Trend Duration Forecast - Altered the Hull MA to calculate previous VIDYA trend lengths and averages it out to forecast current trend
-Trend Reversal Probability - Altered to work with the duration forecast. It's the primary source of information for exits which overrides the VIDYA trend (which can be lagging)
-Co-Pilot monitors delta volume changing on the LTF's for quick exits
The trend length probability bar is driven by trend length, not reversal probability. Coloured green for early trends, orange for mature trends, and red for expired trends. This gives a visual for when to look for other exit confluences, especially when a trend has exceeded its average duration and is aligned with the reversal probability %.
Candles are coloured dependent on the EMA/RMA cloud. Green above, White within, Red below.

Delta Hawk CVD DivergencesCustomized Cumulative Volume Delta indicator that automatically labels divergences over a set number of bars.

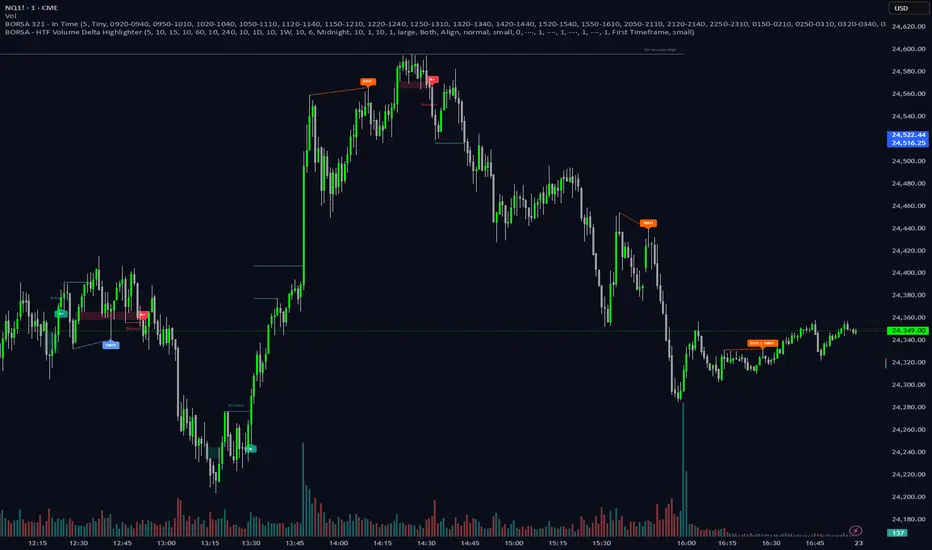
BORSA 321 - HTF Volume Delta Highlighter Overview
HTF Volume Delta Highlighter is a multi-timeframe tool that builds a compact higher-timeframe (HTF) candle panel on the right side of your chart and injects volume delta, fair value gaps (FVG) and volume imbalance (VI) directly into those candles.
Instead of constantly switching charts, you see:
Where buy vs sell volume is dominating on HTF
Which HTF candles left inefficiencies (FVG / VI)
Key open / high / low / close levels projected back onto your current timeframe
How much time is left for each HTF candle to close
All of this lives visually on your current chart, making it perfect for scalpers and intraday traders who rely on higher-timeframe context.
What It Shows
For up to six higher timeframes (default: 5m, 15m, 1H, 4H, 1D, 1W), the indicator plots:
1. HTF Candle Panel on the Right
Each HTF is drawn as a mini candle strip to the right of price.
You can control:
How many candles per HTF to display
Space between candles
Space between timeframes
Overall offset from current price
This creates a clean HTF “dashboard” without touching your main candles.
2. Volume Delta Inside Each HTF Candle
When delta mode is enabled:
Each HTF candle body is split into:
Buy volume segment (green)
Sell volume segment (red)
The split is proportional to cumulative buy vs sell volume across the entire HTF period.
Optionally, the delta value itself (buy volume − sell volume) is printed:
Positive delta inside the buy segment
Negative delta inside the sell segment
This gives a visual and numeric read of who is in control on that higher timeframe.
3. HTF Fair Value Gaps (FVG)
Within each HTF strip, the script detects and highlights fair value gaps:
Bullish FVG: shaded with a green tone, optionally labeled FVG+
Bearish FVG: shaded with a red tone, optionally labeled FVG-
A line is also drawn through the midpoint of the FVG zone.
These zones quickly show where price left inefficiencies on the higher timeframe that may act as magnets or reaction levels.
4. Volume Imbalance (VI) Zones
Between consecutive HTF candles, the script also marks volume imbalance zones:
Bullish VI zones shaded green (VI+)
Bearish VI zones shaded red (VI-)
These highlight thin or aggressively traded areas that often attract future interaction.
5. Trace Lines Back to Your Main Chart
From the most recent HTF candles, the indicator can project horizontal trace lines:
From Open, High, Low, Close of the monitored HTF candle
With separate styling for each (color, line style, width)
Optional price labels at the right edge for each level
You can choose whether these traces are anchored to the first selected timeframe or the last timeframe, giving you flexibility in what levels matter most.
6. Timeframe & Timer Labels
For each HTF strip, the indicator can show:
Timeframe label (e.g., 5m, 15m, 1H, 4H, 1D, 1W)
Countdown timer for the current HTF candle (time remaining until close)
Labels can appear at the top, bottom, or both ends of the HTF panel.
You can choose whether labels align across all HTFs or follow each strip’s own high/low.
7. Custom Daily Session Handling
For the daily timeframe, you can override the default daily open to match your session preference:
Midnight (standard calendar day)
08:30 New York time
09:30 New York time
The script then treats that custom time as the start of your “daily” candle — useful for traders who sync with cash session opens.
8. Day of Week Labels (For Daily)
On daily HTF candles, you can optionally print a day-of-week letter above the candle:
M, T, W, T, F, S, S
This gives a quick sense of where in the week the current candle sits.
Key Inputs & Customization
HTF 1–6 Enable & Timeframe
Turn each HTF strip on/off
Set timeframe (5m, 15m, 1H, 4H, 1D, 1W, etc.)
Choose how many candles per HTF to display
Max Sets
Limit how many HTFs are shown at once (e.g., only next 3 HTFs).
Styling
Body, border, and wick colors for bullish and bearish candles
Candle width, spacing, and panel offset
Label colors and sizes
Delta Settings
Toggle delta mode on/off
Toggle delta values text inside candles
Imbalance Settings
Toggle FVG on/off, with bullish/bearish colors, labels
Toggle Volume Imbalance on/off, with bullish/bearish colors, labels
Control label text size
Trace Settings
Turn trace lines on/off
Customize style, color, and thickness for O/H/L/C
Choose whether to anchor traces to the first or last timeframe
Label & Timer Settings
Enable/disable HTF labels and timers
Choose label position: Top / Bottom / Both
Alignment mode: Align all strips or Follow Candles
If the chosen HTF isn’t valid for the current chart (not a proper multiple or too low), the script will show a clear on-chart message telling you to increase your chart timeframe to match the selected HTF requirements.
How It Helps Traders
Scalpers & intraday traders can stay on their low timeframe (e.g., 1m / 3m / 5m) while still seeing:
Where HTF buy/sell volume is dominant
Which HTF candles left inefficiencies that may later act as magnets or rejection zones
The exact HTF O/H/L/C levels currently active
How much time remains before the HTF bar closes (key for timing entries around closes).
Swing traders can use it to track daily and weekly HTF structure and delta while drilling down to lower timeframes for precise execution.
Volume Delta PROThis indicator show delta moves and producing it in a way that you can see what MADE the delta - buyers or sellers.
Important delta candles are also marked.
I also shows average delta and can be adjusted by reading data from lower time frames.

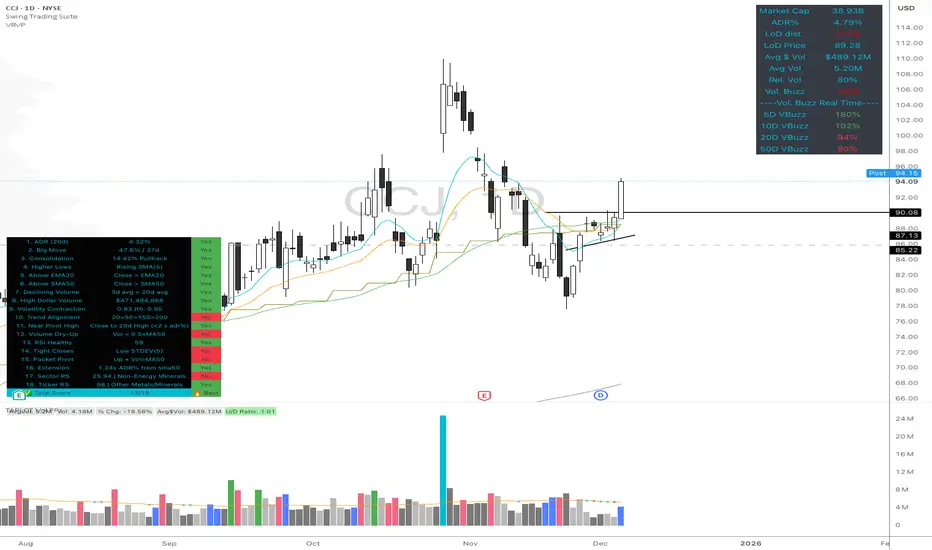
High Quality Setup Detector (Ultimate Edition)High Quality Setup Detector (Ultimate Edition)
A complete, rules-based detector for identifying elite high-probability trading setups based on volatility contraction, trend alignment, volume behavior, RS strength, and classic breakout conditions.
This script consolidates multiple proven technical concepts into one unified scoring system — giving traders a fast, objective way to evaluate the overall quality of any chart.
🔍 What This Tool Does
The indicator evaluates 16–18 technical conditions (depending on whether RS is enabled) and assigns each chart a Total Quality Score.
You instantly see:
✔ ADR volatility quality
✔ Big move + constructive pullback
✔ Higher lows (constructive structure)
✔ Trend alignment (20/50/150/200)
✔ Dollar volume strength
✔ Volatility contraction (ATR ratio)
✔ Volume dry-up before breakout
✔ RSI health
✔ Pocket pivot
✔ Extension from the 50-day
✔ Near pivot high
✔ Optional: Sector RS + Ticker RS
The result appears in a clean, color-coded table displayed on-chart.
🎯 Scoring System
Every condition is worth 1 point.
Based on your total score:
🔥 Best Setup — high probability
🟡 Good Setup — decent but not top-tier
🔴 Weak — avoid
This helps keep you disciplined and objective, even during choppy markets.
📊 RS Rating System (Optional)
Enable RS to compute:
Sector RS strength using mapped sector ETFs
Ticker RS strength using a percentile-based multi-quarter performance model
Both follow a full 1–99 rating scale.
🧩 Customizable Display
Adjustable text size (Tiny → Huge)
Clean 3-column diagnostics table
Organized into logical categories (Trend, Volume, Volatility, RS, etc.)
💡 Ideal For
Growth traders
Breakout traders
VCP / volatility contraction pattern traders
Swing traders who want rule-based confirmation
Anyone who wants structured, systematic chart evaluation
Nifty Options CVD ChainNifty Options CVD Chain – Professional Strike-Level Volume Delta Tool
Nifty Options CVD Chain provides a clear and reliable view of option-side volume pressure by showing True TradingView CVD (Cumulative Volume Delta) for the most active NIFTY option strikes.
This tool is designed for traders who monitor option flow to understand market sentiment, absorption, and directional bias more effectively.
How It Works
The script automatically detects the ATM (At-The-Money) strike from the underlying NIFTY price and evaluates the two most liquid surrounding levels:
ATM CE & ATM PE
ATM +100 CE & ATM +100 PE
ATM –100 CE & ATM –100 PE
These ±100 strikes are typically the most traded, providing meaningful data for flow-based decision making.
All values are retrieved using TradingView’s native ta.requestVolumeDelta(), ensuring the same precision and methodology as the official CVD indicator.
Key Features
✔ True TV CVD (No approximations)
The indicator uses TradingView’s built-in algorithm for up/down volume classification.
No custom delta logic, no recalculated volume, and no synthetic estimations.
✔ Strike-Level Volume Delta Table
A clean, compact table overlay shows CVD for each strike, formatted in a professional K/M/B style with two-decimal accuracy.
✔ Automatic Strike Selection
ATM detection is based on the underlying symbol (NSE:NIFTY) and adapts automatically as price moves.
✔ Clear Market Insights
This tool helps you read:
CE vs PE volume imbalance
Short-term sentiment shifts
Absorption at key option levels
Flow-based trend continuation or exhaustion
Best For
Intraday & positional index traders
Option flow and order-flow interpreters
Traders who track CE/PE dominance
Anyone wanting a quick read of market pressure without scanning the full option chain
Notes
This indicator displays CVD ONLY for the selected strikes; it is not a full option chain.
Values depend on data availability from the NSE feed.
For best results, pair with your preferred price action or trend tools.

Delta Volume RSI1. Introduction
The Delta Volume RSI (Relative Strength Index based on Volume Delta) indicator provides a unique perspective on market momentum by analyzing the average gains and losses of the volume delta —the difference between buying and selling volume—over a specified period. Unlike traditional RSI, which focuses on price changes, this indicator evaluates shifts in market participation intensity, helping traders detect periods of accumulation and distribution through volume action.
2. Key Features
- Volume-Based Calculation: Computes RSI using the average gains and losses of delta volume rather than price changes, offering insights into buying/selling pressure.
- Dynamic Color Coding: Paints the indicator line green when above the 50 level, and red when below, enabling quick visual identification of momentum shifts around neutrality.
- Reference Levels: Clearly displays overbought (70), neutral (50), and oversold (30) lines for context on volume-driven market extremes.
- Customizable Period: Users can set the period for RSI calculation to fit their trading style and timeframe preferences.
3. How to Use
1. Interpret Colors: The indicator line turns green when volume delta momentum is bullish (above 50) and red when bearish (below 50). Overbought and oversold zones (above 70 or below 30) may highlight exhaustion in volume-driven pushes.
2. Adjustment: Modify the RSI period in the settings to tailor responsiveness.
3. Reference Line: Use the dashed gray line at 50 as a core threshold for detecting transitions between buyer and seller dominance.
How It Differs From Standard RSI
The standard RSI uses changes in closing price to calculate market momentum. In contrast, this indicator calculates RSI using the average gains and losses of the delta volume , capturing underlying shifts in buying and selling activity—even when price is flat. This makes the Delta Volume RSI especially useful for identifying divergence between volume flow and price movement, potentially signaling strong accumulation/distribution or market reversals not visible on price-based RSI alone.

Strong Candle and Probability Levels Light [SYNC & TRADE]Indicator Description: "Strong Candle and Probability Levels Light "
Core Philosophy: This indicator is not just a collection of random signals. It is a complete trading system built around two core concepts: Strength (Volume-based Candles) and Probability (Fibonacci Levels), synchronized between spot and futures markets to filter out noise and manipulations.
🎯 The "Strong Candle Defense" Strategy
The primary tactic is to enter in the direction of the market's dominant force at an optimal price.
1. Identifying Strength: The indicator identifies "Strong Candles" in real-time — candles with anomalously high volume and significant delta (buyer/seller dominance), confirmed across multiple timeframes. They are marked with circles (blue for bullish, red for bearish) and Z-level labels showing the statistical significance of the move.
2. "Ladder" Entry: We do not chase the market. The strategy is to wait for a pullback (retest) to the body of the strong candle or its key internal Fibonacci levels (38.2%, 50%, 61.8%) for a favorable entry. The position is built in parts ("scaling in") as the bounce is confirmed.
3. Profit-Taking Targets: The main take-profit targets are set at the external Fibonacci extension levels:
First Target: 161.8% — The classic level to secure the first portion of profits.
Second Target: 261.8% (or 227% in Light mode) — The level for capturing extended moves, where the remaining position is exited.
Refined Stop-Loss Rules and Strategy Invalidation Conditions:
Primary Stop-Loss: Placed beyond the extreme of the strong candle (the Fibonacci grid's 0% level). For a long position — below the strong candle's low; for a short position — above its high.
Strategy Invalidation Criterion: The strategy is considered invalidated, and the position should be exited, if the price closes a candle's body beyond the key protective level. This specifically means:
For a Long: A candle closes (the close price) below the low of the strong candle.
For a Short: A candle closes (the close price) above the high of the strong candle.
This criterion, especially on lower timeframes, provides a stricter and more timely signal of a setup failure than a mere wick break.
Alternative Supertrend Stop-Loss: The proprietary Supertrend line can be used as a dynamic trailing stop. The stop-loss is placed behind the Supertrend line, and a candle close beyond this line also signals a trend violation and the need to exit the position.
📊 Unique Automated Fibonacci Grids
Our Fibonacci grids are not the standard, static drawing tool. They are a dynamic profit-taking and management system.
Automatic Plotting: A new grid is automatically drawn on every new strong candle, freeing the trader from manual work.
Smart Management:
Self-Cleaning: When enabled, the grid automatically removes itself after the price has fully "filled" its range (reached the 0% level), preventing chart clutter.
Dynamic Levels: Depending on the selected type (Fibonacci Light, Standard, Extended, Geometric), a different set of internal and external levels is plotted, adapting the tool to various trading styles from scalping to position trading.
Key Difference from Standard Tools: Unlike the basic Fibonacci tool, our grids are an integral part of the trading logic. They are tied to strong candles (high-probability points), update automatically, and act as an execution system for the strategy, not just an analysis tool.
📈 Proprietary Supertrend with Advanced Filtering
We do not use the standard, off-the-shelf Supertrend. Our version is a hybrid algorithm, supercharged with volume analysis.
Dynamic ATR Multiplier: The indicator's multiplier adapts to market conditions. During high volume delta (strong buying/selling pressure), the multiplier increases, making the trend line less sensitive and helping you stay in the trade during strong impulses.
Strong Candle Filter: Supertrend signal changes can be optionally restricted to confirm only on strong candles. This drastically reduces false entries. The trend doesn't change just based on volatility (ATR), but upon confirmation by real strength (volume).
Profit Potential: Combining signals from this filtered Supertrend with the "Strong Candle Defense" strategy allows for precise entry timing in the direction of the major trend, with clear and statistically sound profit targets.
⚙️ Additional Systems for Enhanced Accuracy
Spot & Futures Sync: The indicator compares strength between spot and futures markets. A divergence (e.g., a strong long candle on spot but weakness on futures) is marked as a potential "Manipulation" (X), warning you of an unreliable signal.
Multi-Timeframe Volume Analysis: Delta and volume are analyzed from lower timeframes, providing a more granular picture within a single candle of your current TF.
Supertrend Table: A quick overview of the trend direction across all major timeframes (from 5m to 1W) in a single table.
Conclusion:
The "Strong Candle and Probability Levels Light" indicator is a professional suite for traders who want to trade not just signals, but probabilities. The strategy, built around defending strong candles, combined with unique automated Fibonacci grids and an adaptive Supertrend, provides a clear plan from entry to exit. The use of market synchronization and multi-timeframe volume analysis minimizes noise and false signals, allowing you to focus on high-quality setups.

Delta Manipulation FootprintIntroduction
The Delta Manipulation Footprint indicator highlights significant shifts in volume delta between consecutive candles, helping traders visually identify potential market manipulation or strong buying/selling pressure. By analyzing the difference in buy and sell volume (delta) and its changes over time, this indicator reveals aggressive market behavior often associated with big players.
Key Features
- Calculates the absolute difference of volume delta between candles, maintaining the direction of change.
- Uses a customizable moving average and threshold multiplier to filter meaningful volume shifts.
- Colors candles green when delta difference is notably increasing, and red when decreasing, for clear visual signals.
- Fully overlays the main price chart, painting candles directly for intuitive interpretation.
How to Use
Apply this indicator to your price chart to instantly visualize periods of significant volume delta shifts. Look for green candles signaling rising buying pressure and red candles showing increasing selling pressure. Adjust the moving average length and threshold multiplier inputs to tune sensitivity to your trading style or particular market behavior. Use in conjunction with other price action and volume indicators to confirm signals and improve trade timing.
This tool is ideal for traders aiming to spot footprint-like manipulations in volume delta, aiding in the detection of institutional activity and potential market turning points.

150% Volume Surge1M charts show 150% volume surge to confirm scalping oppos in the direction of the general trend.

CVD Absorption/Exhaustion IndicatorCVD Absorption/Exhaustion Indicator – Explanation
This indicator identifies trading opportunities by analyzing the relationship between price action and Cumulative Volume Delta (CVD) at key pivot points. It implements a professional trading framework that distinguishes between tradeable continuation signals (Absorption) and potential reversal warnings (Exhaustion).
Part 1: Foundation – CVD Calculation
The indicator starts by calculating Cumulative Volume Delta using the Bull & Bear Balance formula:
Volume Pressure Calculation
Bull Power: Measures buying pressure based on candlestick characteristics
Bear Power: Measures selling pressure using the same methodology
Volume Split: Each bar's volume is proportionally divided between bull and bear pressure
Delta: bullVolume - bearVolume (net buying vs selling per bar)
CVD: Running total (ta.cum(delta)) that shows cumulative market order flow
On the chart: Yellow line = raw CVD. White line = optional SMA (20-period default). Fill color = teal when CVD > MA (bullish flow), red when below (bearish flow).
Part 2: Signal Logic – Pivot Detection
The indicator identifies pivot points on the CVD line (not price) using lookback parameters:
Left Bars (lbL=1): Minimum bars to left to form pivot
Right Bars (lbR=2): Bars to right to confirm pivot (also creates offset)
Range Validation
Pivot signals only trigger if the distance between consecutive pivots is between 5-60 bars (adjustable). This filters out noise and ensures meaningful divergence patterns.
Part 3: Trading Framework
The core innovation is distinguishing two signal types at each pivot:
🟢 BULLISH SIGNALS (at CVD Pivot Lows)
Table
Copy
Signal Type Price Action CVD Action Trading Action Color
Exhaustion Lower Low (LL) Higher Low (HL) AVOID - Reversal warning Transparent Gray
Absorption Higher Low (HL) Lower Low (LL) TRADE - Continuation likely Solid Green
🔴 BEARISH SIGNALS (at CVD Pivot Highs)
Table
Copy
Signal Type Price Action CVD Action Trading Action Color
Exhaustion Higher High (HH) Lower High (LH) AVOID - Reversal warning Transparent Gray
Absorption Lower High (LH) Higher High (HH) TRADE - Continuation likely Solid Red
Part 4: Visualization Mechanism
The indicator uses precision plotting for clarity:
Pivot Lines: Thin vertical lines appear exactly at the pivot bar using offset=-lbR (shifts plot back to correct location)
Conditional Coloring: Lines are transparent (noneColor) unless a valid signal exists
Minimal Labels: Single letters "E" (Exhaustion) or "A" (Absorption) in tiny size to avoid chart clutter
Direction: Labels appear above the line for bullish signals, below for bearish signals
Part 5: How to Read the Chart
Signal Quality Hierarchy
Solid Green/Red lines with "A" = Primary trade signals (Absorption/Continuation)
Transparent Gray lines with "E" = Warning signals (Exhaustion/Reversal) - use for context or exit planning
No lines at pivots = No valid pattern - ignore
Timeframe Usage
Best on: 5-minute to 1-hour charts (as per PDF)
Multi-timeframe: Use the dropdown in settings to analyze higher timeframe signals while trading lower timeframe
Practical Workflow
Wait for solid color "A" signal in the direction of the trend
Confirm with price action (e.g., support/resistance break)
Use "E" signals as profit targets or trend exhaustion warnings
Never trade Exhaustion signals alone – they indicate potential reversals, not entries
Alert System
Four distinct alerts fire on bar close with clear messages:
Exhaustion Bullish: "Price:LL, CVD:HL (Reversal)"
Absorption Bullish: "Price:HL, CVD:LL (Continuation)"
Exhaustion Bearish: "Price:HH, CVD:LH (Reversal)"
Absorption Bearish: "Price:LH, CVD:HH (Continuation)"

Order FlowSimple Order flow - table with sell volume, buy volume and delta. It requires premium (1second) or higher for getting volume from lower time frame.

Cumulative Delta Difference HistogramINTRODUCTION:
This "Cumulative Delta Difference Histogram" is a volume-based indicator that calculates the difference (delta) between aggressive buying volume and selling volume for each candle and then builds a cumulative momentum histogram with the following behavior:
Momentum Tracking: The indicator accumulates the delta values when the delta is positive and increasing, producing green bars whose height visually represents growing buying pressure momentum.
Negative Momentum Detection: When the delta becomes negative or starts to decline, the histogram bars turn red and the accumulation decreases, effectively showing increasing selling pressure momentum.
Directional Reset: On each change from positive to negative delta momentum or vice versa, the accumulator resets to zero, providing a clear and sharp visualization of shifts without persistence from previous trends.
Zero Reference Line: A horizontal zero line serves as a visual baseline to distinguish positive from negative momentum easily.
HOW TO USE:
To trade effectively using the "Cumulative Delta Difference Histogram," you compare the price action chart with the indicator to confirm momentum and detect potential reversals or continuations. Here's how to do it in practice:
Confirming Trends:
When the price is rising, look for the histogram bars to be green and increasing, indicating strong and growing buying pressure supporting the uptrend. If price rises but the histogram shows diminishing green bars or shifts to red, it could signal weakening momentum and a potential reversal.
Identifying Divergences:
Compare price highs/lows with histogram peaks. If price makes a new high but the histogram fails to make a corresponding new high (bearish divergence), it warns of a possible trend reversal. Conversely, if price makes a new low but histogram shows higher lows (bullish divergence), it signals potential bullish reversal.
Volume Confirmation:
The histogram reflects real-time volume aggression behind price moves. Confirmation of price breakouts or breakdowns by corresponding strong histogram colors and bar height increases adds reliability to signals.
By aligning price patterns and levels with the cumulative delta histogram's signals, traders gain a deeper understanding of market strength and better timing for trades.
This combined approach improves the accuracy of entries and exits beyond relying on price alone, especially in markets sensitive to order flow and volume dynamics.
Use this indicator with a default volume or with my other indicator "Agression Histogram" for a better reading.

Volume Pressure and PercentVPP Volume Pressure and Percentage Indicator with a Volume Trendline that indicates which side is driving the flow.
Features:
1. Buy/Sell Pressure Bars (Core Volume Split)
The indicator separates each candle’s volume into buy volume (green) above the zero line and sell volume (red) below it. This gives you a real-time visualization of which side is more aggressive within the current bar. Instead of waiting for prices to move or candles to close, you can instantly see whether buyers or sellers are stepping in.
2. Dynamic Total Volume (Invisible Histogram + Status Line Color)
The total volume of each bar is tracked behind the scenes and displayed in the pinned status line using a dynamic color—green when buyers dominate, red when sellers dominate. The histogram for total volume is invisible to keep the chart clean, but the total volume figure stays visible and changes color based on who is in control. This gives you instant confirmation of whether institutional-sized volume supports the direction shown by the buy/sell pressure, which is especially valuable when evaluating the risk or conviction behind a potential entry.
3. Percentage Mode (% of Bar Volume)
When toggled on, the indicator converts each bar into percent buy vs percent sell, normalizing all flow to a 0–100% scale. This mode is incredibly useful when comparing pressure across different times of day, gaps, or varying volume conditions—such as early morning spikes versus lunchtime chop. By removing absolute volume from the equation, you gain a clean look at the actual imbalance between buyers and sellers.
4. 70% Pressure Band (Imbalance Threshold Zone)
In percentage mode, the indicator displays a subtle 70% band (a light gray zone) above and below the zero line, showing where buy or sell pressure reaches extreme dominance (≥70%). When a bar’s buy or sell percentage enters this zone, it highlights moments of exhaustion, acceleration, or potential reversal. The band acts like a real-time overbought/oversold gauge specifically for volume imbalance, not price.
5. Trend Line (Net Pressure Trend / Reversal Detector)
The trend line smooths out the net volume pressure (buy volume minus sell volume or its percentage equivalent) and shows the overall direction of order flow. When the line slopes upward, buyers are gaining control; when it slopes downward, sellers are taking over. This trend line acts as a real-time momentum indicator based directly on flow rather than price. Because it reacts quickly to intrabar shifts in buy/sell pressure, it often turns before price does—giving you a measurable timing edge.
6. Auto-Selecting Trend Source (Volume Net, Percent Net, or CVD)
The indicator lets you choose how the trend line is calculated: Volume Net (buy minus sell volume), Percent Net (normalized imbalance), or CVD (Cumulative Volume Delta) for long-term flow bias. The default “Auto” mode automatically switches between Volume Net and Percent Net depending on which view you’re using. This flexibility allows the trend line to remain meaningful whether you’re analyzing raw volume or normalized percentage data.
7. Pinned (Status Line) Totals in K/M/B Format
Regardless of whether you’re in volume or percentage mode, the indicator always displays Total Volume, Buy Volume, and Sell Volume in the status line using abbreviated K, M, B formatting. These values update in real time and are color-coded: green for bullish dominance, red for bearish. This gives you a concise snapshot of order flow strength on every bar.
---------------------
How To Use:
Support Level Zones
• Watch for Buy bars increasing + Trend line flipping up right at or slightly below support.
• This often signals absorption — market makers filling large buy orders before reversal.
• Confirmation: Price reclaims VWAP ... enter calls / longs.
Resistance Level Zones
• Watch for Sell bars increasing + Trend line flattening/turning down near resistance.
• This signals distribution or stop runs.
• Confirmation: Price rejects VWAP ... enter puts / shorts.
Breakout Traps
• Sometimes you’ll see price break a level, but the flow doesn’t confirm (buy volume doesn’t expand).
• That’s a false breakout — fade it with options opposite the move.

Scalping Dashboard - Volume Candles + Liquidity ZonesScalping Dashboard - Volume Candles + Liquidity Zones
📊 Overview
A comprehensive scalping indicator designed for high-frequency traders on 1-5 minute timeframes. This all-in-one dashboard combines volume analysis, order flow metrics, technical indicators, and institutional liquidity zones to identify high-probability scalping opportunities.
🎯 Key Features
✅ Multi-Timeframe Analysis
Fast MACD (5/13/5) for momentum
Quick EMAs (9/20/50) for trend direction
Rapid Stochastic (5/3/3) for oversold/overbought conditions
Fast RSI (7) for extreme readings
✅ Advanced Order Flow Metrics
CVD (Cumulative Volume Delta): Tracks buy vs sell pressure over time
Delta Momentum: Measures acceleration in buying/selling
Buy/Sell Pressure Ratio: Real-time balance of market forces
Order Flow Imbalance: Detects aggressive buying or selling
Tape Speed: Measures how fast volume is hitting the market
✅ Institutional Liquidity Zones
Buy-Side Liquidity: Areas above price where short stop losses cluster
Sell-Side Liquidity: Areas below price where long stop losses cluster
Liquidity Sweeps: Detects "stop hunts" by institutions before reversals
✅ Volume-Based Candle Coloring
Visual representation of volume intensity
Extreme, High, Normal, and Low volume categories
Fully customizable color schemes
✅ Dynamic Support/Resistance
Volume-weighted price levels
Automatically updates every 3 bars
Shows distance to key levels
📈 Dashboard Indicators Explained
The bottom-left dashboard displays 14 real-time metrics:
▸ MACD (●)
Green = Bullish momentum
Red = Bearish momentum
Gray = Neutral
▸ Supp (Price)
Support level
Green highlight = at support (good for long entry)
▸ Res (Price)
Resistance level
Orange highlight = at resistance (good for short entry)
▸ EMA (●)
Green = Price above EMAs (bullish)
Red = Price below EMAs (bearish)
▸ Stoch (●)
Green = Oversold (<20)
Red = Overbought (>80)
Gray = Neutral
▸ RSI (●)
Green = Oversold (<30)
Red = Overbought (>70)
Gray = Neutral
▸ CVD (●)
Green = Cumulative buying pressure
Red = Cumulative selling pressure
▸ ΔCVD (●)
Green = Increasing buy pressure
Red = Increasing sell pressure
▸ Imbal (●)
Green = Buy imbalance (>2:1 ratio)
Red = Sell imbalance
▸ Vol (●)
Green/Yellow background = Volume surge (>2x average)
▸ Tape (●)
Green/Yellow background = Fast tape (>1.5x speed)
▸ Liq (↑↓●)
↑ = Bullish sweep or near sell-side liquidity
↓ = Bearish sweep or near buy-side liquidity
● = Neutral
▸ Score (#L or #S)
Quality score (0-8) for Long or Short setups
Higher numbers = Better quality trade
▸ SCALP (LONG/SHORT/WAIT)
Primary signal
Bright color = High quality (score ≥5)
Dim color = Decent quality (score =4)
Gray = Wait for better setup
🎨 Candle Color System
Volume-Based Colors
Bright Green/Red: Extreme volume (>2.5x average) - Major moves
Medium Green/Red: High volume (>1.5x average) - Strong activity
Dull Green/Red: Normal volume - Standard market activity
Gray: Low volume (<0.5x average) - Avoid trading
Signal-Based Colors
Lime: Strong Long signal (score ≥5)
Green: Decent Long signal (score =4)
Orange: Strong Short signal (score ≥5)
Red: Decent Short signal (score =4)
Candle Color Modes (adjustable in settings):
Volume Only: Pure volume intensity
Volume + Signals: Signals override volume when present (default)
Signals Only: Only shows entry signals
🔵 Chart Indicators
Support & Resistance Lines
Green Line: Volume-weighted support level
Red Line: Volume-weighted resistance level
Lines update dynamically based on 100-bar volume profile
Liquidity Zones
Cyan Circles/Dashed Lines: Buy-side liquidity (above price)
Where short stop losses cluster
Potential targets for bullish moves
Institutions may push price here before reversing down
Magenta Circles/Dashed Lines: Sell-side liquidity (below price)
Where long stop losses cluster
Potential targets for bearish moves
Institutions may push price here before reversing up
Entry Markers
Large Green Triangle (▲): High quality long entry (score ≥5)
Small Green Triangle (▲): Decent long entry (score =4)
Large Orange Triangle (▼): High quality short entry (score ≥5)
Small Red Triangle (▼): Decent short entry (score =4)
Liquidity Sweep Markers
Cyan X-Cross (below bar): Bullish liquidity sweep - "LIQ↑"
Price swept sell-side liquidity and reversed up
Strong buy signal
Magenta X-Cross (above bar): Bearish liquidity sweep - "LIQ↓"
Price swept buy-side liquidity and reversed down
Strong sell signal
🎯 How to Use This Indicator
For Long Scalps (Buy):
Wait for Dashboard Signal: SCALP = "LONG" with score ≥5
Confirm Multiple Green Dots: Look for EMA, CVD, ΔCVD, Imbal all green
Check Volume: Vol or Tape should show yellow background (surge)
Look for Confluence:
Price at or near Support level (green highlight)
Price near Sell-Side Liquidity (magenta line below)
RSI oversold (green dot)
Large green triangle appears on chart
Best Entry: On a bullish liquidity sweep (cyan X-cross)
For Short Scalps (Sell):
Wait for Dashboard Signal: SCALP = "SHORT" with score ≥5
Confirm Multiple Red Dots: Look for EMA, CVD, ΔCVD, Imbal all red
Check Volume: Vol or Tape should show yellow background (surge)
Look for Confluence:
Price at or near Resistance level (orange highlight)
Price near Buy-Side Liquidity (cyan line above)
RSI overbought (red dot)
Large orange triangle appears on chart
Best Entry: On a bearish liquidity sweep (magenta X-cross)
Three Types of Scalping Setups:
1. Quick Scalp (Fastest - 1-5 minute holds)
MACD or Stochastic crossover + Volume surge
At Support/Resistance level
Score ≥4
2. Momentum Scalp (Ride the wave - 5-15 minute holds)
Strong EMA alignment + CVD slope positive
Order flow imbalance + Fast tape
Volume surge with price structure
Score ≥5
3. Reversal Scalp (Fade extremes - 3-10 minute holds)
Stochastic + RSI extreme readings
At Support/Resistance OR liquidity sweep
CVD momentum reversal
Score ≥6
⚙️ Recommended Settings
Timeframes
Primary: 1-minute, 2-minute, 5-minute
Confirmation: Use 15-minute chart for overall trend direction
Asset Types
Forex pairs (high liquidity)
Crypto (BTC, ETH with high volume)
Futures (ES, NQ)
Major stocks during market hours
Risk Management
Target: 1-3 times your stop loss
Stop Loss: Below nearest liquidity zone for longs, above for shorts
Position Size: Never risk more than 1% per trade
Score ≥5: Take full position size
Score =4: Take half position size or skip
🔧 Customization Options
Input Groups
MACD Settings
Fast Length: 5 (scalping optimized)
Slow Length: 13
Signal Length: 5
EMA Settings
EMA 9, 20, 50 (fast scalping EMAs)
Stochastic Settings
%K Length: 5
%D Smoothing: 3
Smooth: 3
CVD Settings
MA Length: 10 (for CVD smoothing)
RSI Settings
Length: 7 (fast RSI)
Overbought: 70
Oversold: 30
Volume Settings
MA Length: 10
Extreme Multiplier: 2.5x
High Multiplier: 1.5x
Low Multiplier: 0.5x
Liquidity Zone Settings
Lookback Periods: 20
Swing Strength: 3
Show Liquidity Zones: On/Off
Show Liquidity Sweeps: On/Off
Support/Resistance Settings
Volume Lookback: 100 bars (~2 hours on 1-min chart)
Order Flow Settings
Imbalance Threshold: 2.0 (2:1 ratio)
Color Customization
All volume colors customizable
All signal colors customizable
All liquidity colors customizable
📊 Volume Legend (Top Right)
The small table in the top-right corner shows the volume intensity key:
Extreme: >2.5x average volume
High: >1.5x average volume
Normal: 0.5x to 1.5x average volume
Low: <0.5x average volume
🔔 Built-in Alerts
Set up these alerts to never miss a trade:
High Quality Long Scalp: Triggers when entry_long and score ≥5
High Quality Short Scalp: Triggers when entry_short and score ≥5
Bullish Liquidity Sweep: Triggers when sell-side liquidity is swept
Bearish Liquidity Sweep: Triggers when buy-side liquidity is swept
To set up: Right-click chart → Add Alert → Select condition → Create
💡 Pro Tips
Understanding Liquidity Zones
Buy-Side Liquidity = Where shorts have their stops = Price tends to wick up here
Sell-Side Liquidity = Where longs have their stops = Price tends to wick down here
Liquidity Sweep = Institution triggers stops, absorbs liquidity, then reverses
Best trades = Enter AFTER the sweep when price reverses back
Reading the Dashboard
All Green Dots + Yellow Volume = Strong Long Setup
All Red Dots + Yellow Volume = Strong Short Setup
Mixed Colors = Choppy/Neutral = Wait
Score 6+ = Highest probability trades
Score 3 or less = Avoid
Confluence is Key
Never trade on a single indicator. Wait for:
Dashboard score ≥5
Volume surge (yellow background)
At support/resistance OR liquidity zone
CVD and momentum aligned
Price structure confirmation (triangle marker)
Avoid These Situations
❌ Low volume periods (gray candles)
❌ Dashboard shows "WAIT"
❌ Score below 4
❌ No volume surge during entry
❌ Trading against higher timeframe trend
Best Trading Sessions
Forex: London open (3-5 AM EST), NY open (8-10 AM EST)
Crypto: Works 24/7, best during high volume periods
Stocks: First hour (9:30-10:30 AM EST), last hour (3-4 PM EST)
Futures: US session open (9:30 AM EST)
🎓 Understanding the Scoring System
The indicator calculates a quality score (0-8) for both long and short setups:
+1 point for each:
EMA bias aligned (price above/below EMA structure)
CVD momentum bias aligned (buying/selling pressure)
Buy/Sell pressure ratio aligned (>1.5x or <0.67x)
Volume strength (surge detected)
Order flow imbalance (>2:1 ratio)
Tape speed (>1.3x average)
Price structure (higher highs or lower lows)
Liquidity bias (sweep detected)
Score Interpretation:
7-8: Extremely high probability (rare, take immediately)
6: Very high probability (excellent trade)
5: High probability (good trade)
4: Decent probability (acceptable with tight stop)
3 or less: Low probability (wait for better setup)
📋 Quick Reference Card
Entry Checklist
Dashboard shows LONG or SHORT
Score is ≥5
Multiple indicators aligned (green or red dots)
Volume surge present (yellow background)
At support/resistance or liquidity zone
Triangle marker appeared on chart
Risk:Reward ratio is at least 1:2
Exit Strategy
Take Profit: At opposite liquidity zone or resistance/support
Stop Loss: Below sell-side liquidity (longs) or above buy-side liquidity (shorts)
Trail Stop: Move to breakeven after 1:1 risk:reward achieved
⚠️ Important Notes
This is NOT a holy grail: No indicator is 100% accurate. Always use proper risk management.
Backtest first: Paper trade or backtest on your specific instrument before using real money.
Market conditions matter: This indicator works best in trending or volatile markets, not in tight consolidation.
Combine with price action: Use the indicator as confluence with your own price action reading.
Adjust for your instrument: Different assets may require tweaking the sensitivity settings.
Lower timeframes = More noise: 1-minute charts have more false signals than 5-minute charts.
🔄 Version History
v1.0 - Initial release
Multi-indicator dashboard
Volume-based candle coloring
Support/Resistance detection
Entry signal generation
v2.0 - Current version
Added liquidity zone detection
Added liquidity sweep identification
Enhanced scoring system (now 0-8)
Added liquidity bias to entries
New alerts for liquidity sweeps
Improved dashboard with Liq indicator
📞 Support & Feedback
If you find this indicator helpful, please:
⭐ Give it a boost
💬 Share your results in the comments
🐛 Report any bugs or issues
💡 Suggest improvements
Disclaimer: This indicator is for educational purposes only. Trading involves significant risk. Past performance does not guarantee future results. Always trade responsibly and never risk more than you can afford to lose.
🏆 Credits
Created for serious scalpers who want institutional-level insights on retail charts. Combines order flow analysis, volume profiling, and liquidity mapping into one comprehensive tool.
Happy Scalping! 🚀📈
OutsiderEdge – Node Breach Engine (NBE)Overview – What is the Node Breach Engine (NBE)?
NBE is a swing/session volume-profile engine that builds profiles between pivots (or per session), tracks closed & developing POC, and prints breach signals when price challenges the control node. It quantifies node strength, buy/sell composition (CVD) at the POC and the entire profile, Value Area levels (VAH/VAL), VWAP distance, time at price, and introduces a PoV (Point of Void; the LVN located inside the Value Area): to highlight low-participation corridors where rotations or rejections often form. A lightweight EMA smoothed trend can optionally filter signals by prevailing bias.
Use it to answer fast: How strong is this node? Is the profile buy- or sell-led? Are we accepting/rejecting control? Is the developing POC migrating? Is the VA’s LVN (PoV) about to rotate back to POC or reject?
🔹 FEATURES
Volume Profile Core (Swing or Session)
Build pivot-to-pivot or session profiles with configurable row density and Value Area %.
Draw VAH/VAL with optional VA fill and optional profile window background.
Control Node (POC) – Closed & Developing
Closed POC highlighted on finished windows.
Developing POC path stitched bar-by-bar on the active segment (visual migration of control).
Optional POC row highlight and extend-until-touch behavior.
PoV – Point of Void
Detects the lowest-volume row within the current VA band (between VAL and VAH).
Plots a PoV anchor/line you can use as a rotation target or rejection boundary:
Rotations: VAH ↔ PoV (LVN) ↔ POC ↔ VAL.
Rejections: Thin participation at PoV often flips acceptance back toward POC.
Works alongside POC/VA to map acceptance vs. rejection with finer granularity than a single control node.
Node Context Tooltip (Deep Dive)
Compact tooltips on closed profiles: POC price, Node Strength % (POC/Total), CVD split (Buy%/Sell%), VWAP distance %, bars at price.
Profile Buy/Sell Overview (Stacked Bars)
Two stacked horizontal bars (Buy ▲ / Sell ▼) whose width matches the histogram and thickness is configurable.
Auto-placed above or below the profile using swing H/L logic.
Available for closed and developing profiles.
CVD at POC and Full-Profile
Quick labels for Buy% / Sell% at the POC.
Stacked bars summarize full-profile pressure at a glance.
Trend Context
Gradient EMA base vs. smoothed EMA wave for bull/bear bias.
Filter signals to trend direction (only ▲ in uptrend, only ▼ in downtrend).
Breach Signals with Practical Filters
Signals print when price touches/rejects the POC.
Filters: rejection close, ATR momentum guard, wick confirmation, ± margin tolerance, session time filter.
One-shot per bar; coded with object-limit hygiene.
Swing % Change Labels
Small labels at swing H/L showing % move across the last swing window.
Alerts
POC Breach Signal alert for automation/notifications.
🔹 USAGE
In the examples below, you see chart snapshot with labeled alerts/points of POV and POC rejections.
1 — Bearish POC Rejection (▼)
Price tags POC and closes below; ATR guard; EMA wave is bearish. Treat as trend-aligned continuation, reversals or risk tighten on longs.
2 — Bearish POV (LVN) Rejection (▼)
Price probes POV and fails to accept; low participation at PoV flips acceptance. Useful for rotation setups or partials.
3 — Bullish POV Rejection (▲)
Price tags POV and closes above; ATR guard; EMA wave is bullish. Treat as trend-aligned continuation, reversals or risk tighten on shorts.
Treat every signal as context, not as a command. The edge comes from combining location (POC/VA/PoV) with pressure (Node Strength/CVD/VWAP distance) and your structure/timing rules.
🔹 NAVIGATING MARKET CONDITIONS
Trending markets
Expect POC drift with trend; breaches tend to follow-through. Favor trend-aligned breaches; use PoV and VA for add/trim decisions.
Ranges
Frequent VA rotations VAH ↔ PoV ↔ POC ↔ VAL. Fades can work with tight invalidation; lean on PoV to avoid fighting acceptance near POC.
Regime shifts
Repeated failed breaches, PoV rejections, and developing POC re-anchoring are early tells. Adjust filters (ATR guard, wick) and window density as volatility changes.
🔹 SETTINGS SUMMARY
Profile Type: Swing / Session
Window: Present (developing) or Closed Profiles
Rows, lookback cap, Value Area %, optional background
Show POC (closed/developing), POC row highlight
VAH/VAL visibility, optional VA fill
Enable PoV detection (LVN inside VA).
Style controls; optional display with VA/POC.
Rejection close, ATR × multiplier, Wick % threshold, ± Margin %, Session time (trade inside/skip inside)
Enable EMA wave; lengths & smoothing
Toggle CVD; thickness (rows); colors; label text
Swing % change, tooltips, color controls
POC and POV Breach Alerts
🔹 GOOD PRACTICES
Think location + pressure: POC/VA/POV (where) × Node Strength/CVD/VWAP distance (how strong).
Align with HTF structure and liquidity; let POC/POV/VA act as decision levels (initiate, add, reduce, invalidate).
Calibrate row density per symbol/TF; too coarse = blind spots, too fine = noise.
Keep filters honest—if you must loosen them to force a trade, the setup isn’t there.
🔹 LIMITATIONS / DISCLAIMER
NBE does not use lookahead and does not repaint, but no indicator guarantees outcomes.
Node Strength, CVD, PoV, and thresholds are contextual, not signals on their own.
Use independent validation, position sizing, and strict risk management.
Trading involves substantial risk. This tool is for educational purposes only and is not financial advice. Past performance does not guarantee future results. You are solely responsible for your trading decisions and risk management.
Release Notes
v1.1 — PoV (Point of Void) & Profile CVD Bars
Added PoV = LVN inside Value Area as a dedicated anchor/line.
Added stacked profile Buy/Sell bars for closed & developing profiles (width-matched, thickness configurable).
Improved developing VA line/fill updates and object cleanup.
v1.0 — Initial invite-only
Swing/Session profiles; VAH/VAL + optional VA fill
Closed POC highlight + Developing POC path
Node Context Tooltip (POC price, Node Strength, CVD, VWAP distance, bars at price)
EMA wave (trend filter) + breach filters (rejection, ATR guard, wick, time, ± margin)
POC Breach Signal alert & price-panel markers

1BullBear™ StatisticsOverview
1BullBear™ Statistics is a comprehensive volume delta analysis tool that transforms raw order flow data into actionable visual insights. This indicator displays seven key metrics in a clean, gradient-based heatmap format below your price chart, helping you identify significant buying and selling pressure in real-time.
Key Features: Seven Essential Metrics
Volume - Total volume per bar with threshold highlighting
Delta - Net buying/selling pressure (Buy Volume - Sell Volume)
Cumulative Delta - Session-based running total of delta
Delta Ratio - Delta expressed as a percentage of total volume
Minimum - Lowest delta value within the bar's timeframe
Maximum - Highest delta value within the bar's timeframe
Standard Deviation - Statistical measure of delta volatility within the session
Intelligent Gradient Visualization
Dynamic color intensity based on historical significance
Adaptive scaling using configurable lookback periods (10-200 bars)
Threshold-based highlighting to immediately spot extreme values
Separate bull/bear coloring for directional clarity
Customizable transparency for optimal chart integration
Flexible Configuration
Toggle any metric on/off to focus on what matters
Custom labels - rename metrics to your preference
Independent color schemes for each row
Adjustable thresholds for highlighting significant values
Multiple text sizes from tiny to huge
Session-aware calculations that reset at market open
Real-Time Updates
Confirmed bars display permanent historical data
Current bar updates in real-time as price action develops
Efficient rendering with automatic cleanup of previous bars
Handles up to 500 boxes for extensive historical analysis
How It Works
The indicator uses TradingView's native volume delta data (sourced from lower timeframe aggregation) to calculate order flow statistics. Each metric is displayed as a colored box below the chart, with gradient intensity representing the value's significance relative to recent history.
Gradient Logic:
Stronger colors = more significant values relative to the lookback period
Transparent backgrounds = values below threshold (filtered out)
Color saturation scales from 0% to your set maximum opacity
Session Management:
Cumulative Delta and Standard Deviation reset at each new trading session
Session detection uses exchange timezone for accurate daily calculations
Historical lookback maintains a rolling window for gradient intensity
I deal Use Cases
Scalping & Day Trading - Identify aggressive buying/selling in real-time
Order Flow Analysis - Understand market participant behavior
Divergence Detection - Spot when price and delta disagree
Volume Profile Context - Complement VP analysis with granular delta data
Breakout Confirmation - Verify price moves with volume delta agreement
Default Thresholds
The indicator comes pre-configured with sensible defaults for futures trading:
Volume: Highlights bars above 1,500 contracts
Delta: Flags extremes beyond ±500
Delta Ratio: Alerts on imbalances beyond ±70%
Min/Max: Range filter of ±10 for precision
Std Dev: Highlights outliers beyond ±0.7 standard deviations
Adjust these values based on your instrument and timeframe.
Technical Notes
Requires real-time volume delta data from your broker
Works best on instruments with strong volume (futures, major stocks, crypto)
Lower timeframe aggregation defaults to 1-second or 1-minute depending on chart timeframe
Optimized performance with efficient array management and conditional rendering
Compatibility
Pine Script™ v6
All timeframes supported
Best results on liquid instruments with reliable volume data
Integrates seamlessly with other TradingView indicators
Created by KweeBoss_ | Licensed under Mozilla Public License 2.0
Note: This indicator analyzes historical and real-time volume data. Past performance does not guarantee future results. Always combine with other forms of analysis and proper risk management.

Bubbles VolumeBubbles Volume Indicator
Overview
The Bubbles Volume Indicator is an advanced volume visualization tool that transforms traditional volume analysis into an intuitive, visual experience. By representing volume as dynamically-sized bubbles directly on your price chart, this indicator helps traders quickly identify significant volume events, potential support/resistance levels, and shifts in market sentiment.
Key Features
🔵 Visual Volume Representation
Displays volume as circular bubbles at the midpoint of each candle
Bubble size scales proportionally to volume significance
Instant visual identification of unusual volume activity
Clean, uncluttered chart presentation
📊 Dual Volume Modes
Total Volume Mode: Displays complete trading volume for each bar
Volume Delta Mode: Shows the difference between buying and selling pressure, helping identify market direction and strength
🎨 Advanced Coloring Systems
Simple Mode: Clear green/red coloring for buy/sell pressure
HeatMap Mode: Gradient coloring that intensifies with volume strength, providing instant visual feedback on volume intensity
📍 Significant Level Detection
Automatically identifies and marks price levels with exceptional volume
These levels often act as future support or resistance zones
Historical volume levels remain visible for reference
How to Use
For Day Traders
Identify volume climaxes that may signal reversals
Spot accumulation/distribution patterns through Volume Delta
Confirm breakouts with significant volume bubbles
For Swing Traders
Mark important support/resistance levels based on historical high-volume areas
Identify institutional activity through unusual volume patterns
Validate trend strength using volume confirmation
For Scalpers
Quick visual identification of liquidity pockets
Real-time volume delta for order flow analysis
Filter out low-volume noise with minimum contract settings
Parameter Settings
Volume Settings
Volume Type
Total Volume: Shows all traded volume for each bar - ideal for general volume analysis
Volume Delta: Displays the difference between buying and selling pressure - perfect for order flow analysis
Minimum Contracts
Filters out bubbles below a specified volume threshold
Set to 0 to disable filtering
Helps remove noise during low-volume periods
For Volume Delta: Filters based on absolute delta value
Bubble Display
Show Bubbles
Toggle the visibility of volume bubbles on/off
Bubbles appear at the middle price point (HL2) of each bar
Threshold
Statistical threshold measured in standard deviations
Controls sensitivity of volume significance detection:
1.0 = Shows top ~32% of volumes (more bubbles, common events)
2.0 = Shows top ~5% of volumes (significant events)
3.0 = Shows top ~0.3% of volumes (rare, extreme events)
Higher values display only the most significant volume spikes
HeatMap
OFF: Simple coloring scheme (green for buying, red for selling in Delta mode)
ON: Gradient coloring that intensifies with volume strength
Provides additional visual dimension to volume analysis
Volume Levels
Significant Levels
Draws horizontal lines at price levels where extreme volume occurred
Volume must exceed 3x the threshold setting to qualify
These levels often become important support/resistance zones
Levels Qty
Maximum number of significant volume level lines to display
Older lines are automatically removed when limit is exceeded
Keeps chart clean while maintaining relevant historical levels
Visual Indicators
Bubble Sizes (in order of significance)
Tiny: Minimal volume above baseline
Small: Low significant volume
Normal: Moderate volume activity
Medium: Above-average volume
Large: High volume activity
Huge: Exceptional volume
Labeled: Extreme volume with numeric display
Color Coding
Green: Buying pressure (in Volume Delta mode) or rising prices
Red: Selling pressure (in Volume Delta mode) or falling prices
Gradient Intensity: Stronger colors indicate higher relative volume
Information Display
The indicator includes a real-time information table showing:
Current operating mode (Total Volume or Volume Delta)
Live delta values with directional arrows (in Volume Delta mode)
Active minimum contracts filter setting
Best Practices
Start with default settings to familiarize yourself with the indicator
Adjust threshold based on your trading timeframe (lower for scalping, higher for position trading)
Use Volume Delta mode when analyzing order flow and market sentiment
Enable Significant Levels for swing trading to identify key support/resistance
Apply Minimum Contracts filter to reduce noise in low-volume markets
Technical Notes
The indicator requires volume data to function (not available on all symbols)
Volume Delta calculations use intrabar data for enhanced accuracy
Historical significant levels are preserved for technical analysis
Optimized for both light and dark chart themes
Trading Applications
Breakout Confirmation: Large bubbles during breakouts confirm strength
Reversal Detection: Extreme volume at tops/bottoms may signal reversals
Trend Analysis: Increasing bubble sizes confirm trend strength
Support/Resistance: High-volume levels often become future pivots
Order Flow: Volume Delta reveals real-time buying/selling pressure
Transactional Rate of Change (TROC)TRANSACTIONAL RATE OF CHANGE (TROC) INDICATOR
Transaction Rate of Change (TROC) is an advanced momentum indicator that analyzes the rate of change in cumulative inferred buy/sell volume data to identify shifts in buying and selling acceleration and deceleration of transaction flow, providing early signals of potential trend changes, exhaustion/absorption, and momentum shifts. It builds further upon the official Volume Delta indicator released by TradingView.
If a stock price is a rocket climbing , then volume delta is the total fuel burned, and TROC is the fuel burn rate . A rocket can keep rising even after engines start throttling down (decelerating TROC), but it won't go much higher without more thrust. When TROC shows extreme positive readings, the engines are at maximum burn—expect explosive price movement. When TROC drops to zero while price is still high, the fuel is depleted and gravity (selling pressure) takes over. Are buyers pushing on the gas, or are they backing off? Are more buyers coming to the table, or are they losing interest or taking profits? Are excited retail buying highs while smart money close their positions using the excited retail liquidity?
KEY FEATURES
• Volume Delta Analysis - Approximates up and down volume from lower timeframe data to calculate true buying vs. selling pressure.
• Rate of Change Calculation - Measures the momentum of cumulative delta over a customizable period. Essentially, it displays the rate of change between buying and selling. How fast is it going, is it slowing, how excited are they?
• Momentum State Detection - Automatically identifies four distinct market states: accelerating up, decelerating up, accelerating down, and decelerating down
• Extreme Threshold Zones - Bands based on standard deviation to highlight unusually high or low transaction rates, helping to spot potential extreme values, blow offs, and capitulation.
• Z-Score Normalization - Optional standardization for comparing momentum across different timeframes and instruments.
• Momentum Strength Index (MSI) - Filters out weak signals by highlighting only bars with momentum exceeding a threshold.
• Flexible Reset Modes - Reset cumulative delta daily, weekly, monthly, or per session to prevent data drift, or leave it default for continual cumulative data.
APPLICATION
Trend Confirmation
When price makes a new high but TROC is decelerating (lighter colors), it suggests weakening buying pressure and potential exhaustion. Conversely, strong acceleration (darker colors) confirms robust trend continuation. Either buyers are supporting the move, or they aren't. Same goes for selling. It can also assist spotting short covering.
Divergence Trading
Use it similar to MACD divergence strategies. Is price movement confirmed by expansion in TROC, or is the TROC showing weakness while price is continuing it's trend?
Momentum Breakouts
When TROC crosses above the upper threshold zone with strong momentum (MSI activated), it signals institutional-level buying that often precedes significant price moves. Use this for breakout entries.
Mean Reversion
Extreme readings beyond the threshold zones often precede short-term reversals as transaction rates normalize. Consider taking profits or counter-trend positions when TROC reaches statistical extremes. Utilizing the extreme threshold bands can help you identify tops and bottoms.
Absorption Detection
Spot areas where buying or selling is being done, but price is hitting a wall or floor and not moving. This can indicate a hidden seller or a buyer reloading at price levels/zones.
SETTINGS
Timeframe for Volume Delta Calculation
Select the lower timeframe used to calculate buying and selling volume. Default: 1S (1 second)
• 1S or 5S - Maximum precision for scalping and intraday trading on liquid markets
• 1m or 5m - Balanced precision for swing trading and less liquid instruments
• Higher timeframes - Provide more historical data but reduce accuracy
Note: Higher frequency data yields more accurate delta calculations but may not be available for all symbols or historical periods. If you are using higher timeframes (Daily, Weekly) you will need to change this setting to a higher timeframe.
Rate of Change Period
Determines how many bars back to measure the momentum change. Default: 14
• Short periods (7-10) - More responsive, ideal for scalping and quick momentum shifts
• Medium periods (14-20) - Balanced sensitivity for day trading
• Long periods (25-50) - Smoother readings for swing trading and trend analysis
Shorter periods generate more signals but increase false positives; longer periods reduce noise but may lag significant changes.
Extreme Threshold Zones
Bands that highlight unusual transaction rate extremes based on standard deviation.
• Show Zones - Enable/disable the upper and lower threshold lines (Default: Enabled)
• Multiplier - Standard deviation multiplier for zone placement (Default: 2.0)
Values of 1.5-2.0 catch moderate extremes
Values of 2.5-3.0 identify only the most extreme readings
• Lookback Period - Number of bars used to calculate mean and standard deviation (Default: 100)
Shorter lookback (50-75) adapts faster to changing market conditions
Longer lookback (150-200) provides more stable, consistent zones
Smooth Cumulative Delta
Applies Adaptive Moving Average to reduce noise in the cumulative volume delta before calculating rate of change. Default: Enabled
• Smoothing Length - period (Default: 5)
Lower values (3-5) preserve responsiveness
Higher values (7-10) significantly reduce noise on choppy markets
Smoothing is particularly useful on volatile instruments or when using very short ROC periods.
Momentum Strength Index (MSI)
Filters the histogram to highlight only bars exceeding a specified momentum threshold, eliminating weak signals.
• Show MSI - Enable/disable momentum strength filtering (Default: Disabled)
• MSI Threshold - Minimum momentum strength multiplier (Default: 2.0)
Values of 1.5-2.0 show above-average momentum
Values of 2.5-3.5 isolate only exceptional momentum bars
When enabled, bars meeting the threshold display in the "Strong Up/Down" colors, while normal bars use standard momentum colors.
Display Settings
• Histogram Bar Width - Visual thickness of the columns (Default: 1, Range: 1-10)
• Use Z-Score Normalization - Standardizes TROC values for cross-asset comparison (Default: Disabled)
Enable when comparing multiple instruments or timeframes simultaneously
Z-Score converts values to standard deviations from the mean
• Z-Score Threshold - When using Z-Score Normalization mode, sets the extreme zone levels (Default: 2.0)
Represents standard deviations from mean (2.0 = ~95% confidence interval)
Cumulative Transaction Reset
Determines when the cumulative volume delta resets to zero, preventing infinite accumulation. Default: None
• None - Cumulative delta never resets (continues from symbol history start)
• Daily - Resets at the start of each new trading day
• Weekly - Resets at the start of each week
• Monthly - Resets at the start of each month
• On session change - Resets when market opens (useful for 24-hour markets)
Reset modes prevent cumulative drift that can distort ROC calculations over extended periods.
Color Customization Fully customizable color scheme.
-------------------------------------------------------------------
Note: This indicator requires volume data from your data vendor. It uses inferred buy/sell volume. To learn more, read the TradingView Volume Delta documentation. Optimal performance is achieved on liquid instruments with high-frequency data.

Delta Money Flow IndexThe Delta Money Flow Index is a modified version of the traditional Money Flow Index that uses directional volume instead of total volume to measure buying and selling pressure in a different way.
It helps traders identify overbought/oversold conditions based on actual buy/sell pressure rather than just total volume. It's designed for traders who want to see if price movements are backed by genuine buying or selling activity.
How to use it:
- Values above 80 indicate overbought conditions
- Values below 20 indicate oversold conditions
- The 50 level acts as a neutral zone. Above suggests buyers are in control, below suggests sellers are in control.
- Traders can check for divergences for potential reversal signals
- Works best on intraday timeframes where delta volume is most meaningful
What makes it different:
Unlike the standard MFI which uses total volume, the Delta MFI calculates an approximation of volume delta by assigning positive volume to up-closing candles and negative volume to down-closing candles.
This means:
- It focuses on directional pressure, not just activity
- Filters out low-conviction volume that doesn't move price
- Provides clearer signals when actual buying/selling dominates
The indicator includes visual aids like background colors for overbought/oversold and a fill showing whether the Delta MFI is above or below the 50 midpoint for quick interpretation.

Volume Area 80 Rule Pro - Adaptive RTHSummary in one paragraph
Adaptive value area 80 percent rule for index futures large cap equities liquid crypto and major FX on intraday timeframes. It focuses activity only when multiple context gates align. It is original because the classic prior day value area traverse is fused with a daily regime classifier that remaps the operating parameters in real time.
Scope and intent
• Markets. ES NQ SPY QQQ large cap equities BTC ETH major FX pairs and other liquid RTH instruments
• Timeframes. One minute to one hour with daily regime context
• Default demo used in the publication. ES1 on five minutes
• Purpose. Trade only the balanced days where the 80 percent traverse has edge while standing aside or tightening rules during trend or shock
Originality and usefulness
• Unique fusion. Prior day value area logic plus a rolling daily regime classifier using percentile ranks of realized volatility and ADX. The regime remaps hold time end of window stop buffer and value area coverage on each session
• Failure mode addressed. False starts during strong trend or shock sessions and weak traverses during quiet grind
• Testability. All gates are visible in Inputs and debug flags can be plotted so users can verify why a suggestion appears
• Portable yardstick. The regime uses ATR divided by close and ADX percent ranks which behave consistently across symbols
Method overview in plain language
The script builds the prior session profile during regular trading hours. At the first regular bar it freezes yesterday value area low value area high and point of control. It then evaluates the current session open location the first thirty minute volume rank the open gap rank and an opening drive test. In parallel a daily series classifies context into Calm Balance Trend or Shock from rolling percentile ranks of realized volatility and ADX. The classifier scales the rules. Calm uses longer holds and a slightly wider value area. Trend and Shock shorten the window reduce holds and enlarge stop buffers.
Base measures
• Range basis. True Range smoothed over a configurable length on both the daily and intraday series
• Return basis. Not required. ATR over close is the unit for regime strength
Components
• Prior Value Area Engine. Builds yesterday value area low value area high and point of control from a binned volume profile with automatic TPO fallback and minimum integrity guards
• Opening Location. Detects whether the session opens above the prior value area or below it
• Inside Hold Counter. Counts consecutive bars that hold inside the value area after a re entry
• Volume Gate. Percentile of the first thirty minutes volume over a rolling sample
• Gap Gate. Percentile rank of the regular session open gap over a rolling sample
• Drive Gate. Opening drive check using a multiple of intraday ATR
• Regime Classifier. Percentile ranks of daily ATR over close and daily ADX classify Calm Balance Trend Shock and remap parameters
• Session windows optional. Windows follow the chart exchange time
Fusion rule
Minimum satisfied gates approach. A re entry must hold inside the value area for a regime scaled number of bars while the volume gap and drive gates allow the setup. The regime simultaneously scales value area coverage end minute time stop and stop buffer.
Signal rule
• Long suggestion appears when price opens below yesterday value area then re enters and holds for the required bars while all gates allow the setup
• Short suggestion appears when price opens above yesterday value area then re enters and holds for the required bars while all gates allow the setup
• WAIT shows implicitly when any required gate is missing
• Exit labels mark target touch stop touch or a time based close
Inputs with guidance
Setup
• Signal timeframe. Uses the chart by default
• Session windows optional. Start and end minutes inside regular trading hours
• Invert direction is not used. The logic is symmetric
Logic
• Hold bars inside value area. Typical range 3 to 12. Raising it reduces trades and favors better traverses. Lowering it increases frequency and risk of false starts
• Earliest minute since RTH open and Latest minute since RTH open. Typical range 0 to 390. Reducing the latest minute cuts late session trades
• Time stop bars after entry. Typical range 6 to 30. Larger values give setups more room
Filters
• Value area coverage. Typical range 0.70 to 0.85. Higher coverage narrows the traverse but accepts fewer days
• Bin size in ticks. Typical range 1 to 8. Larger bins stabilize noisy profiles
• Stop buffer ticks beyond edge. Typical range 2 to 20. Larger buffers survive noise
• First thirty minute volume percentile. Typical range 0.30 to 0.70. Higher values require more active opens
• Gap filter percentile. Typical range 0.70 to 0.95. Lower values block more gap days
• Opening drive multiple and bars. Higher multiple or longer bars block strong directional opens
Adaptivity
• Lookback days for regime ranks. Typical 150 to 500
• Calm RV percentile. Typical 25 to 45
• Trend ADX percentile. Typical 55 to 75
• Shock RV percentile. Typical 75 to 90
• End minute ratio in Trend and Shock. Typical 0.5 to 0.8
• Hold and Time stop scales per regime. Use values near one to keep behavior close to static settings
Realism and responsible publication
• No performance claims. Past results never guarantee future outcomes
• Shapes can move while a bar forms and settle on close
• Sessions use the chart exchange time
Honest limitations and failure modes
• Economic releases and thin liquidity can break the balance premise
• Gap heavy symbols may work better with stronger gap filters and a True Range focus
• Very quiet regimes reduce signal contrast. Consider longer windows or higher thresholds
Legal
Education and research only. Not investment advice. Test in simulation before any live use.
