Volum

VB Strategy ProVB Strategy Pro based on the vb indicator.
with buy zone and sell zone, you can trade easy.
this indicator used volume and Bollinger Bands.
VB indicator Pro

VB Strategy for only shortVB Strategy for only short.
VB Indicator PRO (with Alarm function)
With this strategy, you can test VB indicator.

Moon Trader BacktestHello Fellow Traders!
-------------------------------------------
This is the newest addition to Gnome Alerts PRO!
This Bot Script works on all Crypto, Leverage, Forex, & Traditional Exchanges.
Trade of Major TRENDS with no repaint using my proprietary MVG AVG Cross Script.
FEATURES
------------------------
*Autoview Ready*
- Easy to Use
- Backtesting Included
- Stop Loss
More info on how gain access in my profile!

Support the Resistance BacktestHello Fellow Traders!
-------------------------------------------
This is the newest addition to Gnome Alerts PRO!
This Bot Script works on all Crypto, Leverage, Forex, & Traditional Exchanges.
Trade of Support & Resistance Levels in Realtime!
FEATURES
------------------------
*Autoview Ready*
- Easy to Use
- Backtesting Included
- Stop Loss
More info on how gain access in my profile!

Rainbow MA10 with Signal Strategy Version by letsplayantsRainbow MA10 with Signal Strategy Version
Just One for Man.

BTC-USD Strategy ScriptThis is great script, and very profitable indicator. You can see it your self, how good it is... On, 15m, 4h, it is great!


Super MFI&STOCH StrategyThe strategy speaks for itself. With it you would have shorted on bitmex with very low average and still be in profit.
Best on the 6hr, 3hr, 2hr, 1hr.

VWAP Strategy_SCSimple Strategy for Crypto. Since it is very profitable, i decided to share the version with fixed parameters.
Best used on BTC on 1 hr timeframe. Use it at your own discretion.

SecretSauceForLife X1SecretSauceForLife X1 Is Finally here!
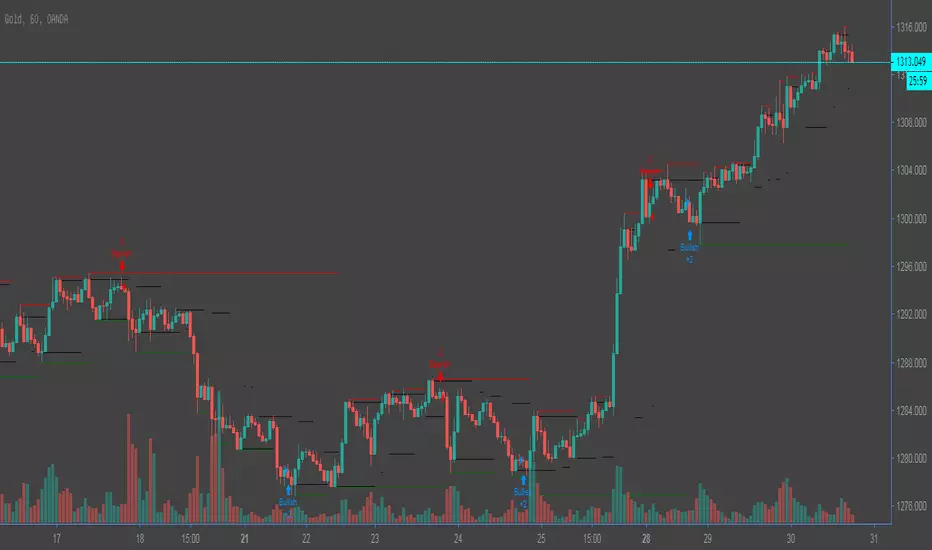
Finally after so much trial and error we have it! Our 3% DD indicator.
This indicator gives 'long' 'short' 'close short' and 'close long' calls, we made this indicator based of the original GODMODE indicator credits to the original author for that!
It was pretty complicated to understand the calls that the indicator gave so we made it easy for you guys. THIS IS STILL AN INDICATOR so not a get rich quick method.
This indicator works best on USD forex pairs, and on BTC, ETH and XRP. It is optimized for scalps and daytrades.
If you don't manage your risk well your account will still be blown.
BUT if you use this indicator next to your own knowledge about charts you should see a significant increase in profitable trades. If there are enough people interested we will make a Chat group where we will add all the people that get this indicator and keep updating you guys on the newest updates and share our own trades taken with this indicator.
We are not advertising this indicator as an flawless signal provider, it does have losing trades but at the end its always in a net profit. We made this to add value to your trading experience so if you think that this is something you want to use send me a PM and we will see if you are committed enough. FYI this is NOT a FREE indicator, but ask yourself this: is it a matter of money or a matter of value? if you need to invest a couple hundred or even a couple thousands
into something that will help you for the rest of your tradinglife does it even matter to pay that price?
So again, we want to help people that take trading seriously and KNOW that trading isn't a get rich quick scheme (if you do it the right way :)). If you can relate to that and you are interested in investing in yourself don't hesitate to shoot me a PM!
Have a nice start of 2019 and don't forget that you are the only one that can make a change to your life, so get up and start today!
***EDIT****
The indicator summary is based of a certain timeframe. Wider and more accurate info PM!

Pivot Point Bot BacktestHello Fellow Traders!
-------------------------------------------
This is the newest addition to Gnome Alerts PRO!
This Bot Script written for leverage Crypto exchanges like BITMEX & Deribit but also works with Forex.
FEATURES
------------------------
*Autoview Ready*
- Easy to Use
- Backtesting Included
- Stop Loss
More info on how gain access in my profile!

Try Me I'm NewThis script can be used on the Forex Majors. When you apply it to the chart open the properties box and click the 'recalculate after update' box. It open only long positions when the conditions are met.
This is my very first attempt so dont crit me too much.

VMACD - STOCHASTIC RSIMeasures entry and exit points for the VMACD Strategy, good at monitoring accumulating and distribution.
Crossing over 20 and crossing under 80 signal good long and short entries
** Part 3 of the VMACD Strategy, meant for Forex Markets, Contact me if interested.

VMACD - CUMULATIVEMeasures true accumulation and distribution amidst price changing noise
* Positive Movement upward is accumulation
* Negative Movement downward is Distribution
-- Crosspoints above and below 0 indicate heavy movement
Part 2 of 3 part VMACD strategy, if you're interested contact me, mainly applicable to Forex Markets.

VMACD - CUMULATIVEThis measures positive and negative volume flow throughout all the noise of price change. Helps find the true flow of the trend.
* Positive movement upward is accumulation
* Negative movement downward is distibution
** Expect heavy activity whenever it hits a crossing point above or below 0
Works by taking the cumulative change of VMACD
Part of the VMACD Strategy, specifically engineered for Forex Markets, contact me if interested it is a high costing indicator.

Bone Scalp StrategyThis is how I scalp trades. Very simple to use
There are 0-4 Numbered rows of squares, each row has the following definition
4 - Rigor Row - Describes how much rigor is the movement
3 - Momentum Row - Describes how much momentum there is in the movement
2 - Energy Row - Describes how much Gas is in the movement
1 - Vector Row - Describes which direction it is going
0 - Go/No Go Row - Turns Green when all are Green
Turns Red when Rigor is red with the combination of any of the other are red (ie Rigor Red and (Momentum Red and Vector Red)

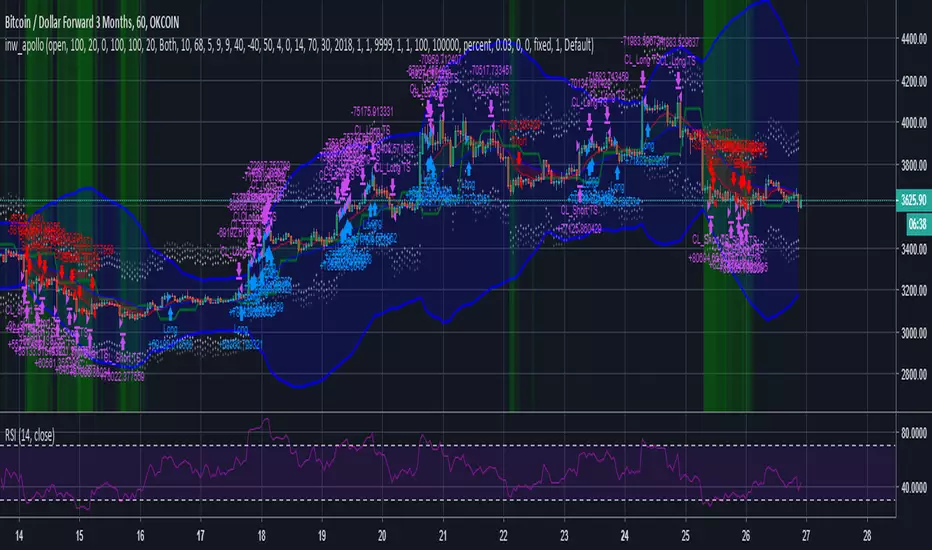
inwCoin Apollo Strategy ( Just for FUN! )Just for fun strategy.
This is very bullshit and parody strategy
*** DO NOT USE IN REAL TRADE ***
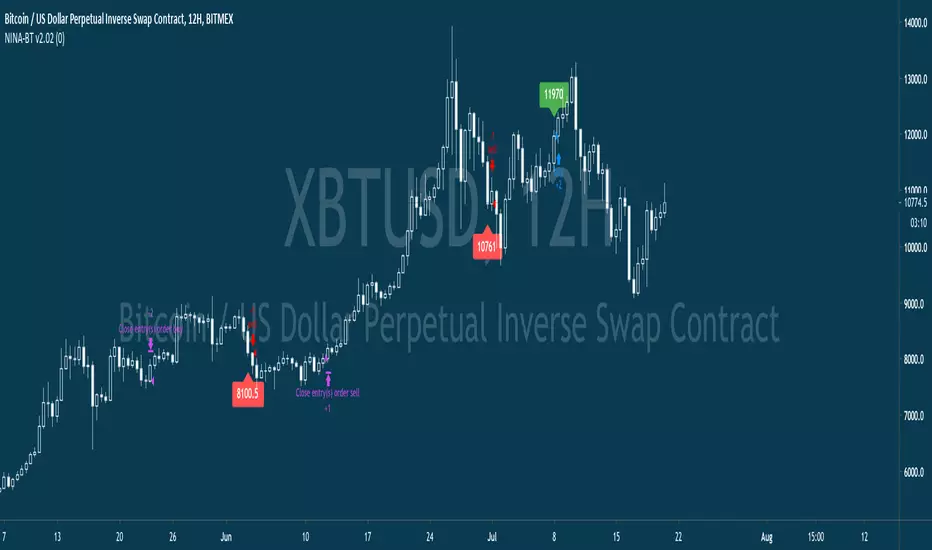
NINA-BTHello Fellow Traders !
KikingAlgo has produced another amazing tool which is now fully operational and ready.
This Algo is called NINA-BT ( Backtesting + Multi Time Frame ) and is based on mathematical formula over 11 timeframes to create trend signals based on the current market conditions.
The Algo can operate on any market, any pair in any timeframe and shows a clear trend direction and strength.
This is a PRO BT version of NINA - drop private message for details.
Regards
KikingAlgo
Dany_ema_Scalping_4dany_ema_Scalping_4
A very powerful tool for the trader who performs scalping of 5m, was tested in 500 operations, of which 455 were successful.
consists of making entries to the market in combination of the signal "B" and the blue bars, this is applying price action, cu enta with supports and dynamic resistances, the volume of the RSI price is based on the volume.
The best way to operate in 5m time, and checking the supports and making purchases when you have the B sign and the blue bars.
practice it and see its power.
Torres Dany


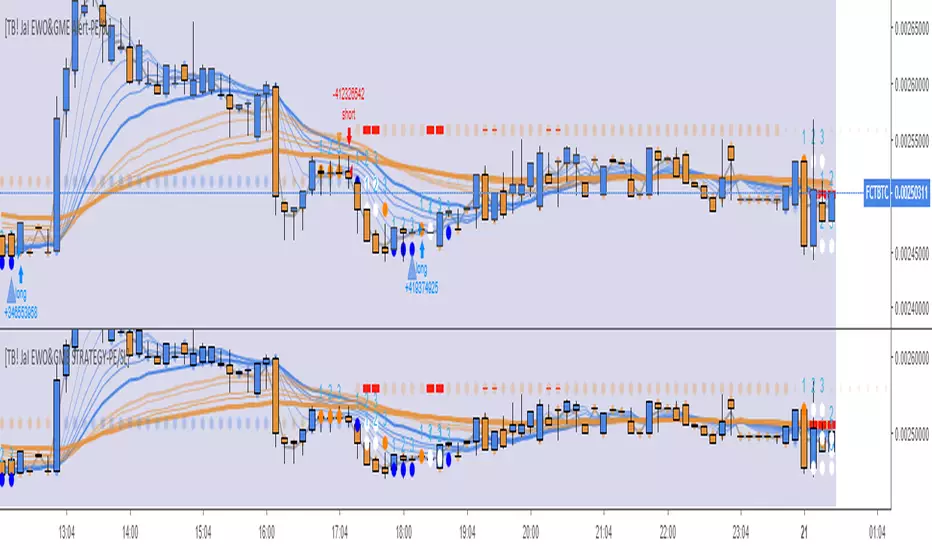
[Strategy]TB!Just an Indicator [EWO& Guppy Made Easy]]Backtesting for TB! Just an Indicator + the merger of EWO & Guppy