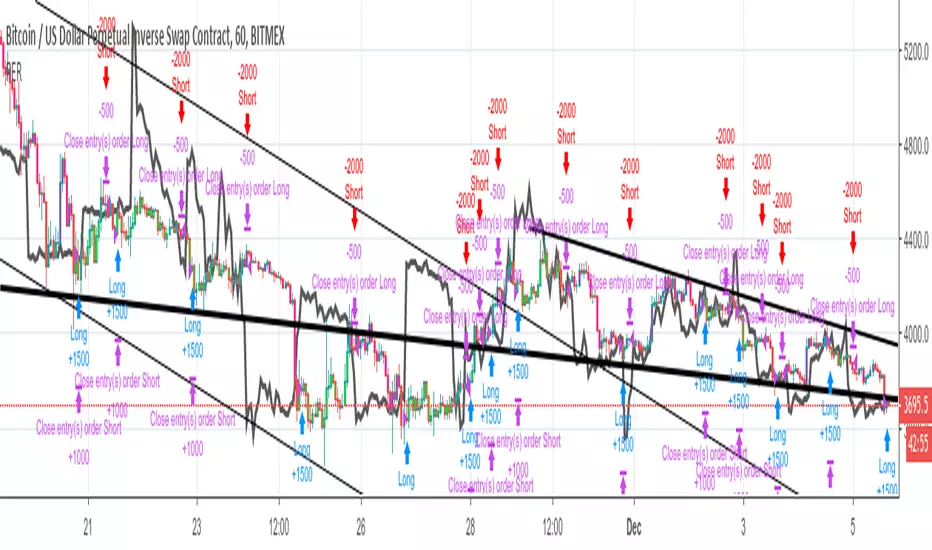
Wave Momentum StrategyWave Momentum Strategy is a momentum and cyclic based strategy. It uses the best indicators I've created in the past along with some other HPT (High Probability Trade) signals I developed to attempt to trade successfully at any time-frame. The primary underlying signal generator is the Wave Momentum Indicator which you'll also find on my profile. This indicator gets more accurate with time (larger timescale) and in general gives an excellent indication of overall market conditions (bullish, bearish, chop).
It works best with Futures because it doesn't fall victim to the gap open or the gap and drop as frequently. I have not tested with stocks/equities because I do not trade them regularly. I traded using this system for most of the past few years until I moved to an automated system I built in C#. It was one of at least 4 strategies I ran at anywhere from 5m to 1d intervals.
Volum

Relative Estimated Price KivanÇ version (Strategy) By Wicksell Thanks to the great work of KIVANÇ in the Relative Estimated Price REP by KIVANÇ fr3762, it has adapted modifications in the Lookback bar length, transformed into strategy, where a line determines a relative average price of XBTUSD, BTCUSD, ETHUSD and BCH.
the line is a calculation, where it involves reading previous candles where it determines what the current price should be.
When the REP line is above the candle, open buy and close sell, when it is below, open sell and close buy.
When setting which currency, do not forget to change the settings where they are:
1 - XBTUSD
2 - BTCUSD
3 - ETHUSD
4 - BCHBTC
may also be modified:
the Lookback bar length, stop loss settings, test date.
The best results are in the 1H time, with the default settings, but try to modify the data and if you find better results, I would be grateful if you post here.


Chaikin Money Flow(CMF) strategy (lirshah)Chaikin Money Flow (CMF) is a technical analysis indicator used to measure Money Flow Volume over a set period of time. Money Flow Volume (a concept also created by Marc Chaikin) is a metric used to measure the buying and selling pressure of a security for single period.
This strategy gives signals based on movement of CMF chart and has a good results on Xbtusd and Btcusd 30 minutes chart.

bfcp2018This strategy is the perfect balance of controlling the profitable accuracy and the times of trading. This version of the script has been written to reduce repaint and delay.
Works on any time frame. Kindly adjust the strategy settings for each single market.
This strategy is published for invited users. Only the customers will be granted access.

Help Requested - "Time-Slot" Delay for Crossover StrategyHello Tradingview Community,
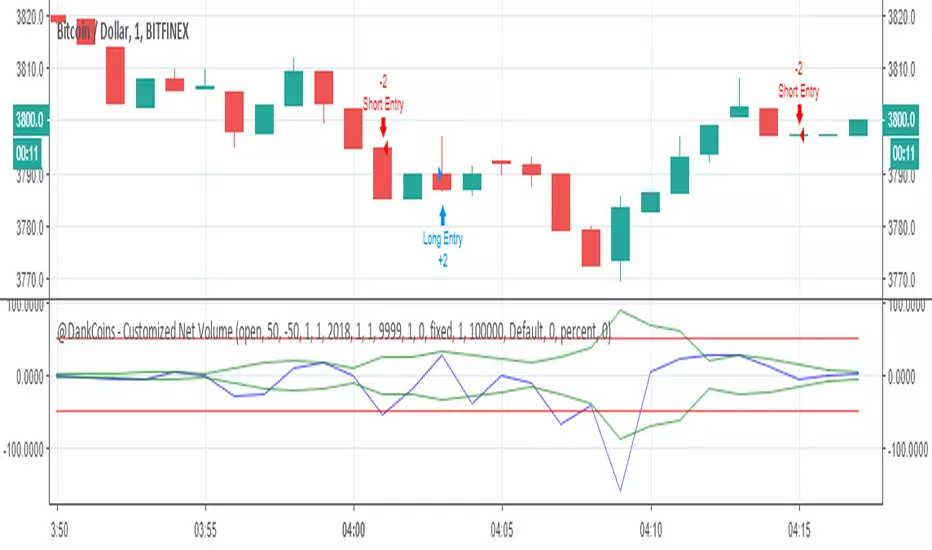
I've been playing around with some various volume-based indicators, and recently have been experiencing a delay in the entries for my strategy for 2 minutes in this scenario. If the time is adjusted, it also is delayed 2 bars.
In this example, the "Short" position should enter when the blue line Crosses under the upper green line, and visa vera for the "Long" position. A simplified Pine Script is available below as well.
I have Googled this issue and attempted to modify the code with => criteria instead, but too no avail. Would appreciate any help or anyone who could point me in the right direction on this Time Delay Issue. Thanks!
CS Basic Script: Customizable Volume Based Trading (Strategy)Customizable Volume Based Strategy Script that includes the Following Inputs:
- Custom Backtesting Date Range
- Optional Trailing Stop Loss
- Select the Volume Strategy Types (Crossing EMA, SMA, WMA, & Lookback)
- Adjust the MA Volume Range
- Automate with the Autoview Trading Bot
Strategy script may be tested by favoriting and adding to any chart.
Study script is available for automated trading at www.cryptoscores.org

VMACD - StrategyUpdated a basic strategy (Same with MACD) these are the results on XBT-USD (It's Version 3 so no Repainting) probably some of my best work.
BUY = Histo > 0
SELL = Histo < 0
uses my VMA formula modified with change to catch see the overall direction of volume compared to price. Much more efficent than VWAP.


Altcoins StrategyBuy/Sell Altcoins strategy. Based on moving averages, divergences, price and volume


New Horizon - Test AScript for entries and exits based on different parameters. Eventually will be released

VB Strategy + MACD
This strategy should be used with VB Indicator PRO.
This Strategy used volume flow and bollinger bands + MACD

Confirmed Strength Index - MACD*RESULTS ARE FROM x10 LEVERAGING*
Uses the MACD principle with CSI, looks for bottoms and tops to short and long. Favorite to use.

VMA - Volume Moving AverageA Short Term trading indicator that measure the overall direction of volume compared to price. Kills in Heikin Ashi, but wanted to show it kills in candlesticks too :)


MCI and VCI - Modified CCI FormulasFor private peeps only
- Takes a modified version of the CCI formula into 2 parts
VCI - Volume Channel Index (Yellow Histogram)
- Measures accurate accumulation and distribution levels and times
MCI - Modified Channel Index
- Measures (when compared to VCI) levels where clearly buys are interested vs not interested.
Example:
If VCI > MCI
- Shows buyer's are more than interested in buying, you've either hit a bottom or heavy resistance
if MCI > VCI
- Show's buyer's aren't interested and will most likely result in a dump/lower price
Great for monitoring accumulation and distribution, these auto buy and sells look for the transition points over 0, works on EVERY commodity/stock/FOREX/Crypto
Results are from trading 1 BTC x25 leveraging. Not all trades will get in if put in at limit, but it does survive with profits after the massive 0.075 fee (results shown are after fees)


