BTC — CVD Divergence (Spot & Perp, robuste v6)If the price is above the CVD, it usually means the move is being pushed by leverage rather than real buying — the market is stretched and at risk of a correction.
If the price is below the CVD, it suggests that buyers are quietly absorbing — pressure is building for a bullish recovery once leverage clears out.
Volum

Volume DensityThis indicator calculates the volume density of each bar by dividing the trading volume by the bar's price range (high - low). It highlights bars with higher activity relative to their price movement. Density bars are colored teal if the close is higher than the open, and red if the close is lower. Zero-range bars are ignored to prevent division errors.
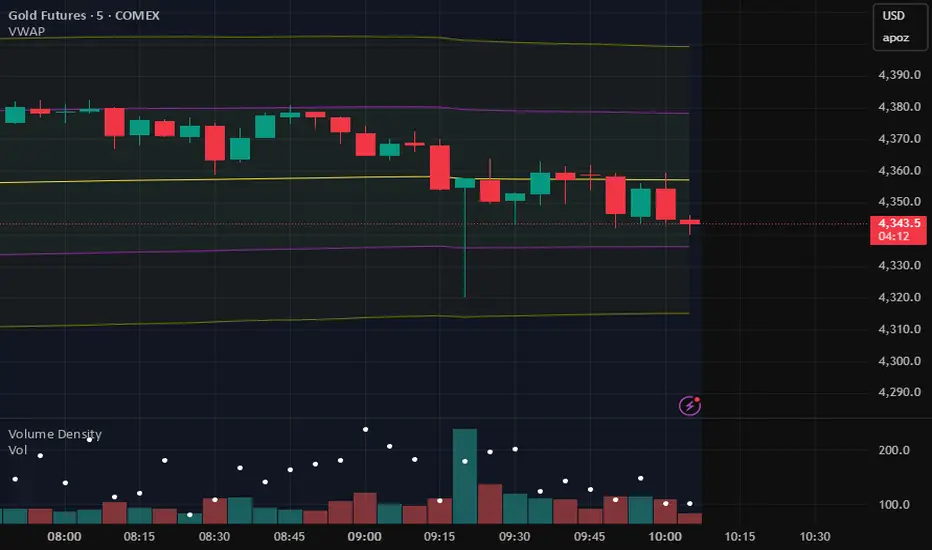
xVWAP (Multi-Source VWAP)This indicator lets you plot a true cross-symbol VWAP — volume-weighted average price taken from any symbol or from your current chart. It’s ideal for futures, micros/minis, indices, and correlated assets (e.g., MGC ↔ GC1!, MNQ ↔ NQ1!, ES ↔ SPX).
You can choose the source symbol, anchor period, and display up to three standard-deviation bands around VWAP.
In the chart, since I trade Micros, I used MGC1! (colored), then overlay it with the VWAP from GC1! (Grey).

Momentum BarsMomentum Bars that show increasing momentum (blue bars) and negative momentum (red bars). The goal is to use breaches of the bars to show increased/decreased momentum. I tried to predict future positive momentum bars. These may be less accurate.
Note: This is Version 1, and limited testing has been done, so accuracy cannot be guaranteed will work to improve as time goes on.

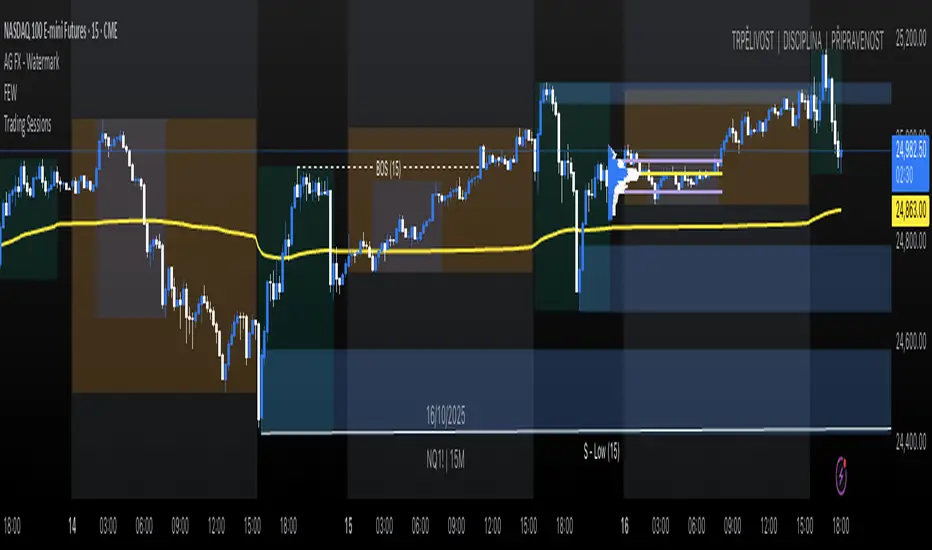
Swing Points & Liquidity — ENHANCED PRO (Dark/Light Mode)This indicator — “Swing Points & Liquidity — ENHANCED PRO (Dark/Light Mode)” — automatically detects and visualizes swing highs, swing lows, and liquidity levels on the chart with rich analytics and customizable visuals.
🔍 Core Features
Smart Swing Detection: Identifies pivot highs/lows based on adjustable left/right bar settings.
Liquidity Visualization: Draws dynamic boxes and lines for liquidity pools and swing zones.
Volume & OI Integration: Filters and colors levels using volume and Open Interest Δ (change).
Strength Meter: Highlights strong liquidity levels with color gradients based on OI + volume intensity.
Automatic Trendlines: Connects swing points with selectable style and width.
Fibonacci Mapping: Automatically projects fib retracements (23.6%, 38.2%, 50%, 61.8%, 78.6%) from swing-to-swing for confluence zones.
Statistics Panel: Displays live metrics — total levels, active/filled count, success rate, and average strength.
Alerts System: Alerts for new swing formations and when price touches or breaks a level.
Multi-Timeframe Option: Analyze swing structures from higher timeframes on any chart.
Dual Theme Mode: Fully optimized for both Dark and Light interface preferences.
⚙️ Advanced Options
Adjustable lookback range
Hide or extend filled levels
Configurable volume and OI thresholds
Supports multiple OI data sources (Binance, BitMEX, Kraken)
Fully dynamic text, color, and label alignment settings
💡 Use Case
Perfect for Smart Money Concept (SMC) and ICT-style analysis, liquidity sweeps, and swing-based trading.
Traders can quickly visualize where liquidity sits, track how it gets filled, and monitor structure shifts in real time.

Aggregated Open Interest Multi-Exchange (USD)This indicator aggregates Open Interest (OI) data from multiple major cryptocurrency exchanges into a single unified view in USD, using data available on TradingView. It automatically adapts to the asset you're viewing on the chart.
Features:
Aggregates OI from 7 major exchanges: Binance, Bybit, OKX, Bitget, Deribit, HTX, and Coinbase
All values converted to USD - unlike native OI which shows contracts/coins
Uses only data available on TradingView platform
Automatically detects the asset from your chart (BTC, ETH, SOL, etc.)
True apples-to-apples comparison across exchanges
Displays as candlesticks showing OI open, high, low, and close
Toggle exchanges on/off individually
Handles different contract types per exchange automatically
Why USD conversion matters:
Traditional OI indicators show values in contracts or crypto units, making it difficult to compare across exchanges. This indicator converts everything to USD, giving you the real dollar value of open positions across all exchanges.
How it works:
Simply add the indicator to any crypto perpetual futures chart. It will automatically fetch and aggregate OI data from all supported exchanges for that asset using TradingView's built-in data feeds, converting everything to USD.
Supported Exchanges:
Binance, Bybit, Bitget, HTX: USDT perpetuals
Deribit: BTC/ETH use USD contracts, others use USDC
OKX: Contract-based (automatically converted)
Coinbase: USDC perpetuals
Perfect for traders who want a comprehensive view of total market Open Interest in USD across exchanges using reliable TradingView data.

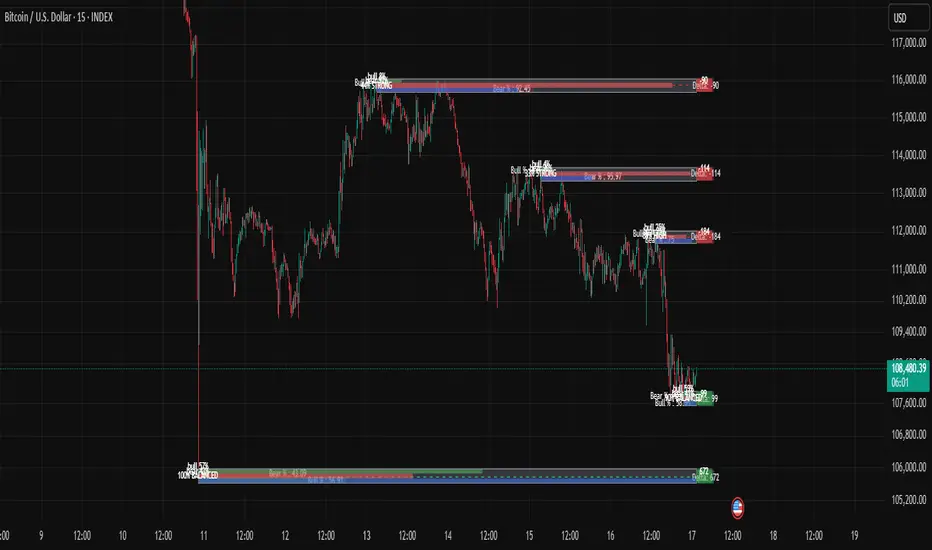
Mimic liquidity Order Blocks Modifiedits help to find liquidity order block and the bull bear percentage also delta
Tick-Based Delta Volume BubblesTICK-BASED DELTA VOLUME BUBBLES
OVERVIEW
A real-time order flow indicator that displays volume delta at the tick level, helping traders identify buying and selling pressure as it develops during live market hours. Unlike traditional volume delta indicators that rely on bar close data, this indicator captures actual tick-by-tick volume changes and directional bias, providing granular insight into market dynamics.
HOW IT WORKS
The indicator monitors live tick data during real-time trading by tracking volume increases between consecutive price updates. Each time volume increments, the script calculates the volume delta, determines price direction, assigns directional bias to the volume, and accumulates net delta for each bar.
This methodology is identical to the tick detection mechanism used in professional cumulative volume delta tools, ensuring accuracy and reliability.
FEATURES
Real-Time Tick Detection
- Captures genuine tick-by-tick volume flow using varip persistence
- Not estimated from OHLC data
- Processes actual market ticks as they occur
Adaptive Bubble Sizing
- Bubbles scale based on delta strength relative to a customizable moving average (default 20 bars)
- Highlights significant order flow imbalances
- Five size levels from tiny to huge
Dual Display Modes
- Normal Mode: Sized bubbles with optional volume labels positioned at bar midpoint
- Minimal Mode: Clean dots above/below bars for unobtrusive delta visualization
Flow Classification
- Aggressive Buy (bright green): Strong positive delta with greater than 1.2x strength
- Aggressive Sell (bright red): Strong negative delta with greater than 1.2x strength
- Passive Buy (light green): Moderate positive delta
- Passive Sell (light red): Moderate negative delta
Intensity Mode (Optional)
- Gray: Low intensity (less than 0.5x average)
- Blue: Medium intensity (0.5-1.0x average)
- Orange: High intensity (1.0-2.0x average)
- Red: Extreme intensity (greater than 2.0x average)
Smart Filtering
- Percentile-based filters (customizable) ensure only significant delta events are displayed
- Reduces chart clutter while highlighting important order flow
- Separate thresholds for bubble display and numeric labels
Data Collection Status
- Optional progress box in top-right corner
- Shows real-time bar collection progress
- Displays percentage completion and bars remaining
- Automatically hides when sufficient data is collected
Hide Until Ready Option
- Suppresses bubble display until the averaging period is complete
- Prevents misleading signals from incomplete data
- Default requires 20 bars before displaying bubbles
SETTINGS
Delta Average Length (1-200, default 20)
- Lookback period for calculating delta strength baseline
- Higher values = longer-term delta comparison
- Lower values = more sensitive to recent changes
Hide Bubbles Until Enough Data
- Prevents display until averaging period completes
- Ensures reliable delta strength calculations
Show Data Collection Status Box
- Displays progress indicator during initialization
- Can be disabled if you understand the warmup period
Minimal Mode
- Switches to simple dot display above/below bars
- Green dots above bars = positive delta
- Red dots below bars = negative delta
- Maintains color intensity or flow type classification
Show Bubbles
- Master toggle for bubble display
Bubble Volume Percentile (0-100, default 60)
- Minimum percentile rank required to display bubble
- Higher values = fewer, more significant bubbles
- Lower values = more bubbles displayed
Show Numbers in Bubbles
- Toggle delta value labels
- Only appears in normal mode
- Disabled automatically in minimal mode
Label Volume Percentile (0-100, default 90)
- Higher threshold for displaying numeric labels
- Typically set higher than bubble percentile
- Reduces label clutter on chart
Intensity Mode
- Switch from flow-type coloring to magnitude-based coloring
- Useful for identifying volume spikes regardless of direction
IMPORTANT NOTES
Real-Time Only: This indicator processes live tick data and does not provide historical analysis. It begins collecting data when added to a live chart.
Volume Required: Symbol must have volume data available. Will not function on symbols without volume (most forex pairs from retail brokers).
Initialization Period: Requires the specified number of bars (default 20) to calculate accurate delta strength. Use the "Hide Until Ready" option to prevent premature signals.
Market Hours: Only collects data during live market hours. Does not backfill historical data.
CREDITS
Tick detection methodology inspired by the Kioseff Trading Tick CVD indicator. This implementation adapts the same core tick-level volume delta calculation for bubble-style visualization and per-bar delta analysis.

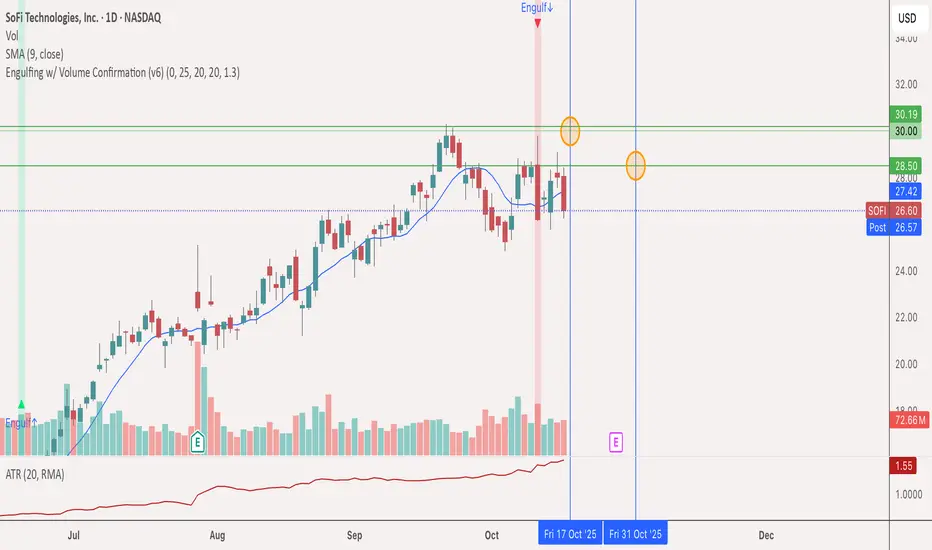
Engulfing bull & bear w/ Volume Confirmation (v6)This script ID's bullish & bearish engulfing bars with volume ≥ SMA (volume, 20) x 1.3 and (optionally) ≥ previous bar's volume.
Parameters adjustable
Regular-Delta RSI Gap Indicator# Regular-Delta RSI Gap Indicator
## Overview
The **Regular-Delta RSI Gap Indicator** is a sophisticated momentum oscillator that compares traditional RSI with volume-based Delta RSI to identify trend strength and potential reversal points. This unique indicator combines price action with volume dynamics to provide enhanced market insights.
## Key Features
### 🔄 Dual RSI Analysis
- **Regular RSI**: Standard RSI based on price changes
- **Delta RSI**: Volume-weighted RSI calculated from volume change rates
- **Visual Comparison**: Clear plotting of both RSIs with ribbon fill
### 💪 Strength Measurement
- **ADX-style Strength Calculation**: Measures the divergence strength between Regular and Delta RSI
- **Configurable Threshold**: Customizable strength level for trend validation
- **Trend Classification**: Identifies strong vs. weak market conditions
### 📊 Multiple Display Options
- **Histogram Visualization**: Columns showing the gap between Regular and Delta RSI
- **Cross Signals**: Triangle markers for crossover events
- **Ribbon Fill**: Color-coded area between the two RSI lines
- **Real-time Table**: Summary table showing current values and trends
## Input Parameters
### Core Settings
- **RSI Period** (default: 14): Calculation period for both RSIs
- **Strength Smoothing** (default: 14): Smoothing period for strength calculation
- **Strength Threshold** (default: 5): Minimum level for strong trend classification
### Visual Customization
- **Show Histogram**: Toggle histogram display
- **Show Signals**: Display crossover signals
- **Show Labels**: Enable trend labels and information table
- **Histogram Height Scale**: Adjust histogram visibility (0.1-3.0)
- **Apply Ribbon Fill**: Enable/disable ribbon coloring
### Color Scheme
- Fully customizable colors for bullish, bearish, neutral, and strength elements
## Interpretation
### Trend Signals
- **Strong Uptrend**: Regular RSI > Delta RSI + Strength above threshold
- **Strong Downtrend**: Regular RSI < Delta RSI + Strength above threshold
- **Weak Trend**: Strength below threshold
### Key Levels
- **Overbought**: 70 level (red line)
- **Oversold**: 30 level (blue line)
- **Midline**: 50 level (gray dotted line)
- **Zero Line**: Histogram baseline
- **Threshold**: Strength reference line
### Signal Types
1. **Crossover Signals**: Regular RSI crossing above/below Delta RSI
2. **Strength Transitions**: Strength line crossing threshold
3. **Histogram Patterns**: Column color and height changes
## Alerts
The indicator provides four alert conditions:
- Divergence Strength Rising
- Divergence Strength Falling
- RSI Crossover (Regular above Delta)
- RSI Crossunder (Regular below Delta)
## Use Cases
- **Trend Confirmation**: Validate price trends with volume confirmation
- **Reversal Detection**: Spot potential trend changes early
- **Momentum Analysis**: Gauge market momentum strength
- **Divergence Trading**: Identify regular/volume RSI divergences
## Optimization Tips
- Adjust period lengths based on trading timeframe
- Modify threshold based on market volatility
- Combine with price action for confirmation
- Use in conjunction with support/resistance levels
This indicator is particularly useful for traders looking to incorporate volume confirmation into their RSI analysis and identify high-probability trend continuations or reversals.

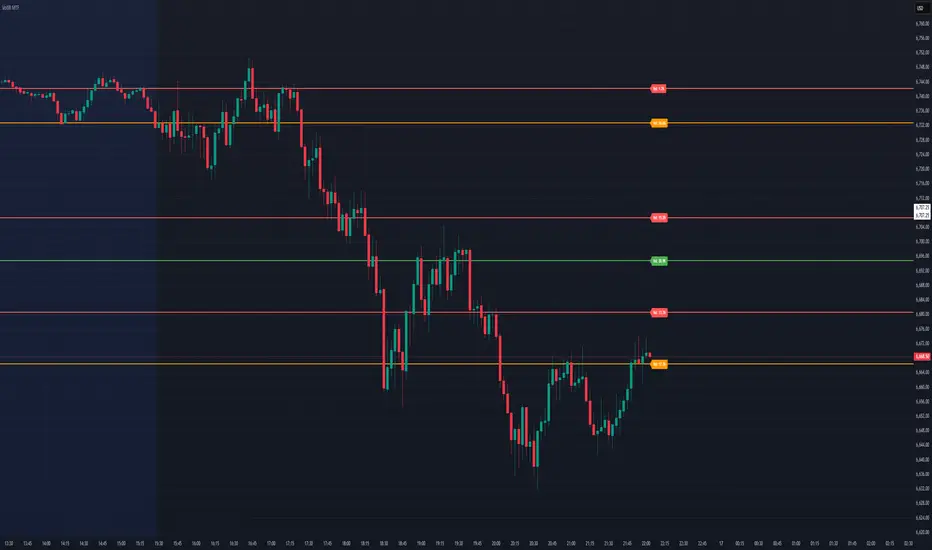
Dynamic Volume Based Key Price LevelsDescription
This indicator introduces a volume-based approach to detecting support and resistance zones.
Instead of relying on price swings or pivots, it analyzes where the most trading activity occurred within a selected lookback period, then marks those levels directly on the chart.
The result is a clear visual map of price areas with strong historical participation, which often act as reaction zones in future moves.
How It Works
The script divides the analyzed range into price bins, sums traded volume for each bin, and highlights the strongest levels based on their share of total volume.
It also includes an optional multi-timeframe mode, allowing traders to analyze higher timeframe volume structures on a lower timeframe chart.
Key Features
🔹 Volume-Based Key Levels Detection: Finds statistically meaningful price zones derived from raw volume data.
🔹 Multi-Timeframe Mode: Optionally use higher timeframe volume to identify key market structure levels.
🔹 Visual Customization: Configure colors, line styles, transparency, and label formatting.
🔹 Automatic Ranking: Highlights the strongest to weakest levels using a color gradient.
🔹 Dynamic Updates: Levels adapt automatically as new bars form.
Inputs Overview
Lookback Bars: Number of historical bars used for analysis.
Price Bins: Defines the precision of volume distribution.
Number of Lines: How many key levels to display.
Min Volume %: Filters out less relevant low-volume bins.
Extend Lines: Choose how lines are projected into the future.
Use Higher Timeframe: Pull data from a higher timeframe for broader perspective.
How to Use
Apply the indicator to your chart and adjust the lookback period.
Optionally enable higher timeframe mode for more stable long-term zones.
Observe the horizontal lines — these represent volume-weighted support and resistance areas.
Combine with your existing tools for trend or momentum confirmation.
This tool helps visualize where market participation was strongest, giving traders a clearer view of potential reaction zones for both intraday and swing analysis.
It’s intended as a visual analytical aid, not a signal generator.
⚠️Disclaimer:
This script is provided for educational and informational purposes only. It is not financial advice and should not be considered a recommendation to buy, sell, or hold any financial instrument. Trading involves significant risk of loss and is not suitable for every investor. Users should perform their own due diligence and consult with a licensed financial advisor before making any trading decisions. The author does not guarantee any profits or results from using this script, and assumes no liability for any losses incurred. Use this script at your own risk.
Londen & New York Sessies (UTC+2)This script highlights the London and New York trading sessions on the chart, adjusted for UTC+2 timezone. It's designed to help traders easily visualize the most active and liquid periods of the Forex and global markets directly on their TradingView charts. The London session typically provides strong volatility, while the New York session brings increased momentum and overlaps with London for powerful trading opportunities. Ideal for intraday and session-based strategies.

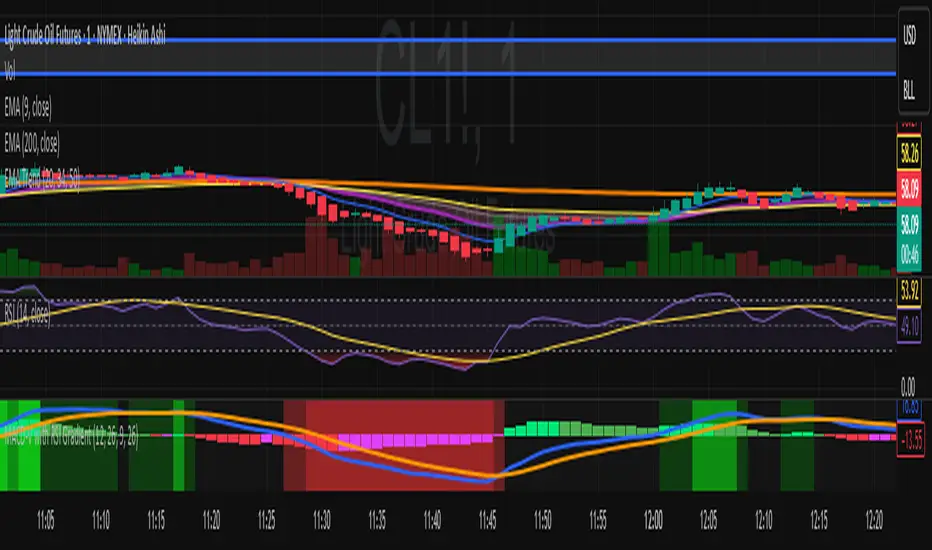
MACD-V with RSI Gradient## Overview
MACD-V is a volatility-adjusted momentum indicator that normalizes MACD using ATR. This version adds a dynamic RSI-based background gradient to highlight momentum zones visually.
## Features
- **MACD-V Line**: EMA-based momentum normalized by ATR
- **Signal Line**: EMA of MACD-V
- **Histogram**: Color-coded based on slope and polarity
- **RSI Gradient Background**: Shading from bright green (RSI > 75) to bright red (RSI < 30), with intermediate tones for momentum context
## Use Case
Designed for 30-minute oil futures charts, this indicator helps identify:
- Trend strength and reversals
- Momentum zones using RSI shading
- Pullback opportunities and exhaustion zones
## Inputs
- Fast EMA (default: 12)
- Slow EMA (default: 26)
- Signal EMA (default: 9)
- ATR Length (default: 26)
## Notes
- RSI shading is purely visual—no alerts are wired in yet
- Histogram renders behind MACD-V and Signal lines for clarity
- Colors are tuned for dark charts
## Credits
The MACD-v is an indicator created in 2015 by Alex Spiroglou
and presented to the public in 2022
as a paper called: "𝗠𝗔𝗖𝗗-𝘃: 𝗩𝗼𝗹𝗮𝘁𝗶𝗹𝗶𝘁𝘆 𝗡𝗼𝗿𝗺𝗮𝗹𝗶𝘀𝗲𝗱 𝗠𝗼𝗺𝗲𝗻𝘁𝘂𝗺"
It received the following Awards:
1. “𝐅𝐨𝐮𝐧𝐝𝐞𝐫𝐬 𝐀𝐰𝐚𝐫𝐝” (2022),
for advances in Active Investment Management
from the National Association of Active Investment Managers (NAAIM)
2. “𝐂𝐡𝐚𝐫𝐥𝐞𝐬 𝐇. 𝐃𝐨𝐰 𝐀𝐰𝐚𝐫𝐝” (2022)
for outstanding research in Technical Analysis,
from the Chartered Market Technicians Association (CMTA)
The RSI Gradient was my idea, but quite frankly, if I go looking around I suppose I'll find that others had the same idea.
This is the first time I've ever published any code, so if I stepped on anyone's toes. I'm sorry.

MACD-V with RSI Gradient## Overview
MACD-V is a volatility-adjusted momentum indicator that normalizes MACD using ATR. This version adds a dynamic RSI-based background gradient to highlight momentum zones visually.
## Features
- **MACD-V Line**: EMA-based momentum normalized by ATR
- **Signal Line**: EMA of MACD-V
- **Histogram**: Color-coded based on slope and polarity
- **RSI Gradient Background**: Shading from bright green (RSI > 75) to bright red (RSI < 30), with intermediate tones for momentum context
## Use Case
Designed for 30-minute oil futures charts, this indicator helps identify:
- Trend strength and reversals
- Momentum zones using RSI shading
- Pullback opportunities and exhaustion zones
## Inputs
- Fast EMA (default: 12)
- Slow EMA (default: 26)
- Signal EMA (default: 9)
- ATR Length (default: 26)
## Notes
- RSI shading is purely visual—no alerts are wired in yet
- Histogram renders behind MACD-V and Signal lines for clarity
- Colors are tuned for dark charts
## Credits
Developed by Mark (SylvaRocks), optimized for tactical clarity and scalping precision.
ORBs, EMAs, AVWAPThis Pine Script (version 6) is a multi-session trading indicator that combines Opening Range Breakouts (ORBs), Exponential Moving Averages (EMAs), and an Anchored VWAP (AVWAP) system — all in one overlay script for TradingView.
Here’s a clear breakdown of its structure and functionality:
🕒 1. Session Logic and ORB Calculation
Purpose: Identify and plot the high and low of the first 30 minutes (default) for the Tokyo, London, and New York trading sessions.
Session Anchors (NY time):
Tokyo → 20:00
London → 03:00
New York → 09:30
(All configurable in inputs.)
ORB Duration: Default is 30 minutes (orbDurationMin), also user-configurable.
Resets:
London and NY ORBs reset at the start of each new New York trading day (17:00 NY time).
Tokyo ORB resets independently using a stored timestamp.
Process:
For each session:
While the time is within the ORB window, the script captures the session’s high and low.
Once the window closes, those levels remain plotted until reset.
Plot Colors:
Tokyo → Yellow (#fecc02)
London → Gray (#8c9a9c)
New York → Magenta (#ff00c8)
These form visible horizontal lines marking the prior session ranges — useful for breakout or retest trading setups.
📈 2. EMA System
Purpose: Provide trend and dynamic support/resistance guidance.
It calculates and plots four EMAs:
EMA Period Color Purpose
EMA 9 Short-term Green Fast signal
EMA 20 Short-term Red Confirms direction
EMA 113 Medium Aqua Trend filter
EMA 200 Long-term Orange Macro trend baseline
Each EMA is plotted directly on the price chart for visual confluence with ORB and VWAP levels.
⚖️ 3. Anchored VWAP (AVWAP)
Purpose: Display a volume-weighted average price anchored to specific timeframes or events, optionally with dynamic deviation or percentage bands.
Features:
Anchor Options:
Time-based: Session, Week, Month, Quarter, Year, Decade, Century
Event-based: Earnings, Dividends, Splits
VWAP resets when the chosen anchor condition is met (e.g., new month, new earnings event, etc.).
Bands:
Up to three levels of symmetric upper/lower bands.
Choose between Standard Deviation or Percentage-based widths.
Display Toggles:
Each band’s visibility is optional.
VWAP can be hidden on 1D+ timeframes (hideonDWM option).
Color Scheme:
VWAP: Fuchsia (magenta-pink) line
Bands: Green / Olive / Teal with light-filled zones
⚙️ 4. Technical Highlights
Uses ta.vwap() with built-in band calculations.
Handles instruments with or without volume (errors if missing volume).
Uses time-zone aware timestamps (timestamp(NY_TZ, …)).
Uses timeframe.change() to detect new anchors for the VWAP.
Employs persistent variables (var) to maintain session state across bars.
💡 In Practice
This indicator is designed for multi-session intraday traders who:
Trade Tokyo, London, or NY open breakouts or retests.
Use EMA stacking and crossovers for trend confirmation.
Use Anchored VWAP as a fair-value or mean-reversion reference.
Need clear visual structure across different market sessions.
It provides strong session separation, trend context, and volume-weighted price reference — making it ideal for discretionary or semi-systematic trading strategies focused on liquidity zones and session momentum.
