KIMATIX LITE Delta ProfileThis indicator provides a clean, market-structure view of where participation concentrates and which side is in control across price levels.
The Lite version is intentionally reduced to focus on context over execution while keeping the visual identity of the full profile.
What is shown
Sentiment Profile (right side)
Displays directional dominance at each price level:
Bullish rows when buying pressure dominates
Bearish rows when selling pressure dominates
Point of Control (POC)
Value Area High / Low (VAH / VAL)
Lite Version
No left-side volume profile
No delta labels or historical delta tracking
No lower-timeframe or orderflow proxy
No alerts or event notifications
No visible-range logic or advanced controls
All calculations run on the chart timeframe only, making this version lighter and suitable for public use while preserving structural relevance.
Intended use
This indicator is designed to:
Identify high-interest price zones
Assess directional pressure at each level
Support bias and location decisions
Complement other execution or confirmation tools
It is not an entry or signal system and does not provide trade timing.
The full version is distributed separately.
More information can be found here:
whop.com
Volumetrading

Volume Profile VisionVolume Profile Vision - Complete Description
Overview
Volume Profile Vision (VPV) is an advanced volume profile indicator that visualizes where trading activity has occurred at different price levels over a specified time period. Unlike traditional volume indicators that show volume over time, this indicator displays volume distribution across price levels, helping traders identify key support/resistance zones, fair value areas, and potential reversal points.
What Makes This Indicator Original
Volume Profile Vision introduces several unique features not found in standard volume profile tools:
Dual-Direction Histogram Display:
Unlike conventional volume profiles that only show bars extending in one direction, VPV displays volume bars extending both left (into historical candles) and right (as a traditional histogram). This bi-directional approach allows traders to see exactly where historical price action intersected with high-volume nodes.
Real-Time Candle Highlighting: The indicator dynamically highlights volume bars that intersect with the current candle's price range, making it immediately obvious which volume levels are currently in play.
Four Professional Color Schemes: Each color scheme uses distinct gradient algorithms and visual encoding systems:
Traffic Light: Uses red (POC), green (VA boundaries), yellow (HVN), with grayscale gradients outside the value area
Aurora Glass: Modern cyan-to-magenta gradient with hot magenta POC highlighting
Obsidian Precision: Professional dark theme with white POC and electric cyan accents
Black Ice: Monochromatic cyan family with graduated intensity
Adaptive Transparency System: Automatically adjusts bar transparency based on position relative to value area, with special handling for each color scheme to maintain visual clarity.
Core Concepts & Calculations
Volume Distribution Analysis
The indicator divides the visible price range into user-defined price levels (default: 80 levels) and calculates the total volume traded at each level by:
Scanning back through the specified lookback period (customizable or visible range)
For each historical bar, determining which price levels the bar's high/low range intersects
Accumulating volume for each intersected price level
Optionally filtering by bullish/bearish volume only
Point of Control (POC)
The POC is the price level with the highest traded volume during the analyzed period. This represents the "fairest" price where most traders agreed on value. The indicator marks this with distinct coloring (red in Traffic Light, magenta in Aurora Glass, white in Obsidian Precision, cyan in Black Ice).
Trading Significance: POC acts as a strong magnet for price - markets tend to return to fair value. When price is away from POC, traders watch for:
Mean reversion opportunities when price is far from POC
Rejection signals when price tests POC from above/below
Breakout confirmation when price breaks through and holds beyond POC
Value Area (VA)
The Value Area encompasses the price range where a specified percentage (default: 68%) of all volume traded. This represents the range of "accepted value" by market participants.
Calculation Method:
Start at the POC (highest volume level)
Expand upward and downward, adding adjacent price levels
Always add the level with higher volume next
Continue until accumulated volume reaches the VA percentage threshold
Value Area High (VAH): Upper boundary of accepted value - acts as resistance
Value Area Low (VAL): Lower boundary of accepted value - acts as support
Trading Significance:
Price spending time inside VA indicates market equilibrium
Breakouts above VAH suggest bullish momentum shift
Breakdowns below VAL suggest bearish momentum shift
Returns to VA boundaries often provide high-probability entry zones
High Volume Nodes (HVN)
Price levels with volume exceeding a threshold percentage (default: 80%) of POC volume. These represent areas of strong agreement and consolidation.
Trading Significance:
HVNs act as strong support/resistance zones
Price tends to consolidate at HVNs before making directional moves
Breaking through an HVN often signals strong momentum
Low Volume Nodes (LVN)
Price levels within the Value Area with volume ≤30% of POC volume. These are zones price moved through quickly with minimal consolidation.
Trading Significance:
LVNs represent areas of rejection - price finds little acceptance
Price tends to move rapidly through LVN zones
Useful for setting stop-losses (below LVN for longs, above for shorts)
Can identify potential gaps or "air pockets" in the market structure
Grayscale POC Detection
A secondary POC detection system identifies the highest volume level outside the Value Area (with a 2-level buffer to avoid confusion). This helps identify significant volume accumulation zones that exist beyond the main value area.
How to Use This Indicator
Setup
Choose Lookback Period:
Enable "Use Visible Range" to analyze only what's on your chart
Or set "Fixed Range Lookback Depth" (default: 200 bars) for consistent analysis
Adjust Profile Resolution:
"Number of Price Levels" (default: 80) - higher = more granular analysis, lower = broader zones
Select Color Scheme:
Traffic Light: Best for clear POC/VA/HVN identification
Aurora Glass: Modern aesthetic for dark charts
Obsidian Precision: Professional trader preference
Black Ice: Minimalist single-color family
Visual Customization
Left Extension: How far back the left-side histogram extends into historical candles (default: 490 bars)
Right Extension: Width of the traditional histogram bars on the right (default: 50 bars)
Right Margin: Space between current price bar and histogram (default: 0 for flush alignment)
Left Profile Gap: Space between left-side histogram and candles (default: 0)
Trading Strategies
Strategy 1: Value Area Mean Reversion
Wait for price to move outside the Value Area (above VAH or below VAL)
Look for rejection signals (wicks, bearish/bullish candles)
Enter trades toward the POC
Take profits as price returns to POC or opposite VA boundary
Strategy 2: Breakout Confirmation
Identify when price is consolidating within the Value Area
Wait for a strong close above VAH (bullish) or below VAL (bearish)
Enter on the breakout or on first pullback to the VA boundary
Target previous HVNs or swing highs/lows outside the VA
Strategy 3: POC Support/Resistance
Watch for price approaching the POC level
If approaching from below, look for bullish reversal patterns at POC (support)
If approaching from above, look for bearish reversal patterns at POC (resistance)
Trade in the direction of the bounce with stops beyond the POC
Strategy 4: LVN Fast Movement Zones
Identify LVN zones within the Value Area (marked with "LVN" label)
When price enters an LVN, expect rapid movement through the zone
Avoid entering trades within LVNs
Use LVNs as confirmation of directional momentum
Alert System
The indicator includes 7 customizable alert conditions:
POC Touch: Alerts when price comes within 0.5 ATR of POC
VAH/VAL Touch: Alerts at Value Area boundaries
VA Breakout: Alerts on breakouts above VAH or below VAL
HVN Touch: Alerts when price contacts High Volume Nodes
LVN Entry: Alerts when entering Low Volume zones
POC Shift: Alerts when POC moves to a new price level
Reading the Profile
Price Labels (shown on the right side):
POC: Point of Control - highest volume price level
VAH: Value Area High - upper boundary of accepted value
VAL: Value Area Low - lower boundary of accepted value
LVN: Low Volume Node - expect fast movement through this zone
Color Intensity Interpretation:
Brighter colors = higher volume concentration
Dimmer colors = lower volume
Abrupt color changes = transition between volume zones
Gaps in the histogram = price levels with no trading activity
Technical Details
Volume Accumulation Logic:
For each bar in lookback period:
For each price level:
If bar's high/low range intersects price level:
Add bar's volume to that price level's total
Gradient Algorithm:
Traffic Light: Dual-range piecewise gradient (0-50% and 50-100% volume intensity)
Aurora Glass: Linear cyan-to-magenta interpolation
Obsidian Precision: Dark blue gradient with cyan highlights
Black Ice: Three-stage cyan intensity progression
Real-Time Updates:
The profile recalculates on every bar, including real-time tick data, ensuring the volume distribution always reflects current market structure.
Best Practices
Timeframe Selection: Use higher timeframes (4H, Daily) for swing trading, lower timeframes (5min, 15min) for day trading
Combine with Price Action: Volume profile shows WHERE, price action shows WHEN
Multiple Timeframe Analysis: Check daily VP for major levels, then drill down to intraday for entries
Volume Type Selection: Use "Bullish" volume in uptrends, "Bearish" in downtrends, or "Both" for complete picture
Adjust VA Percentage: 68% (default) captures one standard deviation; try 70% for tighter or 60% for broader value areas
Performance Notes
Maximum bars back: 5000 (handles deep historical analysis)
Maximum boxes: 500 (handles complex profiles)
Optimized calculation: Only recalculates on last bar for efficiency
Real-time capable: Updates as new ticks arrive

Price Volume Heatmap [MHA Finverse]Price Volume Heatmap - Advanced Volume Profile Analysis
Unlock the power of institutional-level volume analysis with the Price Volume Heatmap indicator. This sophisticated tool visualizes market structure through volume distribution across price levels, helping you identify key support/resistance zones, high-probability reversal areas, and optimal entry/exit points.
🎯 What Makes This Indicator Unique?
Unlike traditional volume indicators that only show volume over time, this heatmap displays volume distribution across price levels , revealing where the most significant trading activity occurred. The gradient coloring system instantly highlights high-volume nodes (areas of strong interest) and low-volume nodes (potential breakout zones).
📊 Core Features
1. Dynamic Volume Heatmap
- Visualizes volume concentration across 250 customizable price levels
- Gradient color scheme from high volume (white) to low volume (teal/green)
- Adjustable brightness multiplier for enhanced contrast and clarity
- Real-time updates as market conditions evolve
2. Point of Control (POC)
- Automatically identifies the price level with the highest traded volume
- Acts as a magnetic price level where markets often return
- Critical for identifying fair value areas and potential reversal zones
- Customizable line style, width, and color
3. Flexible Lookback Settings
- Lookback Bars: Set any value from 1-5000 bars to control analysis depth
- Visible Range Mode: Analyze only what's currently visible on your chart
- Timeframe-Specific Settings: Different lookback periods for 1m, 5m, 15m, 30m, 1h, Daily, and Weekly charts
- Adapts to your trading style - scalping to position trading
4. Session Separation Analysis
- Tokyo Session: 00:00-09:00 UTC
- London Session: 07:00-16:00 UTC
- New York Session: 13:00-22:00 UTC
- Sydney Session: 21:00-06:00 UTC
- Daily Reset: Analyze each trading day independently
Session separation allows you to understand volume distribution specific to each major trading session, revealing institutional order flow patterns and session-specific support/resistance levels.
5. Profile Width Options
- Dynamic: Profile width adjusts based on lookback period
- Fixed Bars: Set a specific bar count for consistent profile width
- Extend Forward: Project the profile into future bars for planning trades
6. Smart Alerts
- POC crossover/crossunder alerts
- New session start notifications
- Never miss critical price action at high-volume nodes
📈 How to Use This Indicator Professionally
Understanding Market Structure:
High Volume Nodes (HVN):
- Appear as bright/white areas in the heatmap
- Represent price levels where significant trading occurred
- Act as strong support/resistance zones
- Markets often consolidate or bounce from these levels
- Trading Strategy: Look for entries when price tests HVN areas with confluence from other indicators
Low Volume Nodes (LVN):
- Appear as darker/teal areas in the heatmap
- Represent price levels with minimal trading activity
- Price tends to move quickly through these areas
- Often form "gaps" in the volume profile
- Trading Strategy: Expect rapid price movement through LVN zones; avoid placing stop losses here
Point of Control (POC):
- The single most important price level in your analysis window
- Represents the fairest price where maximum volume traded
- Price gravitates toward POC like a magnet
- Trading Strategy:
* When price is above POC: bullish bias, POC acts as support
* When price is below POC: bearish bias, POC acts as resistance
* POC breaks often lead to significant trend changes
Session-Based Analysis:
Use session separation to understand how different market participants trade:
Asian Session (Tokyo/Sydney):
- Typically lower volatility and range-bound
- Volume profiles often show tight, balanced distribution
- Use for identifying overnight ranges and gap fill zones
London Session:
- Highest volume session for forex pairs
- Often shows strong directional bias
- Look for breakouts from Asian ranges during London open
New York Session:
- Maximum participation when overlapping with London
- Institutional order flow most visible
- POC during NY session often becomes key level for following sessions
🎯 Practical Trading Applications
1. Identifying Support & Resistance:
High volume nodes from the heatmap are far more reliable than traditional swing highs/lows. When price approaches an HVN, expect reaction - either a bounce or a significant breakout if breached.
2. Trend Confirmation:
- Healthy uptrend: POC rising over time, HVN forming at higher levels
- Healthy downtrend: POC falling over time, HVN forming at lower levels
- Consolidation: POC relatively flat, volume balanced across range
3. Breakout Trading:
When price breaks through a Low Volume Node with momentum, it often continues to the next High Volume Node. Use LVN areas as measured move targets.
4. Reversal Zones:
Multiple HVN stacking on top of each other creates a "volume shelf" - an extremely strong support/resistance zone where reversals are highly probable.
5. Risk Management:
- Place stops beyond HVN areas (not within LVN zones)
- Size positions based on distance to nearest HVN
- Use POC as trailing stop level in trending markets
⚙️ Recommended Settings
For Day Trading (Scalping/Intraday):
- Lookback: 200-500 bars
- Rows: 200-250
- Enable session separation for your primary trading session
- Profile Width: Dynamic or Fixed Bars (30-50)
For Swing Trading:
- Lookback: 500-1000 bars
- Rows: 250
- Session separation: Daily Reset
- Profile Width: Dynamic
For Position Trading:
- Lookback: 1000-3000 bars
- Rows: 250
- Use timeframe-specific settings
- Profile Width: Extend Forward (20-50 bars)
💡 Pro Tips
1. Combine this indicator with price action analysis - volume confirms what price is telling you
2. Watch for POC convergence with other technical levels (fibonacci, pivot points, moving averages)
3. Volume at extremes (tops/bottoms of heatmap) often indicates exhaustion
4. Session POC from previous sessions often acts as magnet for current session
5. Increase brightness multiplier (1.5-2.5) for clearer visualization on busy charts
6. Use "Number of Sessions to Display" to analyze consistency of volume levels across multiple sessions
🎨 Customization
Fully customizable visual appearance:
- Gradient colors for volume visualization
- POC line thickness, color, and style
- Session line colors and visibility
- All settings organized in intuitive groups
⚠️ Disclaimer
This indicator is a technical analysis tool and should not be used as the sole basis for trading decisions. Always combine volume analysis with proper risk management, fundamental analysis, and other technical indicators. Past performance does not guarantee future results.
---
Support & Updates
Regular updates and improvements are made to enhance functionality. For questions, suggestions, or bug reports, please use the comments section below.
Happy Trading! 📊💹

Volume essential parameters overlayVolume EPO – Essential Volume Parameters Overlay
1. Motivation and design philosophy
Volume EPO is designed as a conceptual overlay rather than a self contained trading system. The main idea behind this script is to take complex, foundational market concepts out of heavy, menu driven strategies and express them as lightweight, independent layers that sit on top of any chart or indicator.
In many TradingView scripts, a single strategy tries to handle everything at once: signal logic, risk settings, visual cues, multi timeframe controls, and conceptual explanations. This usually leads to long input menus, performance issues, and difficult maintenance. The architectural approach behind Volume EPO is the opposite: keep the core strategy lean, and move the explanation and measurement of key concepts into dedicated overlays.
In this framework, Volume EPO is the base layer for the concept of volume. It does not decide anything about entries or exits. Instead, it exposes and clarifies how different definitions of volume behave candle by candle. Other layers or strategies can then build on top of this understanding.
2. What Volume EPO does
Volume EPO focuses on four essential volume parameters for each bar:
- Buy volume - Sell volume - Total volume - Delta volume (the difference between buy and sell volume)
The script presents these parameters in a compact heads up display (HUD) table that can be positioned anywhere on the chart. It is designed to be visually minimal, language aware, and usable on top of any other indicator or price action without cluttering the view.
The indicator does not output signals, alerts, arrows, or strategy entries. It is a descriptive and educational tool that shows how volume is distributed, not a prescriptive tool that tells the trader what to do.
3. Two definitions of volume
A central theme of this script is that there is more than one way to define and interpret “volume” inside a single candle. Volume EPO implements and clearly separates two different approaches:
- A geometric, candle based approximation that uses only OHLC and volume of the current bar. - An intrabar, data driven definition that uses lower timeframe up and down volume when it is available.
The user can switch between these modes via the calculation method input. The mode is prominently shown inside the on chart table so that the context is always explicit.
3.1 Geometry mode (Source File, approximate)
In Geometry mode, Volume EPO works only with the current bar’s OHLC values and total volume. No lower timeframe data is required.
The candle’s range is defined as high minus low. If the range is positive, the position of the close inside that range is used as a simple model for how volume might have been distributed between buyers and sellers:
- The closer the close is to the high, the more of the total volume is attributed to the buying side. - The closer the close is to the low, the more of the total volume is attributed to the selling side. - In a rare case where the bar has no price range (for example a flat or doji bar), total volume is split evenly between buy and sell volume.
From this model, the script derives:
- Buy volume (approximated) - Sell volume (approximated) - Total volume (as reported by the bar) - Delta volume as the difference between buy and sell volume
This approach is intentionally labeled as “Geometry (Approx)” in the HUD. It is a theoretical reconstruction based solely on the candle’s geometry and total volume, and it is always available on any market or timeframe that provides OHLCV data.
3.2 Intrabar mode (Precise)
In Intrabar mode, Volume EPO uses the TradingView built in library for up and down volume on a user selected lower timeframe. Instead of inferring volume from the shape of the candle, it reads the underlying lower timeframe data when that data is accessible.
The script requests up and down volume from a lower timeframe such as 15 seconds, using the official TA library functions. The results are then interpreted as follows:
- Buy volume is taken as the absolute value of the up volume. - Sell volume is taken as the absolute value of the down volume. - Total volume is the sum of buy and sell volume. - Delta volume is provided directly by the library as the difference between up and down volume.
If valid lower timeframe data exists for a bar, the bar is counted as covered by Intrabar data. If not, that bar is marked as invalid for this precise calculation and is excluded from the covered count.
This mode is labeled “Precise” in the HUD, together with the selected lower timeframe, because it is anchored in actual intrabar data rather than in a geometric model. It provides a closer view of how buying and selling pressure unfolded inside the bar, at the cost of requiring more data and being dependent on the availability of that data.
4. Coverage, lookback, and what the numbers mean
The top part of the HUD reports not only which volume definition is active, but also an additional line that describes the effective coverage of the data.
In Intrabar (Precise) mode, the script displays:
- “Scanned: N Bars”
Here, N counts how many bars since the indicator was loaded have successfully received valid lower timeframe delta data. It is a measure of how much of the visible history has been truly covered by intrabar information, not a lookback window in the sense of a rolling calculation.
In Geometry mode, the script displays:
- “Lookback: L Bars”
In this extracted layer, the lookback value L is purely descriptive. It does not change how the current bar’s volume is computed, and it is not used in any iterative or statistical calculation inside this script. It is meant as a conceptual label, for example to keep the volume layer consistent with a broader framework where lookback length is a structural parameter.
Summarizing these two fields:
- Scanned tells you how many bars have been processed using real intrabar data. - Lookback is a descriptive parameter in Geometry mode in this specific overlay, not a direct driver of the computations.
5. The HUD layout on the chart
The on chart table is intentionally compact and structured to be read quickly:
- Header: a title identifying the overlay as Volume EPO. - Mode line: explicitly states whether the script is in Precise or Geometry mode, and for Precise mode also shows the lower timeframe used. - Coverage line: - In Precise mode, it shows “Scanned: N Bars”. - In Geometry mode, it shows “Lookback: L Bars”. - Volume block: - A line for buy and sell volume, marked with clear directional symbols. - A line for total volume and the absolute delta, accompanied by the sign of the delta. - Numeric formatting uses human friendly suffixes (for example K, M, B) to keep the display readable. - Footer: the current symbol and a time stamp, adjusted by a user selectable timezone offset so that the HUD can be aligned with the trader’s local time reference.
The table can be positioned anywhere on the chart and resized via inputs, and it supports multiple color themes and languages in order to integrate cleanly into different chart layouts.
6. How to use Volume EPO in practice
Volume EPO is meant to be read together with price action and other tools, not in isolation. Typical uses include:
- Studying how often a strong directional candle is actually supported by dominant buy or sell volume. - Comparing the behavior of delta volume between Geometry and Intrabar definitions. - Building a personal intuition for how intrabar data refines or contradicts the simple candle based approximation. - Feeding these insights into separate, lean strategy scripts that do not need to carry the full explanatory logic of volume inside them.
Because it is an overlay layer, Volume EPO can be stacked with other custom indicators without adding new signals or complexity to their logic. It simply adds a clear and consistent view of volume behavior on top of whatever the trader is already watching.
7. Educational and non signalling nature
Finally, it is important to stress that Volume EPO is not a trading system, not a signal generator, and not financial advice. The script does not tell the user when to enter or exit. It only reports how different definitions of volume describe the current bar.
Deciding whether to trade, how to trade, and which risk parameters to use remains entirely with the user and with their own strategy. Volume EPO provides context and clarity around the concept of volume so that those decisions can be informed by a better understanding of how buying and selling pressure is structured inside each candle.
Note: Even on lower timeframes, every reconstruction of volume remains an approximation, except at the true single tick level. However, the closer the chosen lower timeframe is to a one tick stream, the more accurately it can reflect the underlying order flow and balance between buying and selling pressure.

Institution Radar Institution Radar
Institution Radar compares Price RSI with Volume-Delta RSI to show when price moves are real (backed by volume) or fake (moving without volume).
This helps reveal two powerful concepts:
Absorption (Bullish or Bearish)
Absorption happens when a large limit order is sitting in the order book.
Market orders hit it over and over, but the level doesn't break.
This usually means:
Strong players are absorbing the aggressive orders
Price is likely to move in the opposite direction
The next candle often reacts immediately
Can lead to a full reversal or just a short 1–2 candle move
Exhaustion (Bullish or Bearish)
Exhaustion happens when institutions pull their limit orders away.
There is no real volume behind the move, so price drifts up or down easily.
This usually means:
The current move is weak
A slowdown, pullback, or reversal is likely
Often shows up right before a flip in direction
📌 What the Signals Mean
Green signal → next candles often push upward
Red signal → next candles often push downward
These can mark trend reversals or temporary 1–2 candle reactions
🎚️ Sensitivity Setting
You can adjust how strict the signals are:
Lower sensitivity = more signals, more noise
Higher sensitivity = fewer signals, but more accurate and stronger
A higher sensitivity is recommended if you only want the cleanest institutional moments.

Normalised Volume Oscillator [BackQuant]Normalised Volume Oscillator
A refined evolution of the Klinger Volume Oscillator, rebuilt for clarity, precision, and adaptability. This tool normalizes volume-driven momentum into a bounded scale so you can easily identify shifts in accumulation and distribution across any asset or timeframe, while keeping readings comparable between markets.
What this indicator does
The Normalised Volume Oscillator quantifies the balance between buying and selling pressure using the Klinger Volume Oscillator (KVO) as its base, then rescales it dynamically into a normalized range between -0.5 and +0.5. This normalization allows traders to interpret relative strength and exhaustion in volume flow, rather than dealing with raw unbounded values that differ across symbols.
It is a momentum-volume hybrid that reveals the strength of trend participation: when buyers dominate, normalized readings rise toward +0.5; when sellers dominate, they fall toward -0.5. The midline (0) acts as an equilibrium between accumulation and distribution.
Core components
Klinger Volume Oscillator: The foundation of this indicator, combining volume with price trend direction to measure long-term money flow relative to short-term movement.
Normalization process: The raw KVO is scaled over a user-defined Normalisation Period , computing `(KVO - lowest) / (highest - lowest) - 0.5`. This centers all readings around zero, allowing overbought/oversold detection independent of asset volatility or volume magnitude.
Signal moving average: The normalized KVO is smoothed with a user-selectable moving average type—SMA, EMA, DEMA, TEMA, HMA, ALMA, and others. This becomes the signal line for confirmation of trend direction or mean-reversion setups.
How it works conceptually
1. The KVO detects when volume supports price movement (bullish) or diverges from it (bearish).
2. The script normalizes the raw KVO so that relative magnitude is consistent—what is “strong buying pressure” looks the same on BTCUSD as it does on AAPL.
3. Overbought and oversold regions are derived statistically, rather than from arbitrary values, based on percentile zones around ±0.4 and ±0.5.
4. The oscillator is optionally combined with a moving average to help identify crossovers, momentum shifts, and divergence confirmation.
How to interpret it
Above 0: Indicates dominant buying pressure and likely continuation of upward momentum.
Below 0: Suggests dominant selling pressure and potential continuation of downward movement.
Crosses of 0: Often mark transitions between accumulation and distribution phases.
+0.4 to +0.5 zone: Overbought region where buying intensity is stretched; watch for deceleration or divergence.
[-0.4 to -0.5 zone: Oversold region indicating panic or exhaustion in selling.
Signal-line crossover: A traditional momentum confirmation method; when the normalized KVO crosses above its moving average, buyers regain control, and vice versa.
Why normalization matters
Typical volume oscillators are asset-specific—what is considered “high” volume for one symbol is not the same for another. By dynamically normalizing KVO values within a rolling lookback, this version transforms raw amplitude into a standardized scale. This means you can:
Compare multiple assets objectively.
Set consistent alert thresholds for overbought/oversold regions.
Avoid misleading interpretations from absolute oscillator values.
Customization and UI
Moving Average Type & Period: Select your preferred smoothing method (SMA, EMA, TEMA, etc.) and adjust its period to tune sensitivity.
Normalisation Period: Defines how many bars the KVO range is measured over; shorter periods adapt faster, longer ones smooth more.
Visual Toggles:
* Show Oscillator : enables or hides the core histogram.
* Show Moving Average : adds a smoothed overlay for signal confirmation.
* Paint Candles : optional color overlay for chart candles based on oscillator direction.
* Show Static Levels : displays ±0.4 and ±0.5 zones for overbought/oversold boundaries.
How to use it
Trend confirmation: Use midline (0) crossovers as confirmation of emerging trend shifts—cross above 0 suggests a new bullish phase, cross below 0 a bearish one.
Reversal spotting: Look for normalized readings reaching ±0.5 and flattening, or diverging against price extremes.
Divergence analysis: When price makes a new high but the normalized oscillator fails to, it signals waning buying conviction (and vice versa for lows).
Multi-timeframe integration: Works best alongside higher timeframe trend filters or moving averages; normalization makes this consistent.
Alerts
Prebuilt alert conditions allow quick automation:
Midline crossovers (0): transition between accumulation and distribution.
Overbought (+0.4) and Oversold (-0.4) triggers for potential exhaustion.
Signal moving-average crosses for confirmation entries.
Tips for use
Combine with price structure—don’t fade every overbought/oversold reading; confirm with break of structure or candle patterns.
Use longer normalization periods for position trading, shorter for intraday analysis.
In choppy markets, treat 0-line oscillations as noise filters, not trade triggers.
Summary
The Normalised Volume Oscillator modernizes the classic Klinger Volume Oscillator by normalizing its readings into a standardized range. This makes it more adaptive across assets and timeframes, improves interpretability, and provides intuitive, data-driven overbought/oversold levels. Whether used standalone or as a confirmation layer, it offers a clearer view of volume dynamics—revealing when markets are truly being accumulated, distributed, or stretched beyond their sustainable extremes.

Volume HeatMap Divergence [BigBeluga]🔵 OVERVIEW
The Volume HeatMap Divergence is a smart volume visualization tool that overlays normalized volume data directly on the chart. Using a color heatmap from aqua to red, it transforms raw volume into an intuitive scale — highlighting areas of weak to intense market participation. Additionally, it detects volume-based divergences from price to signal potential reversals or exhaustion zones. Combined with clear visual labeling, this tool empowers traders with actionable volume insights.
🔵 CONCEPTS
Normalized Volume Heatmap : Volume is normalized to a 0–100% scale and visually represented as candles below the chart.
float vol = volume / ta.percentile_nearest_rank(volume, 1000, 100) * 100
Bar Coloring : Price candles are dynamically colored based on volume intensity.
Volume Divergence Logic :
Bullish Divergence : Price forms a lower low, but volume forms a higher low.
Bearish Divergence : Price forms a higher high, but volume forms a lower high.
Dynamic Detection Range : Customizable range ensures divergence signals are meaningful and not random.
Volume Labels : Additional info on divergence bars shows both the actual volume and its normalized % score.
🔵 FEATURES
Volume Heatmap Plot : Normalized volume values colored using a smooth gradient from aqua (low) to red (high).
Price Bar Coloring : Candlesticks on the main chart adopt the same heatmap color based on volume.
Divergence Detection :
Bullish divergence with label and low marker
Bearish divergence with label and high marker
Dual Divergence Labels :
On the volume plot : Direction (Bull/Bear), raw volume, and normalized %
On the price chart : Shape labels showing "Bull" or "Bear" at local highs/lows
Custom Inputs :
Divergence range (min & max), pivot detection distance (left/right)
Toggle to show/hide divergence labels, volume, and % text
Clear Bull/Bear Coloring : Fully customizable label and line colors for both bullish and bearish signals.
🔵 HOW TO USE
Use the indicator as an overlay to monitor real-time volume strength using the heatmap color.
Watch for divergence markers:
Bullish divergence: Candle shows higher volume while price makes a new low
Bearish divergence: Candle shows lower volume while price makes a new high
Use the volume info labels to verify the context of divergence:
Actual volume at divergence candle
Normalized % of that volume compared to past 1000 bars
Adjust pivot sensitivity using "Pivot Left" and "Pivot Right" to tune signal frequency and lag with a right pivot length.
Use divergence zones as early warnings for potential reversals or trend shifts.
Disable or customize labels in settings depending on your charting preferences.
🔵 CONCLUSION
Volume HeatMap Divergence merges heatmap-style volume visualization with intelligent divergence detection — giving traders a clean yet powerful edge. By revealing hidden disconnections between price and participation, it helps users spot exhaustion moves or hidden accumulation zones before the market reacts. Whether you’re a scalper, swing trader, or intraday strategist, this tool offers real-time clarity on who’s in control behind the candles.

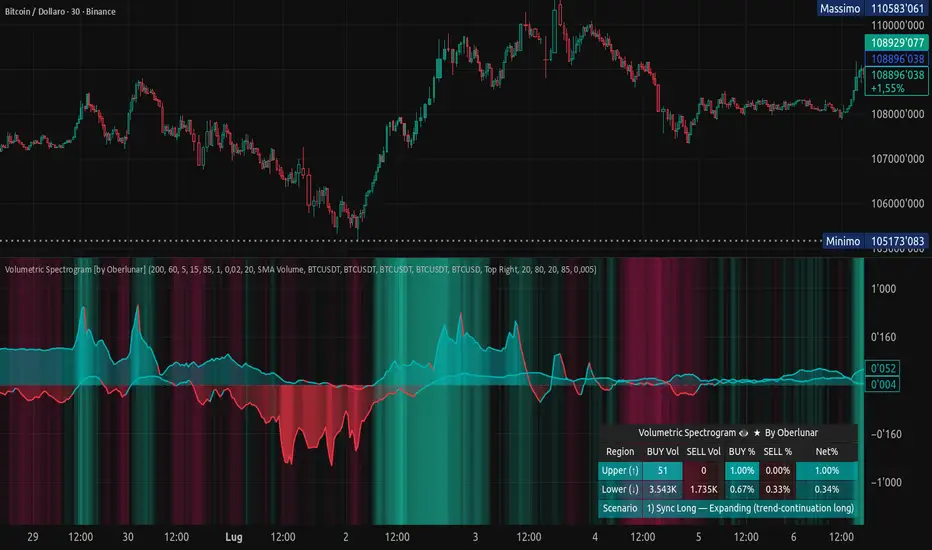
Volumetric Spectrogram [by Oberlunar]Volumetric Spectrogram
A two-pole, price-relative volume profiler that turns regional buy/sell pressure into clean oscillators and actionable regimes in a multi-broker setup.
What it measures
The indicator divides the recent price span into bins and accumulates buy vs. sell volume in each bin, then summarises two regions with respect to the current price:
Upper (↑) — volume that traded above the current price (overhead supply/demand).
Lower (↓) — volume that traded below the current price (underfoot bid/pressure).
Per region, it computes BUY% and SELL%, then forms two normalised oscillators in :
Upper Osc = Upper(BUY%) − Upper(SELL%) → positive when overhead offers are being lifted (breakout acceptance), negative when overhead sell pressure dominates (resistance).
Lower Osc = Lower(BUY%) − Lower(SELL%) → positive when sub-price bids strengthen (support/absorption), negative when selling persists beneath price (weak underbelly).
Both oscillators are optionally smoothed with EMA and can be filled to zero or between curves for quick polarity/strength reading.
Candle-fill modes across brokers
The indicator supports multiple candle-fill policies tied to cross-broker volumetric agreement (e.g., spectral/range-only fills when ≥N brokers align above 70% bullish or below 20% bearish Buy%). This makes regime and pressure shifts visually explicit while filtering out unconfirmed noise.
How it works (core algorithm)
Over a lookback window, find the high/low and split the range into N bins .
For each historical bar, approximate “buy” vs “sell” volume using candle direction and the close relative to each bin’s midprice; update left/right profiles per bin.
Aggregate bins above the current price into the Upper region and bins below into the Lower region; compute regional totals and percentages.
Convert to signed oscillators and smooth (EMA length per input).
Scenario engine (table, every bar)
A compact table reports, for Upper/Lower: BUY Vol, SELL Vol, BUY%, SELL%, and Net%. A classifier labels 8 regimes based on oscillator sign and recent expansion/decay: Sync Long/Short (Expanding/Decaying), Opposite Signs (Widening/Converging), and Tilts (Upper/Lower). This helps distinguish trend continuation, fade risk, compression before break, and asymmetric pressure (e.g., “Tilt Lower — bid/support strengthening”).
# Example strategies and annotated cases:
There are different operational strategies:
1) Bottle-neck Strategy with multi-broker confirmation
When both oscillators are red and they compress toward the zero line (a bottle-neck [/i>), if the squeeze does not flip into the opposite trend but instead resolves in the same direction, you have a continuation setup that can be exploited:
• Pattern: both oscillators red → short, visible contraction (narrow, low-variance cluster) → break of the cluster lows → background shadow bars align bearish (multi-broker agreement).
Example:
This sequence often supports a 1.5–2.5 R/R trade, as in:
Bullish mirror
If both oscillators are teal and compress, then expand upward with multi-broker agreement, the scenario becomes bullish after several bars; the position can be profitable with a reasonable risk setup:
Example:
Follow-through:
Here are the additional, English “playbook” examples you can append to the previous description.
2) Dual-confirmation on volume spikes + multi-broker checks
When pronounced volumetric spikes appear (up or down), trend often reverses sharply. In the figure, the circles highlight the spikes; once the spike subsides (reversion toward baseline), the oscillator turns bullish. The double confirmation of two consecutive minimum spikes acts as support for an ensuing up-move, with fill colors confirming direction.
Chart:
Even with a single spike confirmation, the reversion from an extreme often provides actionable long setups.
3) Volume-pressure + regime-change (multi-broker)
A prospective long configuration emerges when bullish volumetric pressure dominates and bearish pressure fades, especially if this occurs after a lateral phase, followed by a bullish volume spike and multi-broker confirmation .
Chart:
Shadow bars subsequently confirm continuation in a bullish regime; however, a possible regime change is flagged by the scenario classifier and by a color flip in the volumetric borders ( “Possible regime change, but without multi-broker confirmation.” is an appropriate label when applicable).
Chart:
After a verified mean-reversion, price transitions into a bearish configuration: both oscillators turn red. One can wait for a pullback and seek short entries.
Chart:
As shown here, the regime change is anticipated well in advance by the oscillators and multi-broker pressure:
Chart:
4) Contrastive regime-shift with multi-broker validation
In a contrastive trading phase, the lower volumetric oscillator flips color first—buyers start attacking. The first set of background shadow bars does not agree with the regime flip; the second set does. This sequence (oscillator flip → later multi-broker agreement) is a robust early sign of a potential long setup.
Chart:
At the multi-broker level, all shadow bars turn fully green and the setup becomes unambiguously bullish.
Chart:
Note that bearish pressure can still be non-trivial on the volumetric scale—even if it does not reach prior extreme minima—so risk controls should reflect the residual supply.
Delta-bar coloring (optional)
Bars (or candle overlays) can be tinted by a multi-venue weighted bias:
Choose venues (OKX, Coinbase, Bybit, Binance, BlackBull…).
Weight by Equal / Last Volume / SMA Volume.
Apply deadband to suppress flicker around neutrality and a gamma curve to modulate opacity with |bias|.
This layer is independent of the spectrogram core but provides immediate market-wide flow context, consistent with the table and fills.
Inputs (essentials)
Calculation Period and Bins — resolution and depth of the price-range histogram.
EMA length — smoothing per oscillator (optional)
Fill options — to zero / between curves, gradual opacity by |osc|, min/max alpha.
Delta Bar — enable tinting, gamma, neutral band; venue list and weighting mode.
Reading guide
Upper > 0 & expanding : overhead supply is being lifted → breakout acceptance risk rises.
Lower > 0 & expanding : sub-price bids strengthen → pullbacks more likely to absorb.
Opposite signs widening : tug-of-war; avoid late entries.
Converging : compression → prepare for break.
Use the table’s regime label to keep the narrative honest bar-by-bar.
Notes & limits
Buy/Sell attribution uses candle direction and range partitioning (no L2/tick tape).
Venue aggregation relies on per-exchange volume and your chosen weighting; symbols must align (e.g., BTCUSDT pairs).
Oscillators are relative to the current price (regional) by design; they complement, not replace, classical volume profile.
— Oberlunar 👁 ★
Volume Heatmap + Buy/Sell splitits the most powerful volume based heatmap you can see on this platform. It tells you when the high volume is coming into the market with clear signs.
Sell - You will see the red bar below the split to confirm its a sell and the strength or the sell you can see above the split line in various colors e.g. lite green (low) to Dark red (extra high).
Buy - If there is a Buying trade being registered, it will appear above the spit line in opaque green with the heatmap colors to show the strength of volume.
This tool will help you identify the volume strength and based on that you can plan your trade.
PS, its always recommended to not to rely on a single oscillator and combine few. I would recommend you to use RSI and S/R lines with this for better decision.
Note, this tool has been put together for educational purposes and I do not take any responsibility of your trade.

ICT HTF Volume Candles (Based on HTF Candles by Fadi)# ICT HTF Volume Candles - Multi-Timeframe Volume Analysis
## Overview
This indicator provides multi-timeframe volume visualization designed to complement price action analysis. It displays volume data from up to 6 higher timeframes simultaneously in a separate panel, allowing traders to identify volume spikes, divergences, and institutional activity without switching between timeframes.
**Original Concept Credits:** This indicator builds upon the HTF Candles framework by Fadi, adapting it specifically for volume analysis with enhanced features including gap-filling for extended hours, multiple scaling methods, and advanced synchronization.
## What Makes This Script Original
### Key Innovations:
1. **Three Volume Scaling Methods:**
- **Per-HTF Auto Scale:** Each timeframe scales independently for detailed comparison
- **Global Auto Scale:** All timeframes use unified scale for relative volume comparison
- **Manual Scale:** User-defined maximum for consistent analysis across sessions
2. **Bullish/Bearish Volume Differentiation:**
- Volume bars colored based on price movement (close vs open)
- Separate styling for bullish (green) and bearish (red) volume periods
- Helps identify whether volume supports price direction
3. **Advanced Time Synchronization:**
- Custom daily candle open times (Midnight, 8:30 AM, 9:30 AM ET)
- Timezone-aware calculations for New York trading hours
- Real-time countdown timers for each timeframe
- **Gap-filling technology** for continuous display during extended hours and weekends
4. **Flexible Display Options:**
- Configurable spacing and positioning
- Label placement (top, bottom, or both)
- Day-of-week or time interval labels on candles
- Works reliably in backtesting and live trading
## How It Works
### Volume Calculation
The indicator uses `request.security()` with optimized parameters to fetch volume data from higher timeframes:
- **Volume Open/High/Low/Close (OHLC):** Tracks volume changes within each HTF candle
- **Color Logic:** Compares HTF close vs open prices to determine bullish/bearish classification
- **Alignment:** All volume bars share a common baseline for easy visual comparison
- **Gap Handling:** Uses `gaps=barmerge.gaps_off` to maintain continuity during non-trading hours
### Technical Implementation
```
1. Monitors HTF timeframe changes using request.security() with lookahead
2. Creates new VolumeCandle object when HTF bar opens
3. Updates current candle's volume H/L/C on each chart bar
4. Applies selected scaling method to normalize display height
5. Repositions all candles and labels on each bar update
6. Fills gaps automatically during extended hours for consistent display
```
### Scaling Methods Explained
**Method 1 - Auto Scale per HTF:**
Each timeframe displays volume relative to its own maximum. Best for identifying patterns within each individual timeframe.
**Method 2 - Global Auto Scale:**
All timeframes share the same scale based on the highest volume across all HTFs. Best for comparing relative volume strength between timeframes.
**Method 3 - Manual Scale:**
User sets maximum volume value. Best for maintaining consistent scale across different trading sessions or instruments.
## How to Use This Indicator
### Setup
1. Add indicator to your chart (it appears in a separate panel below price)
2. Configure up to 6 higher timeframes (default: 5m, 15m, 1H, 4H, 1D, 1W)
3. Set number of candles to display for each timeframe
4. Choose volume scaling method based on your analysis needs
5. Enable "Fix gaps in non-trading hours" for extended hours trading (enabled by default)
### Interpretation
**Volume Spikes:**
- Sudden increase in volume height indicates institutional activity or strong conviction
- Compare volume between timeframes to identify where the real money is moving
- Look for volume spikes that appear across multiple timeframes simultaneously
**Bullish vs Bearish Volume:**
- **Green volume bars:** Price closed higher (buying pressure)
- **Red volume bars:** Price closed lower (selling pressure)
- High green volume during uptrend = confirmation of strength
- High red volume during downtrend = confirmation of weakness
- High volume opposite to trend = potential reversal warning
**Multi-Timeframe Context:**
- **5m/15m:** Scalping and day trading activity
- **1H/4H:** Swing trading and intraday institutional flows
- **Daily/Weekly:** Major position building and long-term trends
**Divergences:**
- Price making new highs but volume declining = weakening trend
- Volume increasing while price consolidates = potential breakout brewing
- Price breaks level but volume doesn't confirm = likely false breakout
### Practical Examples
**Example 1 - Institutional Confirmation:**
Price breaks above resistance. Check volume across timeframes:
- 5m shows spike = retail interest
- 15m + 1H + 4H all show spikes = institutional confirmation
- **Trade confidence: HIGH**
**Example 2 - False Breakout Detection:**
Price breaks resistance with:
- High volume on 5m only
- Normal/low volume on 1H and 4H
- **Interpretation:** Likely retail trap, institutions not participating
- **Action:** Wait for pullback or avoid
**Example 3 - Accumulation Phase:**
Price ranges sideways but:
- Daily volume gradually increasing
- Weekly volume above average
- **Interpretation:** Smart money accumulating
- **Action:** Prepare for breakout in direction of volume
**Example 4 - Volume Divergence:**
Price makes new high:
- Current high has lower volume than previous high across all timeframes
- **Interpretation:** Weakening momentum
- **Action:** Consider profit-taking or reversal trade
## Configuration Parameters
### Timeframe Settings
- **HTF 1-6:** Select timeframes (must be higher than chart timeframe)
- **Max Display:** Number of candles to show per timeframe (1-50)
- **Limit to Next HTFs:** Display only first N enabled timeframes (1-6)
### Styling
- **Bull/Bear Colors:** Separate colors for body, border, and wick
- **Padding from current candles:** Distance offset from live price action
- **Space between candles:** Gap between individual volume bars
- **Space between Higher Timeframes:** Gap between different timeframe groups
- **Candle Width:** Thickness of volume bars (1-4, multiplied by 2)
### Volume Settings
- **Volume Scale Method:** Choose 1, 2, or 3
- 1 = Auto Scale per HTF (each TF independent)
- 2 = Global Auto Scale (all TF unified)
- 3 = Manual Scale (user-defined max)
- **Auto Scale Volume:** Enable/disable automatic scaling
- **Manual Scale Max Volume:** Set maximum when using Method 3
### Label Settings
- **HTF Label:** Show/hide timeframe names with color and size options
- **Label Positions:** Display at Top, Bottom, or Both
- **Label Alignment:** Align centered or Follow Candles
- **Remaining Time:** Show countdown timer until next HTF candle
- **Interval Value:** Display day-of-week or time on each candle
### Custom Daily Candle
- **Enable Custom Daily:** Override default daily candle timing
- **Open Time Options:**
- **Midnight:** Standard 00:00 ET daily open
- **8:30 AM:** Align with economic data releases
- **9:30 AM:** Align with NYSE market open
- Useful for specific trading strategies or market alignment
### Advanced Settings
- **Fix gaps in non-trading hours:** Maintains alignment during extended hours and weekends (recommended: ON)
- Prevents visual gaps during forex weekend closures
- Ensures consistent display during crypto 24/7 trading
- Improves backtesting reliability
## Best Practices
1. **Pair with Price Action:** Use alongside HTF price candles indicator for complete picture
2. **Start Simple:** Enable 2-3 timeframes initially (e.g., 15m, 1H, 4H), add more as needed
3. **Match Settings:** Use same candle width/spacing as companion price indicator for visual alignment
4. **Scale Appropriately:**
- Use **Global scale** (Method 2) when comparing timeframes
- Use **Per-HTF scale** (Method 1) for pattern analysis within each timeframe
- Use **Manual scale** (Method 3) for consistent day-to-day comparison
5. **Watch for Volume Clusters:** High volume appearing simultaneously across multiple HTFs signals significant market events
6. **Confirm Breakouts:** Always check if volume supports the price movement across higher timeframes
7. **Extended Hours:** Keep "Fix gaps" enabled for 24/7 markets (Forex, Crypto) and weekend analysis
## Technical Notes
- **Timezone:** All calculations use America/New_York timezone for consistency
- **Real-time Updates:** Volume and timers update on each tick during market hours
- **Performance:** Optimized with max_bars_back=5000 for extensive historical analysis
- **Compatibility:** Works on all instruments with volume data (Stocks, Forex, Crypto, Futures)
- **Gap Handling:** Uses `barmerge.gaps_off` to fill data gaps during non-trading periods
- **Backtesting:** Uses `lookahead=barmerge.lookahead_on` for stable historical data without repainting
- **Data Continuity:** Automatically handles market closures, weekends, and extended hours
## Updates & Improvements
**Version 2.0 (Current):**
- ✅ Fixed alignment issues during extended hours and weekends
- ✅ Eliminated repainting in backtesting
- ✅ Added gap-filling technology for continuous display
- ✅ Improved data synchronization across all timeframes
- ✅ Enhanced NA value handling for data integrity
- ✅ Added advanced settings group for user control
## Support
For questions, suggestions, or feedback, please comment on the publication or message the author.
---
**Disclaimer:** This indicator is for educational and informational purposes only. It does not constitute financial advice. Past performance is not indicative of future results. Always perform your own analysis and implement proper risk management before making trading decisions.

Volume Delta [BigBeluga]🔵 OVERVIEW
The Volume Delta indicator visualizes the dominance between buying and selling volume within a given period. It calculates the percentage of bullish (buy) versus bearish (sell) volume, then color-codes the candles and provides a real-time dashboard comparing delta values across multiple currency pairs. This makes it a powerful tool for monitoring order-flow strength and intermarket relationships in real time.
🔵 CONCEPTS
Each bar’s buy volume is counted when the close is higher than the open.
Each bar’s sell volume is counted when the close is lower than the open.
volumeBuy = 0.
volumeSell = 0.
for i = 0 to period
if close > open
volumeBuy += volume
else
volumeSell += volume
The indicator sums both over a chosen period to calculate the ratio of buy-to-sell pressure.
Delta (%) = (Buy Volume ÷ (Buy Volume + Sell Volume)) × 100.
Gradient colors highlight whether buying or selling pressure dominates.
🔵 FEATURES
Calculates real-time Volume Delta for the selected chart or for multiple assets.
Colors candles dynamically based on the delta intensity (green = buy pressure, red = sell pressure).
Displays a dashboard table showing volume delta % for up to five instruments.
The dashboard features visual progress bars for quick intermarket comparison.
An optional Delta Bar Panel shows the ratio of Buy/Sell volumes near the latest bar.
A floating label shows the exact Buy/Sell percentages.
Works across all symbols and timeframes for multi-asset delta tracking.
🔵 HOW TO USE
When Buy % > Sell % , it often signals bullish momentum or strong accumulation—but can also indicate over-excitement and a possible market top.
Market Tops
When Sell % > Buy % , it typically reflects bearish pressure or distribution—but may also occur near a market bottom where selling exhaustion forms.
Market Bottom
Use the Dashboard to compare volume flow across correlated assets (e.g., major Forex pairs or sector groups).
Combine readings with trend or volatility filters to confirm whether the imbalance aligns with broader directional conviction.
Treat the Delta Bar visualization as a real-time sentiment gauge—showing which side (buyers or sellers) dominates the current session.
🔵 CONCLUSION
Volume Delta transforms volume analysis into an intuitive directional signal.
By quantifying buy/sell pressure and displaying it as a percentage or color gradient, it provides traders with a clearer picture of real-time volume imbalance — whether within one market or across multiple correlated instruments.

Trading Activity Index (Zeiierman)█ Overview
Trading Activity Index (Zeiierman) is a volume-based market activity meter that transforms dollar-volume into a smooth, normalized “activity index.”
It highlights when market participation is unusually low or high with a dynamic color gradient:
Light Blue → Low Activity (thin participation, low liquidity conditions)
Red/Orange → High Activity (active markets, large trades flowing in)
Additional percentile bands (20/40/60/80%) give context, helping you see whether the current activity level is in the bottom quintile, mid-range, or near historical extremes.
█ How It Works
⚪ Dollar Volume Transformation
Each bar, dollar volume is computed:
float dlrVol = close * volume
float dlrVolAvg = ta.sma(dlrVol, len_form)
Dollar volume = price × volume, smoothed by a configurable SMA window.
The result is log-transformed, compressing large outliers for a more stable signal.
⚪ Rolling Percentiles & Ranking
The log-dollar-volume series is compared to its rolling history (len_hist bars):
float p20 = ta.percentile_linear_interpolation(vscale, len_hist, 20)
float p40 = ta.percentile_linear_interpolation(vscale, len_hist, 40)
float p60 = ta.percentile_linear_interpolation(vscale, len_hist, 60)
float p80 = ta.percentile_linear_interpolation(vscale, len_hist, 80)
A normalized rank (0–1) is produced to color the main Trading Activity line.
█ How to Use
⚪ Detect High-Impact Sessions
Quickly see if today’s session is active or quiet relative to its own history — great for filtering setups that need activity.
⚪ Spot Breakouts & Traps
Combine with price action:
High activity near breakouts = strong follow-through likely.
Low activity breakouts = vulnerable to fake-outs.
⚪ Market Regime Context
Percentile bands help you assess whether participation is building up, in the middle of the range, or drying out — valuable for timing mean-reversion trades.
Above 80th percentile (red/orange) → Market is highly active, breakout trades and trend strategies are favored.
Below 20th percentile (light blue) → Market is quiet; fade moves or wait for expansion.
Watch transitions from blue → orange as a signal of growing institutional participation.
█ Settings
Formation Window (bars) – Number of bars used to average dollar volume before log transform.
History Window (bars) – Lookback period for percentile calculations and rank normalization.
-----------------
Disclaimer
The content provided in my scripts, indicators, ideas, algorithms, and systems is for educational and informational purposes only. It does not constitute financial advice, investment recommendations, or a solicitation to buy or sell any financial instruments. I will not accept liability for any loss or damage, including without limitation any loss of profit, which may arise directly or indirectly from the use of or reliance on such information.
All investments involve risk, and the past performance of a security, industry, sector, market, financial product, trading strategy, backtest, or individual's trading does not guarantee future results or returns. Investors are fully responsible for any investment decisions they make. Such decisions should be based solely on an evaluation of their financial circumstances, investment objectives, risk tolerance, and liquidity needs.

Custom Buy/Sell Pattern BuilderAre you tired of using trading indicators that only let you follow fixed, pre-designed rules? Do you wish you could build your own “Buy” or “Sell” signals, experiment with your own ideas, or see instantly if your unique pattern works—without learning coding or hiring a developer?
The Custom Buy/Sell Pattern Builder is designed for YOU.
This TradingView indicator lets ANY trader—even a complete beginner—define exactly what kind of price and volume conditions should create a BUY or SELL label on any chart, in any market, at any timeframe.
You don’t need to know programming. You don’t need to know the definition of a hammer, doji, volume spike, or Engulfing pattern.
With a few clicks and easy dropdown choices, you can:
Make your own rules for buying or selling
Choose how many candles your pattern should look at
Decide if you want the biggest body, the lowest volume, the biggest movement, or any combination you can imagine
The result?
You’ll see clear “BUY” or “SELL” labels automatically show up on your chart whenever the exact rule YOU built matches current price action.
No more guessing. No more forced strategies. Just pure control and visual feedback!
Why Is This Powerful?
Traditional indicators (like MACD, RSI, or even classic candlestick scanners) work the same for everyone—and only as their inventors defined.
But every trader, and every market, is unique.
What if you could say:
“Show me a ‘SELL’ every time the newest candle is bigger than the one before, but with LESS volume, while the bar before that had an even smaller body—but more volume than all others?”
With this tool, it’s EASY!
You simply pick which candle you want to compare (most recent, previous, etc), what to compare (body or volume—body means the candle’s “thickness”, from open to close), choose “greater than”, “less than”, or “equal to”, and set a multiplier if you want (like “half as much”, “twice as big”, etc).
After this, if any bar on the chart fits all your rules, it will mark it as a BUY or SELL, depending on your selection.
This means—
Beginners can start experimenting with their intuition or small ideas, without tech hurdles
Experienced traders can visualize and fine-tune any possible logic, before they commit to backtesting or automating a real strategy
Every “what if” or “I wonder” setup is just 2–3 clicks away
How Does It Work? Simple Steps
1. Choose Your Signal Type
“Buy” or “Sell”
This tells the indicator whether to mark the qualifying bars with a green “BUY” or red “SELL” label
2. Pick How Many Candles To Use
“Pattern Candle Count” input (2, 3, or 4)
Example: If you use 4, the pattern will be applied to the most recent 4 candles at every step
3. Define Your Pattern With Inputs
For each candle (from newest “0” to oldest “3”), you can set:
Body Condition (example: “is this candle’s body bigger/smaller/equal to another?”)
Pick which candle to compare against
Pick “>”, “<”, “>=”, “<=”, or “=”
Set a multiplier if needed (like “0.5” to mean “half as big as” or “2” for “twice as big as”)
Volume Condition (exact same choices, but based on trading volume—not the candle’s price body)
For example:
“Candle0 Body > Candle2 Body”
means “the latest candle’s real-body (open–close) is bigger than the one two bars ago.”
“Candle1 Volume <= Candle2 Volume”
means “the previous candle’s volume is less than or equal to the volume of the bar two periods ago.”
You can leave a comparison blank if you don’t want to use it for a particular candle.
What Happens After You Set Your Rules?
Every bar on your chart is checked for your logic:
If ALL body AND volume conditions are true (for each candle you specified),
AND
The signal side (“Buy” or “Sell”) matches your dropdown,
Then a green “BUY” or red “SELL” label will show right on the bar, so you can visually spot exactly where your logic works!
Practical Example:
Suppose you want an entry setup that is:
“Sell whenever the newest candle’s body is bigger than two bars ago, body before that is bigger than three bars ago, AND the newest candle’s volume is less than or equal to two bars ago, AND the candle three bars ago’s volume is less than or equal to half the candle two bars ago’s volume.”
You’d set:
Pattern Candle Count: 4
Side: Sell
Candle0 Body Ref#: 2, Op: >, Mult: 1
Candle1 Body Ref#: 3, Op: >, Mult: 1
Candle0 Vol Ref#: 2, Op: <=, Mult: 1
Candle3 Vol Ref#: 2, Op: <=, Mult: 0.5
And the script will find all “SELL” bars on your chart matching these conditions.
Inputs Section: What Does Each Setting Do?
Let’s break down each input in the indicator’s Settings one by one, so even if you’re new, you’ll understand exactly how to use it!
1. Pattern Candle Count (2–4)
What is it?
This sets how many candles in a row you want your rule to look at.
Example:
“4” means your rules are based on the most recent candle and the 3 before it.
“2” means you are only comparing the current and previous candles.
Tip:
Beginners often use 4 to spot stronger patterns, but you can experiment!
2. Signal Side
What is it?
Choose “Buy” or “Sell”. The word you pick here decides which colored label (green for Buy, red for Sell) appears if your pattern matches.
Example:
Want to spot where “Sell” is likely? Pick “Sell”.
Change to “Buy” if you want bullish signals instead.
3. Body & Volume Comparison Settings (per Candle)
For each candle (#0 is newest/current, #3 is oldest in your pattern window):
Body Comparison
Candle# Body Ref#
Choose which other candle you want to compare this one’s body to.
“0” = newest, “1” = previous, “2” = two bars ago, “3” = three bars ago
Candle# Body Op (Operator; >, <, >=, <=, =)
How do you want to compare?
“>” means “greater than” (is bigger than)
“<” means “less than” (is smaller than)
“=” means “equal to”
Candle# Body Mult (Multiplier)
If you want relative comparisons. For example, with Mult=1:
“Candle0 body > Candle2 body x 1” means just “0 is larger than 2.”
“Candle0 body > Candle2 body x 2” means “0 is more than double 2.”
Volume Comparison
Candle# Vol Ref# / Op / Mult
Exact same logic as body, but works on the “Volume” of each candle (how much was traded during that bar).
How to Set Up a Rule (Step by Step Example)
Say you want to mark a Sell every time:
The most recent candle’s real body is BIGGER than the candle 2 bars ago;
The previous candle’s body is also BIGGER than the candle 3 bars ago;
The current candle’s volume is LESS than or equal to the volume of candle 2;
The previous candle’s volume is LESS than or equal to candle 2’s volume;
The candle 3 bars ago’s volume is LESS than or equal to HALF candle 2’s volume.
You’d set:
Pattern Candle Count: 4
Side: "Sell"
Candle0 Body Ref#: 2, Op: “>”, Mult: 1
Candle1 Body Ref#: 3, Op: “>”, Mult: 1
Candle0 Vol Ref#: 2, Op: “<=”, Mult: 1
Candle1 Vol Ref#: 2, Op: “<=”, Mult: 1
Candle3 Vol Ref#: 2, Op: “<=”, Mult: 0.5
All other comparisons (operators) can be left blank if you don’t want to use them!
When these rules are met, a bright red “SELL” label will appear right above the bar matching all your conditions.
Practical Tips & FAQ for Beginners
What does “body” mean?
It’s the “true range” of the candle: the difference between open and close. This ignores wicks for simple setups.
What does “volume” mean?
This is the total trading activity during that candle/bar. Many traders believe that patterns with different volume “meaning” (such as low-volume up bars, or high-volume down bars) signal a meaningful change.
What if nothing shows on chart?
It just means your current rules are rarely or never matched! Try making your comparisons simpler (maybe just 2-body and 2-volume conditions to start).
You can always hit “Reset Settings” to go back to default.
Can I use this for both buying and selling?
YES! You can detect both bullish (Buy) and bearish (Sell) custom conditions; just switch “Signal Side.”
Do I need to know coding?
Not at all! Everything is in simple input panels.
Creative Use Cases, Example Recipes & Troubleshooting
Creative Ways to Use
Spotting Reversals
Example:
Buy when: the newest candle body is LARGER than the previous 3 bars, but ALL volumes are lower than their neighbors.
Why? Sometimes, a big candle with surprisingly low volume after a sequence of small bars can signal a reversal.
Finding Exhaustion Moves
Example:
Sell when: the current bar body is twice as big as two bars ago, but volume is half.
Why? A very big candle with very little volume compared to similar bars may show the move is “running out of steam.”
Custom “Breakout + Confirmation” Patterns
Example:
Buy when:
Candle 0’s body is greater than Candle 2’s by at least 1.5x,
Candle 0’s volume is greater than Candle 1 and Candle 2,
Candle 1’s volume is less than Candle 0.
Why? This could catch strong breakouts but filter out noisy moves.
Multi-bar Bias/Squeeze Filter
Use “Pattern Candle Count: 4”
Set all 4 volume conditions to “<” and each reference to the previous candle.
Now, a BUY or SELL only marks when each bar is “dryer”/less active than the last — a classic squeeze or low-volatility buildup.
Troubleshooting Guide
“I don’t see any Buy/Sell label; is something broken?”
Most likely, your rules are too strict or rare! Try using only two comparisons and leave other “Op” inputs blank as a test.
Double-check you have enough candles on the chart: you need at least as many bars as your pattern count.
“Why does a label appear but not where I expect?”
Remember, the script checks your rules for every NEW candle. The candle “0” is always the most recent, then “1” is one bar back, etc.
Check the color and type chosen: “Signal Side” must be “Buy” for green, “Sell” for red.
“What if I want a more complex pattern?”
Stack conditions! You can demand the body/volume of each candle in your window meet a different rule or all follow the same rule in sequence.
Mini Glossary — For Newcomers
Candle/Bar: Each bar on the chart, shows price movement during a fixed time (e.g., one minute, one hour, one day).
Body: The colored (or filled) part of the candle — the open-to-close price range.
Volume: How much of the asset was actually traded that candle/bar.
Reference Index: When you pick “2” as a reference, it means “the candle two bars ago in the pattern window.”
Operator (“Op”): The math symbol used to compare (>, <, =, etc).
Signal Side: Whether you want to highlight bullish (“Buy”) or bearish (“Sell”) bars.
Tips for Getting More Value
Start Simple—try just one or two conditions at first. See what lights up. Slowly add more logic as you get comfortable.
Watch the chart live as you change settings. The labels update instantly—this makes strategy design fast and visual!
Try flipping your ideas: If a certain pattern doesn’t work for buys, try reversing the direction for possible “sell” setups.
Remember: There is NO wrong idea. This indicator is only limited by your creativity—it’s a “strategy playground.”
Example Quick-Start Recipes
Classic Sell:
4 candles, side = Sell
Candle0 Body > Candle2; Candle1 Body > Candle3
Candle0 Vol <= Candle2; Candle1 Vol <= Candle2; Candle3 Vol <= Candle2 × 0.5
Simple Buy After Pause:
3 candles, side = Buy
Candle0 Body > Candle1; Candle0 Vol > Candle1
All other Ops blank
Low-Volume Pullback for Entry:
4 candles, side = Buy
Candle0 Body > Candle2
Candle0 Vol < Candle1; Candle1 Vol < Candle2; Candle2 Vol < Candle3
Final Words
Think of this as your “pattern lab.” No code, no guesswork—just experiment, see what the market actually gives, and design your own visual rulebook.
If you’re stuck, reset the script to defaults—it’s always safe to start again!
If you want more ready-made “recipes” for different strategies/styles, just ask and I’ll send some more setups for you.
Happy building—and may your edge always be YOUR edge!

Svl - Trading SystemPrice can tell lies but volume cannot, so keeping this in mind I have created this indicator in which you see sell order block and buy order block on the basis of price action + volume through which we execute our trade
First of all, let us know its core concepts and logic, which will help you in taking the right decisions in it.
core concept of the " Svl - Trading System " TradingView indicator is based on professional price action, volume, and swing structure. This indicator smartly gives real-time insights of important price turning points, reversal zones, and trend continuation. Its deep explanation is given below.
Edit - default swing length -5 , change according your nature , tested With 7 For 5 minute timeframe
Core Concept:
1. Swing Structure Detection
The indicator automatically detects swing highs (HH/LH) and swing lows (HL/LL) on the chart.
HH: Higher High
HL: Higher Low
LH: Lower High
LL: Lower Low
These swings are the backbone of price action – signaling a change in trend, a bounce, reversal or trend continuation.
2. Order Block (OB) Mapping
Buy Order Block (Buy OB): When the indicator detects the HL/LL swing, we declare Buy OB, the lowest point of the swing.
Sell Order Block (Sell OB): On HH/LH swing, the highest point of our swing is called Sell OB.
Order Blocks are those important zones of price where historically price has reacted strongly – where major clusters of buyers/sellers are located in the market.
3. Volume Analysis (Optional Dashboard/Barcolor)
The candle color depends on the volume ranking on the chart (most high/low, normal, pressure blue shade).
Highest/lowest volume candles are a special highlight, which helps to spot liquidity spikes, exhaustion, or big orders.
4. Live Dashboard
There is an automated dashboard in the top-right of the chart, which shows this in real-time:
Last swing type (HH/HL/LH/LL)
Reversal price (last swing level)
Swing direction (Bull/Bear/Neutral)
Volume, Buy OB, Sell OB, etc.
This helps the trader understand the market situation at a glance.
5. Smart Plotting/Labels
Buy/Sell are plotted as distinct lines on the OB chart.
The Labels option gives clear visual swing points.
All calculations are fast and automated – the user does not need to mark manually.
This indicator is an advanced, fully-automated price action tool that combines
trend, reversal, volume, liquidity and zone detection in one smart system,
makes entry/exit decisions objective and error-free,
and provides complete trading confidence with a live monitor/dashboard.
All of its functions/properties such as: swing detect, OB plot, volume color, dashboard follow best practice for professional chart analysis!

ATAI Volume Pressure Analyzer V 1.0 — Pure Up/DownATAI Volume Pressure Analyzer V 1.0 — Pure Up/Down
Overview
Volume is a foundational tool for understanding the supply–demand balance. Classic charts show only total volume and don’t tell us what portion came from buying (Up) versus selling (Down). The ATAI Volume Pressure Analyzer fills that gap. Built on Pine Script v6, it scans a lower timeframe to estimate Up/Down volume for each host‑timeframe candle, and presents “volume pressure” in a compact HUD table that’s comparable across symbols and timeframes.
1) Architecture & Global Settings
Global Period (P, bars)
A single global input P defines the computation window. All measures—host‑TF volume moving averages and the half‑window segment sums—use this length. Default: 55.
Timeframe Handling
The core of the indicator is estimating Up/Down volume using lower‑timeframe data. You can set a custom lower timeframe, or rely on auto‑selection:
◉ Second charts → 1S
◉ Intraday → 1 minute
◉ Daily → 5 minutes
◉ Otherwise → 60 minutes
Lower TFs give more precise estimates but shorter history; higher TFs approximate buy/sell splits but provide longer history. As a rule of thumb, scan thin symbols at 5–15m, and liquid symbols at 1m.
2) Up/Down Volume & Derived Series
The script uses TradingView’s library function tvta.requestUpAndDownVolume(lowerTf) to obtain three values:
◉ Up volume (buyers)
◉ Down volume (sellers)
◉ Delta (Up − Down)
From these we define:
◉ TF_buy = |Up volume|
◉ TF_sell = |Down volume|
◉ TF_tot = TF_buy + TF_sell
◉ TF_delta = TF_buy − TF_sell
A positive TF_delta indicates buyer dominance; a negative value indicates selling pressure. To smooth noise, simple moving averages of TF_buy and TF_sell are computed over P and used as baselines.
3) Key Performance Indicators (KPIs)
Half‑window segmentation
To track momentum shifts, the P‑bar window is split in half:
◉ C→B: the older half
◉ B→A: the newer half (toward the current bar)
For each half, the script sums buy, sell, and delta. Comparing the two halves reveals strengthening/weakening pressure. Example: if AtoB_delta < CtoB_delta, recent buying pressure has faded.
[ 4) HUD (Table) Display /i]
Colors & Appearance
Two main color inputs define the theme: a primary color and a negative color (used when Δ is negative). The panel background uses a translucent version of the primary color; borders use the solid primary color. Text defaults to the primary color and flips to the negative color when a block’s Δ is negative.
Layout
The HUD is a 4×5 table updated on the last bar of each candle:
◉ Row 1 (Meta): indicator name, P length, lower TF, host TF
◉ Row 2 (Host TF): current ↑Buy, ↓Sell, ΔDelta; plus Σ total and SMA(↑/↓)
◉ Row 3 (Segments): C→B and B→A blocks with ↑/↓/Δ
◉ Rows 4–5: reserved for advanced modules (Wings, α/β, OB/OS, Top
5) Advanced Modules
5.1 Wings
“Wings” visualize volume‑driven movement over C→B (left wing) and B→A (right wing) with top/bottom lines and a filled band. Slopes are ATR‑per‑bar normalized for cross‑symbol/TF comparability and converted to angles (degrees). Coloring mirrors HUD sign logic with a near‑zero threshold (default ~3°):
◉ Both lines rising → blue (bullish)
◉ Both falling → red (bearish)
◉ Mixed/near‑zero → gray
Left wing reflects the origin of the recent move; right wing reflects the current state.
5.2 α / β at Point B
We compute the oriented angle between the two wings at the midpoint B:
β is the bottom‑arc angle; α = 360° − β is the top‑arc angle.
◉ Large α (>180°) or small β (<180°) flags meaningful imbalance.
◉ Intuition: large α suggests potential selling pressure; small β implies fragile support. HUD cells highlight these conditions.
5.3 OB/OS Spike
OverBought/OverSold (OB/OS) labels appear when directional volume spikes align with a 7‑oscillator vote (RSI, Stoch, %R, CCI, MFI, DeMarker, StochRSI).
◉ OB label (red): unusually high sell volume + enough OB votes
◉ OS label (teal): unusually high buy volume + enough OS votes
Minimum votes and sync window are user‑configurable; dotted connectors can link labels to the candle wick.
5.4 Top3 Volume Peaks
Within the P window the script ranks the top three BUY peaks (B1–B3) and top three SELL peaks (S1–S3).
◉ B1 and S1 are drawn as horizontal resistance (at B1 High) and support (at S1 Low) zones with adjustable thickness (ticks/percent/ATR).
◉ The HUD dedicates six cells to show ↑/↓/Δ for each rank, and prints the exact High (B1) and Low (S1) inline in their cells.
6) Reading the HUD — A Quick Checklist
◉ Meta: Confirm P and both timeframes (host & lower).
◉ Host TF block: Compare current ↑/↓/Δ against their SMAs.
◉ Segments: Contrast C→B vs B→A deltas to gauge momentum change.
◉ Wings: Right‑wing color/angle = now; left wing = recent origin.
◉ α / β: Look for α > 180° or β < 180° as imbalance cues.
◉ OB/OS: Note labels, color (red/teal), and the vote count.
◉Top3: Keep B1 (resistance) and S1 (support) on your radar.
Use these together to sketch scenarios and invalidation levels; never rely on a single signal in isolation.
[ 7) Example Highlights (What the table conveys) /i]
◉ Row 1 shows the indicator name, the analysis length P (default 55), and both TFs used for computation and display.
◉ B1 / S1 blocks summarize each side’s peak within the window, with Δ indicating buyer/seller dominance at that peak and inline price (B1 High / S1 Low) for actionable levels.
◉ Angle cells for each wing report the top/bottom line angles vs. the horizontal, reflecting the directional posture.
◉ Ranks B2/B3 and S2/S3 extend context beyond the top peak on each side.
◉ α / β cells quantify the orientation gap at B; changes reflect shifting buyer/seller influence on trend strength.
Together these visuals often reveal whether the “wings” resemble a strong, upward‑tilted arm supported by buyer volume—but always corroborate with your broader toolkit
8) Practical Tips & Tuning
◉ Choose P by market structure. For daily charts, 34–89 bars often works well.
◉ Lower TF choice: Thin symbols → 5–15m; liquid symbols → 1m.
◉ Near‑zero angle: In noisy markets, consider 5–7° instead of 3°.
◉ OB/OS votes: Daily charts often work with 3–4 votes; lower TFs may prefer 4–5.
◉ Zone thickness: Tie B1/S1 zone thickness to ATR so it scales with volatility.
◉ Colors: Feel free to theme the primary/negative colors; keep Δ<0 mapped to the negative color for readability.
Combine with price action: Use this indicator alongside structure, trendlines, and other tools for stronger decisions.
Technical Notes
Pine Script v6.
◉ Up/Down split via TradingView/ta library call requestUpAndDownVolume(lowerTf).
◉ HUD‑first design; drawings for Wings/αβ/OBOS/Top3 align with the same sign/threshold logic used in the table.
Disclaimer: This indicator is provided solely for educational and analytical purposes. It does not constitute financial advice, nor is it a recommendation to buy or sell any security. Always conduct your own research and use multiple tools before making trading decisions.

Volume Pressure Analysis - Live DataVolume Pressure Gauge and Volume Percentage Indicator – Pine Script Guide
This indicator provides a simplified, real-time visualization of both volume pressure (buy vs. sell activity) and today’s trading volume in comparison to historical averages. It is designed to help traders assess whether buyers or sellers dominate the current session and whether today’s volume is significant relative to recent behaviour.
________________________________________
Key Functional Segments
1. Inputs and Configuration
Users can configure the length of the Simple Moving Average (SMA) used to calculate average volume, set the position of the gauge table on the chart, and toggle the visibility of the volume pressure display. This allows flexibility in integrating the tool with various trading styles and chart layouts.
2. Volume Data Calculations
The indicator calculates three key volume metrics:
• volToday: The current day’s volume.
• volAvg: The average volume over the user-defined SMA period (default is 20 bars).
• volPct: The current volume as a percentage of the average.
This enables traders to quickly recognize whether current trading activity is above or below normal, which can be a precursor to potential trend strength or weakness.
3. Volume Pressure Calculation
The script estimates buying and selling pressure based on price movement and volume. It distributes volume into upward (buy) and downward (sell) segments and expresses them as percentages of the total volume. This gives an immediate sense of whether bulls or bears are more active in the current session.
4. Visual Representation (Progress Bars)
The indicator renders a simplified visual gauge using horizontal bar segments (pseudo-bars) to reflect the proportion of buy and sell pressure. The length of each bar correlates with the strength of pressure from buyers or sellers, helping users assess dominance without analyzing candlestick behavior in depth.
5. Table Display
A compact table is drawn on the chart showing:
• Buy pressure percentage and corresponding bar.
• Sell pressure percentage and corresponding bar.
• Volume percentage compared to the recent average.
This format makes it easy to evaluate volume dynamics at a glance, without cluttering the price chart or relying on separate overlays.
________________________________________
How Traders Benefit from This Indicator
• Momentum Shift Detection: Early signs of trend reversal can be observed when volume pressure flips direction.
• Breakout Validation: High volume combined with dominant pressure supports the credibility of breakout moves.
• False Move Avoidance: If price moves on low volume or mixed pressure, traders can avoid low-probability entries.
• Market Context Awareness: Users can assess whether a day is behaving normally in terms of participation or is unusually quiet or aggressive.
________________________________________
Basic Usage Guide
1. Add the script to your TradingView chart and set your preferred SMA length for volume comparison.
2. Customize the table’s position using the X and Y settings for clarity and alignment.
3. Interpret the outputs:
o A higher red bar indicates dominant sell pressure.
o A higher green bar indicates dominant buy pressure.
o Volume % above 100% suggests above-average activity, while values below 100% may imply low conviction.
4. Apply to trading decisions:
o High buy pressure and high volume may indicate a strong long opportunity.
o High sell pressure and high volume may support short setups.
o Low volume or conflicting signals may call for caution.
5. Combine with other tools such as trend indicators, support/resistance zones, or price action patterns for more reliable trade setups.
________________________________________
Practical Example
• Sell Pressure: 70% → Suggests strong seller control; potential for short setups.
• Buy Pressure: 30% → Weak buying interest; long trades may carry risk.
• Volume Percentage: 120% → Indicates a surge in participation; movement may have greater validity.
________________________________________
Tips for New Traders
• Use this indicator as a confirmation tool rather than a standalone strategy.
• Begin on higher timeframes (4-hour or daily) to develop familiarity.
• Compare multiple examples to identify reliable patterns over time.
• Always incorporate proper risk management, including stop losses.
________________________________________
Disclaimer from aiTrendview
This indicator is intended solely for educational and informational use. It does not constitute investment advice, trade signals, or financial recommendations. aiTrendview and its affiliates are not liable for any trading losses incurred through use of this tool. All trading involves risk. Past performance of any indicator does not guarantee future results. Users should conduct independent research and consult with a certified financial advisor before making any trading decisions.

Volume Spike Alert & Overlay"Volume Spike Alert & Overlay" highlights unusually high trading volume on a chart. It calculates whether the current volume exceeds a user-defined percentage above the historical average and triggers an alert if it does. The information is also displayed in a customizable on-screen table.
What It Does
Monitors volume for each bar and compares it to an average over a user-defined lookback period.
Supports multiple smoothing methods (SMA, EMA, WMA, RMA) for calculating the average volume.
Triggers an alert when current volume exceeds the threshold percentage above the average.
Displays a table on the chart with:
Current Volume
Average Volume
Threshold Percentage
Optional empty row for spacing/formatting
How It Works
User Inputs:
lookbackPeriods: Number of bars used to calculate the average volume.
thresholdPercent: % above the average that triggers a volume spike alert.
smoothingType: Type of moving average used for volume calculation.
textColor, bgColor: Formatting for the display table.
tablePositionInput: Where the table appears on the chart (e.g., Bottom Right).
Toggles for showing/hiding parts of the table.
Volume Calculations:
Calculates current bar's volume.
Calculates average volume using the selected smoothing method.
Computes the threshold: avgVol * (1 + thresholdPercent / 100).
Compares current volume to threshold.
Table Display:
Dynamically creates a table with volume stats.
Adds rows based on user preferences.
Alerts:
alertcondition fires when currentVol crosses above the calculated threshold.
Message: "Volume Threshold Exceeded"
Usage Examples
Example 1: Spotting High Activity
Apply the script to a stock like AAPL on a 5-minute chart.
Set lookbackPeriods to 20 and thresholdPercent to 30.
Use EMA for more reactive volume tracking.
When volume spikes more than 30% above the 20-period EMA, an alert triggers.
Example 2: Day Trading Filter
For scalpers, apply it to a 1-minute crypto chart (e.g., BTC/USDT).
Set thresholdPercent to 50 to catch only strong surges.
Position the table at the top left and reduce visible info for a clean layout.
Example 3: Long-Term Context
On a daily chart, use SMA and set lookbackPeriods to 50.
Helps identify breakout moves supported by strong volume.
How this is different from Trading View's Volume indicator:
The standard volume plot from trading view allows users to set a alert when the average line is crossed, but it does not allow you to set a custom percentage at which to trigger an alert. This indicator will allow you to set any percentage you wish to monitor and above that percentage threshold will trigger your alert.
===== ORIGINAL DESCRIPTION =====
Volume Spike Alert & Overlay
This indicator will display the following as an overlay on your chart:
Current volume
Average Volume
Threshold for Alert
Description:
This indicator will display the current bar volume based on the chart time frame,
display the average volume based on selected conditions,
allow user selectable threshold over the average volume to trigger an alert.
Options:
Average lookback period
Smoothing type
Alert Threshold %
Enable / Disable Each Value
Change Text Color
Change Background Color
Change Table location
Add/Remove extra row for placement in top corner
Usage Example:
I use this indicator to alert when the current volume exceeds the average volume by a specified percentage to alert to volume spikes.
Set the threshold to 25% in the settings
Create an alert by clicking on the 3 dots on the right of the indicator title on the chart
When the threshold is exceeded the alert will trigger

Project SynthIntroducing Project Synth !
Inspired by Pace of Tape and Cumulative Delta I created Project Synth in order to aggregate volume flow data across multiple marketsfor two primary reasions:
Traditional orderflow tools are not available on Tradingview. My script attempts to bring an original; calculus-based approach to creating not only an alternative for traditional orderflow tools, but also a more accurate one.
In order to detect genuine buying and selling pressure that cannot be easily manipulated. I did this because while I've always enjoyed concept behind both of those tools, I did not think they captured enough data to be useful. By analyzing assets that move together (positive correlation) and assets that move inversely (negative correlation), my system aims to fix the fundamental problems with those indicators and create an objective view of market sentiment based on aggregate orderflow.
Some more detailed explanations (using QQQ and SQQQ as an example):
Inverse Market Dynamics (QQQ vs SQQQ):
In an inverse market like SQQQ, aggressive buyers hit the ask when they expect the underlying (QQQ) to fall, while passive buyers wait on the bid hoping for cheaper inverse exposure. When QQQ rallies, SQQQ sees aggressive selling (people dumping their bearish bets) hitting bids, while passive sellers sit on the ask hoping to exit at better prices. The aggression flows opposite to the underlying market direction.
Why Utilizing Both Markets Provides A More Accurate Delta:
Watching both QQQ and SQQQ gives cross-validation - real buying pressure in QQQ should coincide with selling pressure in SQQQ. If you see buying in QQQ but also buying in SQQQ, that's a conflicting signal suggesting the move might be artificial or driven by other factors. The inverse relationship acts as a confirmation filter, making false signals much harder to generate.
Multiple Markets = Authentic Pressure:
The more unique, important markets you track, the harder it becomes to create fake delta moves. Real institutional buying/selling pressure affects multiple correlated assets simultaneously in predictable patterns - you can't easily manipulate tech stocks, treasury bonds, VIX, and currency pairs all at once to create a false signal. Each additional market acts as a fraud detection layer, ensuring the delta measurement reflects genuine ecosystem-wide buying and selling pressure rather than isolated manipulation or noise.
My Suggestions For Usage:
In order to keep the explanation simple and short for now, I suggest using it just like a cumulative delta indicator. For example: let's say you were watching CME_MINI:ES1! , and you had a resistance level at 6000. When the price reaches your resistance level, you would be looking for a significant divergence between price and Delta. Price : rising, Delta : falling. This means that even though the price was going up, strong and aggressive sellers are jumping in more and more, this can be used as a confirmation tool for a resistance level.
Notes For Moderators, Authors and Users:
Firstly, to the best of my knowledge, I have not been able to find many tools built around the concept of cumulative delta or pace of tape. While I know there are a couple projects, none to the magnitude of synthetically recreating these tools via an algorithm designed around basic calculus principles. While tools like Volume Delta are built in, they do not attempt to capture an accurate picture of aggregated orderflow from what I understand.
Secondly, it needs to be noted that tool aims to create an approximation of buying and selling pressure. To my knowledge it is not possible to create an accurate full picture, at least not within the limitations of Tradingview.

VOL & AVG OverlayCustom Session Volume Versus Average Volume
Description:
This indicator will create an overlay on your chart that will show you the following information:
Custom Session Volume
Average For Selected Session
Percentage Comparison
Options:
Set Custom Time Frame For Calculations
Set Custom Time Frame For Average Comparison
Set Custom Time Zone
Enable / Disable Each Value
Change Text Color
Change Background Color
Change Table location
Example:
Set indicator to 30 period average. Set custom time frame to 9:30am to 10:30am Eastern/New York.
When the time frame for the calculation is closed , the indicator will provide a comparison of the current days volume compared to the average of 30 previous days for that same time frame and display it as a percentage in the table.
In this example you could compare how the first hour of the trading day compares to the previous 30 day's average, aiding in evaluating the potential volume for the remainder of the day.
Notes:
Times must be entered in 24 hour format. (1pm = 13:00 etc.)
This indicator is for Intra-day time frames, not > Day.
If you prefer data in this format as opposed to a plotted line, check out my other indicator: ADR & ATR Overlay

Triple Confirmation Scalper v2 - Alarm CompatibleTriple Confirmation Scalper Strategy
A high-probability scalping strategy combining trend momentum, overbought/sold conditions, and volume confirmation to filter low-noise signals.
📊 Strategy Logic
Trend Direction
Dual EMA crossover (9 & 21 periods) for momentum and trend bias.
Overbought/Oversold Zones
RSI (14-period) to avoid entries at extremes.
Volume Spike Filter
OBV + 20-period volume average to confirm breakout validity.
Dynamic Risk Management
Stop-loss: Adaptive to recent price action (5-candle low/high ±1%).
Take-profit: 1.5% target (1.5:1 risk/reward).
🔍 Advanced Features
Precision VWAP (20-period, HLC3-based) for dynamic S/R levels.
Visual Aids:
EMA/VWAP bands + trend-colored background.
Volume spike alerts.
TradingView Alerts pre-configured for long/short signals.
⚙️ Default Settings
Commission: 0.1% factored into backtests.
Mode: Supports both long/short positions.
⚠️ Disclaimer
This is a technical analysis tool, not financial advice.
Past performance ≠ future results. Test thoroughly in a demo account.
Adjust parameters (e.g., EMA periods, RSI thresholds) to match your risk tolerance.
✅ TradingView Compliance Notes:
No exaggerated claims (e.g., "100% win rate").
Clear disclaimer included.
Focus on objective strategy logic (no promotional language).

Volume-RSI Colored Bars
The Volume Indicator, used in conjunction with the embedded Relative Strength Index (RSI), is a powerful tool for making informed trading decisions. Let’s break down how this indicator works and how it can assist you in your trading strategy.
Volume Indicator:
The Volume Indicator tracks the volume of trades occurring in a specific timeframe. Volume shows the number of shares or contracts traded, which can reveal the strength of a price move. If price is moving higher with increasing volume, it generally confirms that the move has more strength, indicating the potential for continuation. Conversely, if the price is moving lower with increasing volume, it indicates strong bearish momentum.
Volume Clusters:
In the chart, we can see various volume clusters highlighted in green, red, and grey. The green bars represent high volume, which can signal strong buying pressure. The red bars represent low volume, signaling that selling pressure is low. Grey bars indicate average volume.
High Volume (Green Bars): High buying pressure, indicating that there may be a strong move in the direction of the price.
Low Volume (Red Bars): Potential signal for a weak move, indicating a lack of participation in the current trend.
RSI (Relative Strength Index):
RSI is a momentum oscillator that indicates whether a market is overbought or oversold. The RSI ranges from 0 to 100, with readings above 70 suggesting an overbought market and readings below 30 suggesting an oversold market.
The RSI is also embedded in the indicator to give a better context when combined with volume. It adds an extra layer of analysis to interpret the price action.
How to Use Volume Indicator with RSI:
Confirming Breakouts:
If you see a breakout in price (an upward movement or downward movement) and the volume indicator shows high volume, this confirms the strength of the breakout.
If the RSI also supports the breakout (for example, it is crossing above 50 or above 70 for an uptrend), it further validates the trade.
Identifying Reversals:
When the price is reaching overbought or oversold levels (RSI above 70 or below 30) and there is low volume (red bars), this may indicate a potential reversal.
If the price is oversold and RSI shows values below 30 with increasing volume (green bars), this could signal a potential buying opportunity as a reversal might occur.
Volume Divergence:
If the price is making new highs, but the volume is declining (red bars), it may signal weakness in the trend, despite the RSI indicating strength. This divergence can help traders anticipate a potential reversal or breakout.
Example from the Chart:
Strong Buy Signal: The price is making an upward movement, the volume bars are turning green (indicating strong buying pressure), and RSI is rising above 50.
Bearish Divergence: You may see RSI moving higher, but volume bars are turning red (indicating weak momentum). This could signal that the upward movement lacks strength, suggesting a potential reversal.
By combining these two indicators, the Volume Indicator and the RSI, traders can make more informed decisions on whether the current trend is sustainable, or if a reversal or breakout is likely.
In conclusion, using the Volume Indicator and RSI together allows for:
Identifying high-volume breakouts and reversals
Filtering out weak price movements
Confirming trends with volume and momentum
This combination enhances trading strategies by providing clear signals of market strength or weakness, helping traders optimize their entry and exit points effectively.

Intrabar Volume Distribution [BigBeluga]Intrabar Volume Distribution is an advanced volume and order flow indicator that visualizes the buy and sell volume distribution within each candlestick.
🔔 Before Use:
Turn off the background color of your candles for clear visibility.
Overlay the indicator on the top layout to ensure accurate alignment with the price chart.
🔵 Key Features:
Inside Bar Volume Visualization:
Each candlestick is divided into two columns:
Left column displays the sell % volume amount.
Right column displays the buy % volume amount.
Provides a clear representation of buyer-seller activity within individual bars.
Percentage Volume Labels:
Labels above each bar show the percentage share of sell and buy volume relative to the total (100%).
Quickly assess market sentiment and volume imbalances.
Point of Control (POC) Levels:
Orange dashed lines mark the POC inside each bar, indicating the price level with the highest traded volume.
Helps identify key liquidity zones within individual candlesticks.
Multi-Timeframe Volume Analysis:
The indicator automatically uses a timeframe 20-30 times lower than the current one to gather detailed volume data.
For each higher timeframe candle, it collects 20-30 bars of lower timeframe data for precise volume mapping.
Each bar is divided into 100 volume bins to capture detailed volume distribution across the price range.
Bins are filled based on the aggregated volume from the lower timeframe data.
Lookback Period:
Allows traders to select how many bars to display with delta and volume information.
The beginning of the selected lookback period is marked with a gray line and label for quick reference.
Indicator displays up to 80 bars back
🔵 Usage:
Order Flow Analysis: Monitor buy/sell volume distribution to spot potential reversals or continuations.
Liquidity Identification: Use POC levels to locate areas of strong market interest and potential support/resistance.
Volume Imbalance Detection: Pay attention to percentage labels for quick recognition of buyer or seller dominance.
Scalping & Intraday Trading: Ideal for traders seeking real-time insight into order flow and volume behavior.
Historical Analysis: Adjust the lookback period to analyze past price action and volume activity.
Intrabar Volume Distribution is a powerful tool for traders aiming to gain deeper insight into market sentiment through detailed volume analysis, allowing for more informed trading decisions based on real-time order flow dynamics.

Harmonic Rolling VWAP (Zeiierman)█ Overview
The Harmonic Rolling VWAP (Zeiierman) indicator combines the concept of the Rolling Volume Weighted Average Price (VWAP) with advanced harmonic analysis using Discrete Fourier Transform (DFT). This innovative indicator aims to provide traders with a dynamic view of price action, capturing both the volume-weighted price and underlying harmonic patterns. By leveraging this combination, traders can gain deeper insights into market trends and potential reversal points.
█ How It Works
The Harmonic Rolling VWAP calculates the rolling VWAP over a specified window of bars, giving more weight to periods with higher trading volume. This VWAP is then subjected to harmonic analysis using the Discrete Fourier Transform (DFT), which decomposes the VWAP into its frequency components.
Key Components:
Rolling VWAP (RVWAP): A moving average that gives more weight to higher volume periods, calculated over a user-defined window.
True Range (TR): Measures volatility by comparing the current high and low prices, considering the previous close price.
Discrete Fourier Transform (DFT): Analyzes the harmonic patterns within the RVWAP by decomposing it into its frequency components.
Standard Deviation Bands: These bands provide a visual representation of price volatility around the RVWAP, helping traders identify potential overbought or oversold conditions.
█ How to Use
Identify Trends: The RVWAP line helps in identifying the underlying trend by smoothing out short-term price fluctuations and focusing on volume-weighted prices.
Assess Volatility: The standard deviation bands around the RVWAP give a clear view of price volatility, helping traders identify potential breakout or breakdown points.
Find Entry and Exit Points: Traders can look for entries when the price is near the lower bands in an uptrend or near the upper bands in a downtrend. Exits can be considered when the price approaches the opposite bands or shows harmonic divergence.
█ Settings
VWAP Source: Defines the price data used for VWAP calculations. The source input defines the price data used for calculations. This setting affects the VWAP calculations and the resulting bands.
Window: Sets the number of bars used for the rolling calculations. The window input sets the number of bars used for the rolling calculations. A larger window smooths the VWAP and standard deviation bands, making the indicator less sensitive to short-term price fluctuations. A smaller window makes the indicator more responsive to recent price changes.
-----------------
Disclaimer
The information contained in my Scripts/Indicators/Ideas/Algos/Systems does not constitute financial advice or a solicitation to buy or sell any securities of any type. I will not accept liability for any loss or damage, including without limitation any loss of profit, which may arise directly or indirectly from the use of or reliance on such information.
All investments involve risk, and the past performance of a security, industry, sector, market, financial product, trading strategy, backtest, or individual's trading does not guarantee future results or returns. Investors are fully responsible for any investment decisions they make. Such decisions should be based solely on an evaluation of their financial circumstances, investment objectives, risk tolerance, and liquidity needs.
My Scripts/Indicators/Ideas/Algos/Systems are only for educational purposes!
