Advanced Custom Volume Profile [KRUTO]⚠️ LANGUAGE NOTICE: This script features a SLOVAK (SK) user interface (settings and tooltips).
This is a highly customizable and versatile Volume Profile indicator designed for precise market analysis. It separates itself from standard tools by offering dynamic anchoring modes, advanced HVN/LVN detection logic, and a "Smart Lines" feature that keeps your chart clean.
Key Features
1. Three Dynamic Anchoring Modes:
Fixed Range (Na čiare výberu): Define exact Start and End times manually. Includes vertical dashed lines to visualize the range.
Anchor to Last Candle (Na poslednej sviečke): Calculates volume from a specific start time up to the current live price. The profile is always anchored to the most recent bar.
Visible Range (Visible - Viditeľné sviečky): Dynamically calculates the profile based only on the candles currently visible on your screen. As you scroll or zoom, the profile updates automatically.
2. HVN & LVN Detection:
HVN (High Volume Nodes): Automatically highlights areas of high consolidation (Green zones). Includes a "merge tolerance" setting to group nearby nodes.
LVN (Low Volume Nodes): Highlights areas of low liquidity/rejection (Red zones).
3. Key Levels & Visuals:
Displays POC (Point of Control), VAH (Value Area High), and VAL (Value Area Low) with extendable lines.
Smart Offset: Keeps the profile at a fixed distance from the latest candle (or right edge) to prevent chart clutter.
Clean Look: Vertical range lines automatically disappear when not in "Fixed Range" mode.
Translation Guide (Slovak -> English)
Since the settings are in Slovak, here is a quick guide for English users:
Zdroj dát profilu (Source):
Na čiare výberu = Fixed Time Range
Na poslednej sviečke = Fixed Start to Current Bar
Visible = Visible Range
Počet úrovní (Bins): Resolution of the histogram (e.g., 160).
Value Area (%): Percentage of volume considered as value (Standard 70%).
Začiatočný / Koncový čas: Start / End Time.
Offset: Distance of the profile from the price action.
Zobraziť HVN / LVN: Show High/Low Volume Nodes.
Credits: Custom logic developed for advanced volume analysis with anti-overlap algorithms for node visualization.
Enjoy the script! 🚀
Vpvr

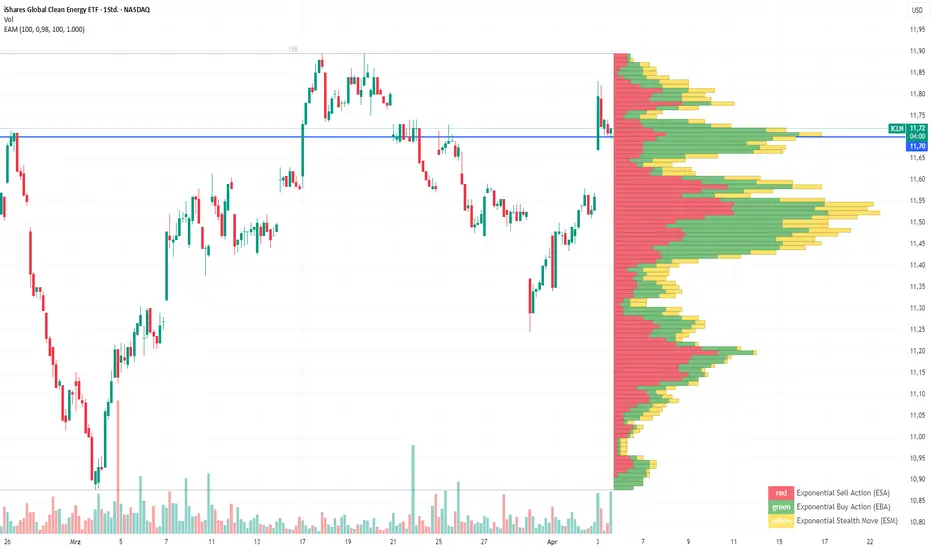
Exponential Action Map (EAM)### **Exponential Action Map (EAM) – Description and Differences from VPVR**
The Exponential Action Map (EAM) indicator is a Pine Script-based volume profile indicator that offers **a weighted representation of buying and selling activity**. Unlike the standard **Volume Profile Visible Range (VPVR)**, which simply shows traded volume at various price levels, the EAM provides the following additional features:
1. **Exponential Weighting**:
- Instead of treating the volume of all considered bars equally, the EAM uses a **decay factor** to gradually diminish the significance of older data. This allows **more recent price movements to have greater influence**, making it particularly useful for short-term analysis.
2. **Exponential Stealth Move (ESM)**:
- In addition to buy and sell volume, the EAM calculates and displays the **Exponential Stealth Move (ESM)**.
- This measures the relative price movement compared to volume and highlights areas where **significant price changes occur with low volume**, which may indicate institutional activity or strong momentum.
- The ESM visualization is not present in VPVR, making it a distinct and valuable feature.
3. **Visualization Methodology**:
- Instead of simple histograms like in VPVR, volume is represented by **dynamic boxes** that encompass Buy (EBA), Sell (ESA), and Stealth Move (ESM) activities.
- The size and color of these boxes are **customizable**, allowing for clear differentiation between various volume types.
4. **Flexibility & Configuration**:
- Users can adjust parameters such as **Number of Bars, Decay Factor, Bar Width, and Maximum History Data**.
- The ability to **toggle historical data visibility** offers a **tailored view** that VPVR does not provide.
**Conclusion:** The EAM extends the classic volume profile (VPVR) by introducing **time-weighted volume analysis and detection of Stealth Moves (ESM)**. This not only highlights price levels with high trading volume but also reveals **price movements with low liquidity**, which can potentially indicate institutional interest.
Volume Profile PlusThis indicator provides a high-resolution and high-precision implementation of Volume Profile with flexible range settings. Its key features include:
1. Support for a high resolution of up to 2,500 rows.
2. Capability to examine lower timeframe bars (default 5,000 intra-bars) for enhanced precision.
3. Three range modes — "Visible Range", "Anchored Range", and "All Range".
4. Highlighting of Point of Control and Value Area.
5. Extensive customization options allowing users to configure dimensions, on-chart placements, and color schemes.
🔵 Settings
The settings screen, along with the explanations for each setting, is provided below:
🔵 High Resolution using Polyline
Inspired by @fikira, this indicator utilizes the newly introduced `polyline` type in PineScript to plot the volume profile. It employs a single polyline instance to represent the entire histogram. With each polyline instance supporting up to 10,000 points and each histogram row requiring 4 points, this indicator can accommodate 2500 rows, resulting in a significantly higher resolution compared to conventional volume profile indicators that use `line`s or `box`es to draw the histogram.
🔵 High Precision Data-binning using Lower Timeframe Data
Conventional volume profile indicators often face one or both of the following limitations:
1. They only consider volume within the chart's current timeframe.
2. They assign each bar's total volume to a single price bucket based on the bar's average price, rather than distributing volume across multiple price buckets.
As a result, when the number of bars in the chart is low, those indicators may provide imprecise results, making it difficult to accurately identify significant volume nodes and the point of control.
To address these limitations and enhance accuracy, this indicator examines data from lower timeframes and distributes the volume to fine-grained price buckets. It intelligently selects an appropriate lower timeframe to ensure precise output while complying with a maximum specified number of bars to maintain good performance.
🔵 Three Range Modes
This indicator offers users the flexibility to choose from three range modes:
1. Visible Range (Default Mode): In this mode, the volume profile calculation begins at the time of the left-most bar displayed in the current viewport. As the user scrolls through the viewport, the volume profile updates automatically.
2. Anchored Range: This mode allows the user to set the start time either by using the datetime input boxes or by dragging the anchor line on the chart.
3. All Range: In this mode, the volume profile calculation is based on all the historical bars available in the chart.

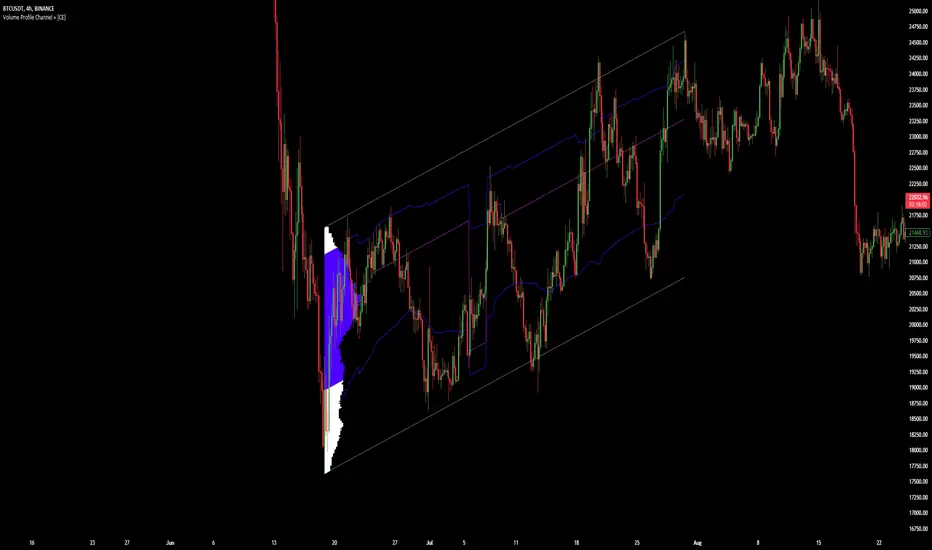
Volume Profile Channel [CE]Volume Profile Channel
Volume Profile Channel, Is the first of its kind tool that will plot a volume profile in any directional channel, the tool will calculate a profile and display the following, POC/VAH/VAL.
The typical profile works by on a horizontal access such that ticksize can be calculated along the y axis and data can then be used to generate a profile, the angle of a parallel channel would make this unavailable.
By cleverly using the angle at which the profile is created, a diagonal ticksize is generated and applied to the profile to create a first of its kind parallel channel volume profile tool!
User Controllable Width:
As compared to the above or below images, users have the ability to control the width this will allow them to show how much of the space the profile will draw on the chart with, using the value "0"
can be done to completely remove the profile whilst still tracking the POC,VAH,VAL
0 Width:
Users can the total number of rows,
Number Of Rows 50:
Ability to "anti-alias" the profile as well below will show a comparison of this occurring:
Unsmoothed
Smoothed
The advantage of using this is that as opposed to relying datasets of mid points or custom equal values along a parallel channel , users can now use the profile to see where the channel has the most interaction, (POC).
This allows for an objective look into the data as opposed to identifying by "eye" where traders are exchanging hands or vs using values such as the midpoint which may not necessarily always be a point of interest as the POC will be.
The VAH/VAL levels give good opportunity to see reactions at levels we may not previously be able to see in the channel with fixed values, allowing us to take positions in a more dynamic sense which may not be identifiable with fixed positions, 0.25,0.5,0.75 etc...

Volume Profile Channel + [CE]Volume Profile Channel +
Volume Profile Channel +, Is the first of its kind tool that will plot a volume profile in any directional channel, the tool will calculate a profile and display the following, POC/VAH/VAL.
The typical profile works by on a horizontal access such that ticksize can be calculated along the y axis and data can then be used to generate a profile, the angle of a parallel channel would make this unavailable.
By cleverly using the angle at which the profile is created, a diagonal ticksize is generated and applied to the profile to create a first of its kind parallel channel volume profile tool!
Features include the ability to "anti-alias" the profile as well below will show a comparison of this occurring:
Unsmoothed
Smoothed
Additionally this mode comes with the ability to track the development of the POC AND VAH/VAL overtime:
The advantage of using this is that as opposed to relying datasets of mid points or custom equal values along a parallel channel, users can now use the profile to see where the channel has the most interaction, (POC).
This allows for an objective look into the data as opposed to identifying by "eye" where traders are exchanging hands or vs using values such as the midpoint which may not necessarily always be a point of interest as the POC will be.
The VAH/VAL levels give good opportunity to see reactions at levels we may not previously be able to see in the channel with fixed values, allowing us to take positions in a more dynamic sense.
As you can see in the chart below with the track enabled, you can see clear reaction points when price interacted with these dynamic levels, which may not be identifiable with fixed positions, 0.25,0.5,0.75 etc...
TO DO
Dynamic Extension Points
Custom Alerts
Real Time Extension
Aggregate VPVR [CE]Aggregate VPVR
Aggregate Volume automatically fetches and aggregates futures volume data from multiple exchanges such as Binance, OKX, and Bybit -- for any crypto asset, and highlights the volume bars that exceed a user-defined threshold.
Using this logic the CE team have put together a new VPVR script that uses aggregated data to produce new profile. The tool takes a fresh look at the VPVR usage by highlighting the VA in the ratio of contribution to volume by each exchange.
Each exchange is toggleable so users can view data related to the exchange and aggregate as needed e.g.
Binance + bybit
OKX + bybit
Binance + OKX
Customizable widths:
5 %
Customizable widths:
35 %
Additional customizations include ticksize, above is 10 ticksize, below is an example of 5 ticksize for increased granularity:
Finally the benefit of this vs traditional VPVR is seeing exchange participation at high volume levels across available assets.

Aggregate VPVR + [CE]Aggregate VPVR +
Aggregate Volume automatically fetches and aggregates futures volume data from multiple exchanges such as Binance, OKX, and Bybit -- for any crypto asset, and highlights the volume bars that exceed a user-defined threshold.
Using this logic the CE team have put together a new VPVR script that uses aggregated data to produce new profile. The tool takes a fresh look at the VPVR usage by highlighting the VA in the ratio of contribution to volume by each exchange.
Each exchange is toggleable so users can view data related to the exchange and aggregate as needed e.g.
Binance + bybit
OKX + bybit
Binance + OKX
Additional benefits of + mode:
Rolling Bar Mode
Rolling bar mode comes with the added benefit of a persistent number of bars the profile will elapse, this makes it perfect for users who may change their chart often + will reflect the rolling bars in history also.
Developing VA + Developing POC
Additionally comes with developing Value area and POC making it easier to back test strategies as we can see the interaction with price at time of the VA/POC relevant to the candle.
Finally the addition of alerts:
Re enter VA
Leave VA
Cross above POC
Cross below POC

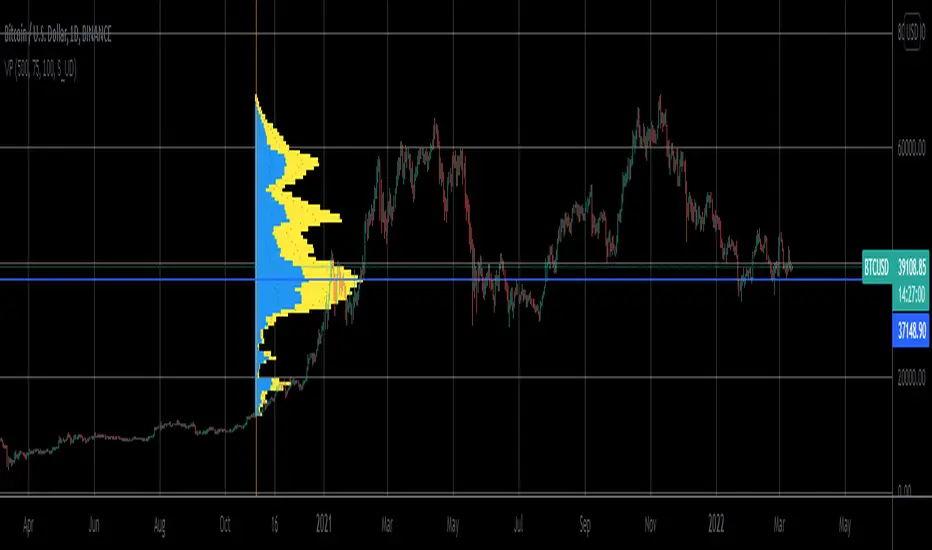
Volume Profile Visible Range For All AccountsVolume Profile Visible Range For All Accounts is displaying volume from price perspective. It’s done by summing volume by the “estimated” transaction price. This version is estimating it based on public volume data so it can be used with any account.
Volume Profile is a powerful tool commonly used by PRO users, to disseminate its use also by users who operate on basic volume data, we have prepared a set of scripts:
Volume Profile For All Accounts – Analyze last 50-20000 bars.
Volume Profile From Date For All Accounts – Analyze all bars since start date.
Volume Profile Range For All Accounts – Analyze bars in a range between start and end date.
Volume Profile Visible Range For All Accounts – Analyze bars in the range visible on the screen.
If after reading script description something is not clear, do not hesitate to ask. We are helping all users.
Script Settings:
| SCANNER VISUALIZATION |
Rows – Number of rows
Width – Width of the visualization.
Position – Position of the visualization:
S_DU – At START of the area (left edge of the screen), DOWN first
S_UD – At START of the area (left edge of the screen), UP first
BE_DU – At BEFORE END of the area, DOWN first
BE_UD – At BEFORE END of the area, UP first
E_DU – At END of the area, DOWN first
E_UD – At END of the area, UP first
Color Up – Color of volume classified as move Up, or Both if separation is off.
Color Down - Color of volume classified as move Down
Color Border – Border color.
Up/Down separate – Draw separate volume classified as Up and Down
Show values – Showing volume values of the bars.
Troubleshooting:
In case of any problems, send error details to the author of the script.
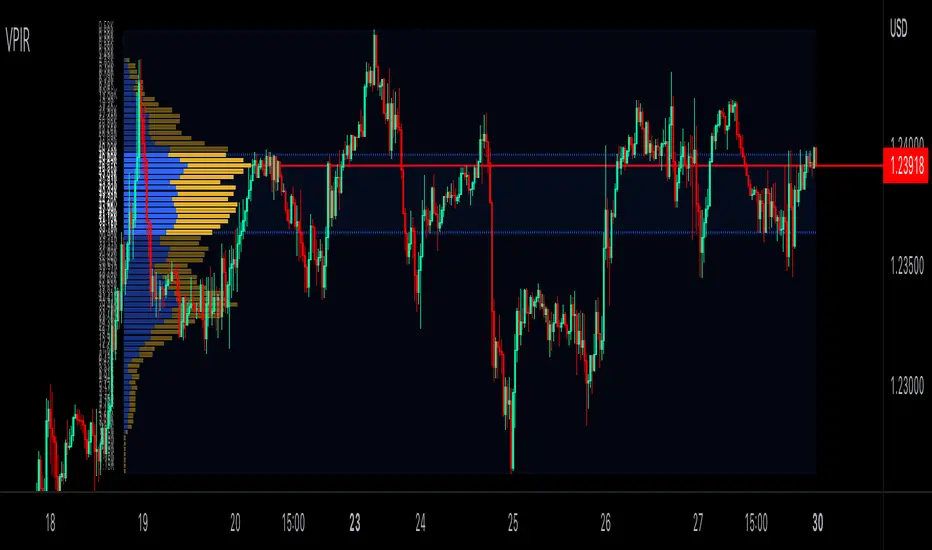
Volume Profile Interactive RangeVolume Profile Interactive Range (VPIR) is a brand new interactive VP enables you to analyze the market in depth.
Interactive mode lets you to set the duration(source) of VP intuitively.
PoC, VA(VAH&VAL) are fully supported.
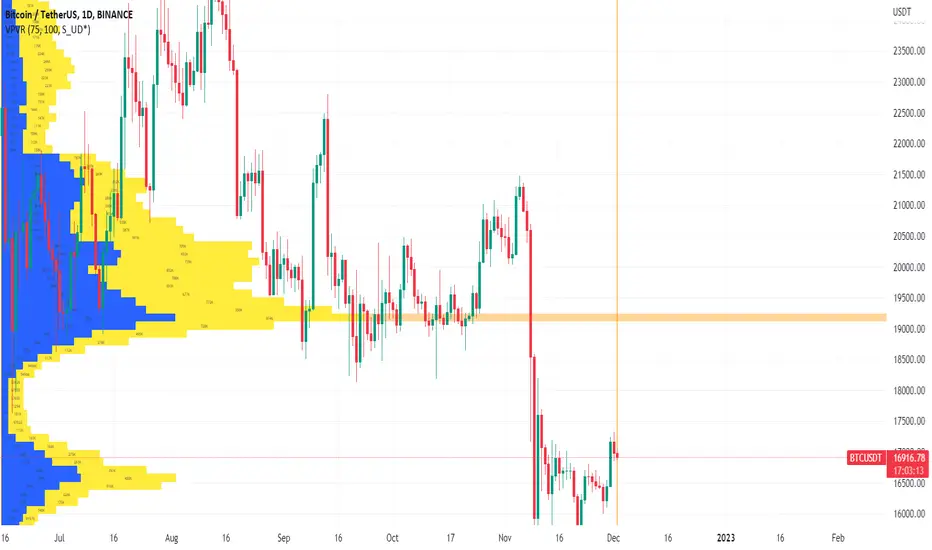
Volume Profile For All AccountsVolume Profile For All Accounts is displaying volume from price perspective. It’s done by summing volume by the “estimated” transaction price. This version is estimating it based on public volume data so it can be used with any account.
Volume Profile is a powerful tool commonly used by PRO users, to disseminate its use also by users who operate on basic volume data, we have prepared a set of scripts:
Volume Profile For All Accounts – Analyze last 50-20000 bars.
Volume Profile From Date For All Accounts – Analyze all bars since start date.
Volume Profile Range For All Accounts – Analyze bars in a range between start and end date.
Traiding View is supporting paid users with Volume Profile on extended volume dataset. We recommend to use it, because of access to more precise data.
Settings:
SCANNER VISUALIZATION
Limit – How many last bars should be taken into account during calculations. For small values, the estimation may differ significantly from the Volume Profile available for Paid Traiding View users.
Rows – Number of rows
Width – Width of the visualization.
Position – Position of the visualization:
S_DU – At START of the area, DOWN first
S_UD – At START of the area, UP first
BE_DU – At BEFORE END of the area, DOWN first
BE_UD – At BEFORE END of the area, UP first
E_DU – At END of the area, DOWN first
E_UD – At END of the area, UP first
Color Up – Color of volume classified as move Up, or Both if separation is off.
Color Down - Color of volume classified as move Down
Color Border – Border color.
Up/Down separate – Draw separate volume classified as Up and Down
Show values – Showing volume values of the bars.
Troubleshooting:
In case of any problems, send error details to the author of the script.
TradingLatino_StrategySPANISH:
TL_STRATEGY:
El TL_STRATEGY, es todo un ecosistema de indicadores que conforman una estrategia bastante potente y famosa en el trading de criptomonedas, está compuesta por los siguientes indicadores:
• Bandas de medias móviles exponenciales (10 y 55)
• Squeeze Momentum Indicator (SQZMON PRO+).
• Volume Profile (VP Desarrollado por APIDEVs).
• Average Directional Index ( ADX PRO+).
En ApiDev, decidimos optimizar visualmente esta estrategia, es por ello que creamos un panel informativo que muestra la proyección conjunta de todos los indicadores que ya mencionamos.
MEJORAS REALIZADAS EN LA ESTRATEGIA:
Más simple: Simplificamos la interfaz de todos los indicadores [para que el operador pueda seguir el ABC de su estrategia sin mucha complicación.
Señales de compra y venta: Basado en una estrategia que incorpora dos medias móviles de 10 y 55 periodos, la observación de la fuerza del ADX y la direccionalidad de los osciladores del SQZMON, señales de compra y venta para ser valorado por el comerciante.
Panel lateral: Integramos un panel lateral que permite observar la valoración y dirección de todos los indicadores que componen la estrategia.
Tiene un sistema de alerta que enviará notificaciones sobre los cambios que se produzcan en el indicador.
ENGLISH:
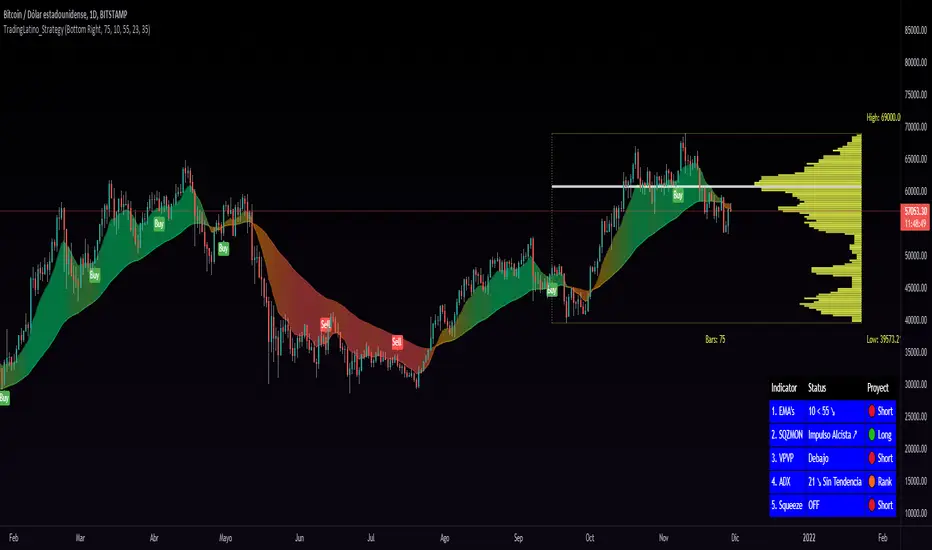
TL_STRATEGY:
The TL_STRATEGY , is a whole ecosystem of indicators that make up a quite powerful and famous strategy in cryptocurrency trading, it is composed of the following indicators:
• Exponential moving media bands (10 and 55).
• Squeeze Momentum indicator (SQZMON PRO +).
• Volume profile (VP Developed by APIDEVs).
• Average directional index ( ADX PRO +).
In ApiDev , we decided to visually optimize this strategy, that is why we created an information panel that shows the joint projection of all the indicators that we already mentioned.
IMPROVEMENTS MADE IN THE STRATEGY:
Simpler: We simplified the interface of all indicators [so that the trader can follow the ABCs of his strategy without much complication.
Buy and sell signals: Based on a strategy that incorporates two moving averages of 10 and 55 periods, the observation of the strength of the ADX and the directionality of the oscillators of the SQZMON, signals of buying and selling to be valued by the trader.
Side panel: We integrate a side panel that allows observing the assessment and direction of all the indicators that make up the strategy.
It has an alert system that will send notifications about the changes that occur in the indicator.
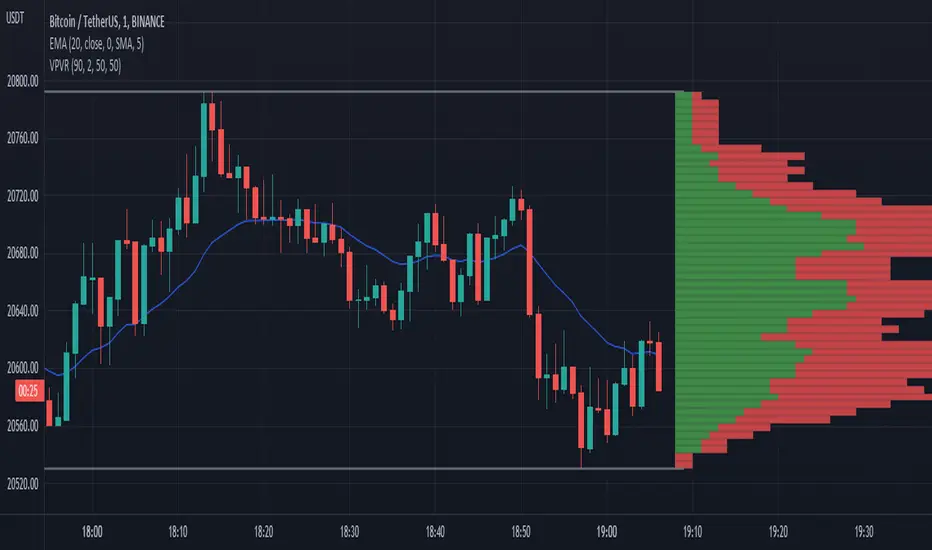
Fr3d0's Volume Profile Visible RangeLow level implementation
At the core of VPVR there’s a concept called “bucketization”.
Question : what is bucketization?
Answer : bucketization consists of identifying metrics with high predictive power and combine them appropriately.
I think this is a problem of bucketization because what the VPVR does is to take a price range, divide it into buckets and fill them up with the volume that was produced in each bucket’s range over the given period.
The more we divide our price range the finer the resolution, but also the less significant each bucket will become.
The steps are :
1. Get the price range with min and max over the give period;
2. Divide the range into buckets;
3. Loop over each candle of the given period and proportionally assign volume to one or more bucket.
Question : how to assign volume to buckets?
Answer : we need to calculate the right amount to add to each bucket for each candle. If 20% of a candle lies on a bucket then that bucket needs to have 20% of the volume of that candle, the rest 80% belongs to other buckets.
To get the percentage of a candle on a given bucket we have to find the price range of the candle contained within the bucket, then divide that amount by the entire length of the candle.
How to bucketize
Question : what are the formulas of A, B, C and Target respectively?
Answer :
- A = Max(candle_high, bucket_top) - Min(candle_low, bucket_bottom);
- B = Max(candle_high, bucket_top) - Min(candle_high, bucket_top);
- C = Max(candle_low, bucket_bottom) - Min(candle_low, bucket_bottom);
- Target = A - B - C.
Now that we now how to calculate the price range belonging to each bucket we need to calculate a percentage of volume to fill the bucket with.
The formula is trivially simple :
Volume * Target / (candle_high - candle_low).
Question : can we distinguish between buy volume and sell volume? If so, how?
Answer : yes we can and the following paragraph will teach you how.
Put it simply we can use the difference between the extremes of a candle (low and high) and its close price to get the buy and sell volumes.
The formulas for that are :
- Buy volume = Volume * (close - low) / (high - low);
- Sell volume = Volume * (high - close) / (high - low).
I know this is rather simplicistic but it makes sense.
Closing thoughts
This script is a working progress and I’m going to give more details if necessary, just let me know in the comments down below.
Silen's Pseudo VPVR / Pseudo Volume Profile Custom RangeDisclamer: This indicator does not use actual Volume data and doesn't display any Volume data. It creates a pseudo Volume Profile by counting the high-low-2 values of candles and simulates something that is similar to a Volume Profile without using any Volume data.
Core facts:
Creates a pseudo Volume Profile by counting values of candles and sorting them into a Profile.
Works for charts that don't provide any Volume Information.
Can display up to 5 different Value Levels.
Value level colors are (from largest to smallest level): Red, Orange, Yellow, Green, Blue.
The Value levels can be used as Support and Resistance indicators.
The Custom Range of the Volume Profile can be adjusted from 10 to 1500 bars.
Much faster than the other custom pseudo VPVRs out there.
Shortcomings:
As the chart progresses with bars the line positions will distort to the left side. Refreshing the tradingview page or switching to another time interval fixes this. I might fix this issue in the future.
Does not use actual Volume nor display actual Volume.
Note: For those who wondered what happened to my first version of this indicator: It got taken down by Tradingview because it was misleading as to using the words "Volume Profile" and "Visible Range". I fully support their decision and I hope I could clear any misunderstandings! Give their team a heads up for the hard work they're doing in keeping this place clean and well organized!
Enjoy! :)

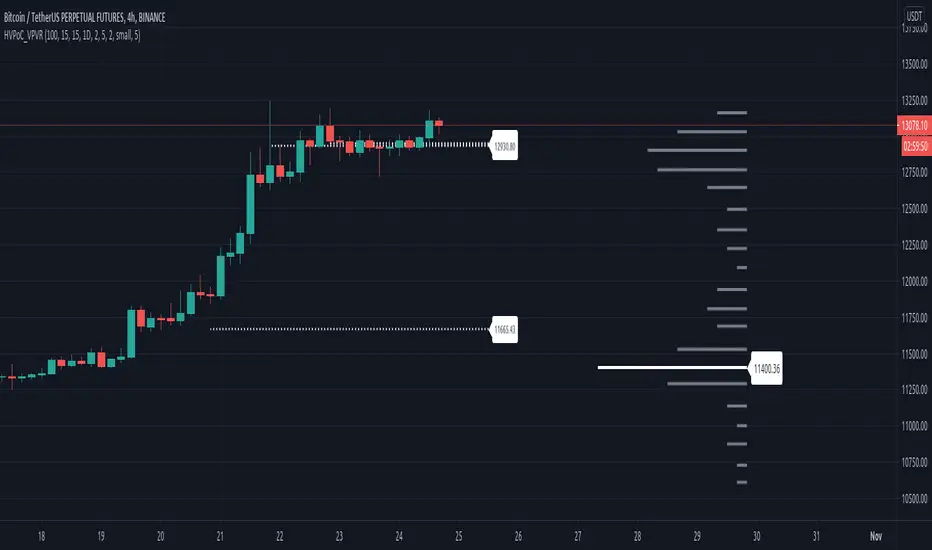
Historic VPoCs and pseudo VPVRThis study tries to recreate session based historic VPoCs
and VPVR Volume Profile
as they are used by
TradingLatino TradingView user.
It's aimed at BTCUSDT pair and 4h timeframe.
HOW IT WORKS
HOW IT WORKS - VPVR Profile Block
It gathers volume from the last chosen Bars
in order to draw the vpvr profile block
Volume that intersects with current level range
being studied is added to its value.
Additionally the current level price is modified
so that it matches the level price where most
of the volume has concentrated
So you get a pretty accurate price for drawn volume
while at the same time the levels are not stuck
to arbitrary level prices.
HOW IT WORKS - VPoC
It calculates a Volume Profile for the
given historic session but then
it only outputs that Volume Profile VPoC.
SETTINGS
Show VPVR Volume Profile {True}.
Show Historic VPoC lines {True}.
Show Historic VPoC labels {True}.
Extend Historic VPoC lines {True}: If this option is turned off the VPoC lines are only shown during the session duration.
Show tick difference from current price {False}: BETA. Feedback is needed because I'm not sure how it should work this setting.
VPVR Number of bars {100}: Define the Visible Range in number of bars so that its Volume Profile can be shown.
VPVR Profile width (in bars) {15}: VPVR Profile can be make larger or smaller in width thanks to this option.
VPVR Profile offset (in bars) {15}: VPVR Profile can be shown more to the left or to the right if the defaults do not suit you.
Historic Session Volume Profile timeframe {1D}: Historic VPoC use 1 day as their timeframe reference by default.
Number of decimal digits {2}: How many decimal digits are shown in label prices.
Number of previous sessions to print VPoC {5}: How many previous sessions VPoCs are to be printed. The maximum for this setting is 20.
Historic VPoC lines width (in pixels) {2}.
Historic VPoC labels size {small}.
History VPoC line offset (in bars) {5}: How far to the right VPoCs lines are to be extended. Note: This setting does not apply when 'Extend Historic VPoC lines' is set to 'False'.
WARNING
Please be aware that VPoC from the first previous session might not be accurate due to Pine Script limitations.
VPVR USAGE
This is not a VPVR like the official TradingView indicator.
This is a pseudo VPVR and that means it needs some manual input from you.
But, don't worry it's quite easy to do and if you always use the same number
of bars to calculate your VPVR then you might even just set it up once.
In order to show the VPVR (or Volume Profile on the Visible Range):
Rescale your chart so that you see all the bars for your Visible Range.
Click on the ruler tool.
Click on the last bar (far to the right) shown on the screen
Drag the ruler to first bar (far to the left) shown on the screen
Check what the ruler says
E.g. it says: 101 bars
Open this study settings
Modify: 'VPVR Number of bars ' setting
So that its value matches your measured number of bars (101)
Press OK to confirm and wait for the indicator to refresh.
STRATEGY USAGE
If your strategy uses VPoC
to define your resistances
or supports
you can check the VPoCs shown here.
FEEDBACK
I have only used this identifier in BTCUSDT 4h timeframe.
I'm interested to know what needs to be tweaked
in other securities and timeframes.
PINE STUDY TRICK
This study let's you choose the number of decimals the label will use.
CREDITS
I have reused and adapted some code from
'Poor man's volume profile' study
which it's from TradingView IldarAkhmetgaleev user.
I also wanted to thank him for helping me understanding his study.
I have reused some code from
'MTF Selection Framework - PineCoders FAQ' study
which it's from TradingView PineCoders user.