Hawkeye FatmanFatman – the premier Forex strength meter that tells you where to start
The Fatman was the first of its kind in the world, and while many have attempted to emulate it, no one has perfected it like Hawkeye.
The main problem for Forex traders is which pair to trade. Fatman makes hundreds of calculations every second to present a visual picture of the strength or weakness of each currency. This indicator shows you what each currency is doing against the rest of the world’s major currencies, and shows low risk opportunities particularly when currencies are either overbought or oversold – get ready, there will be a change in trend and a great opportunity to trade.
VSA


Hawkeye Volume HTA higher timeframe version of Hawkeye Volume. Allows you to see the market volume across multiple timeframe, giving even better insight.


Hawkeye Volume Pack 1Contains the indicators Hawkeye Volume, Hawkeye VolumePB and Hawkeye Volume Radar.

Hawkeye Trend+StopsHawkeye Trend+Stops -- the tool that breathes with market condition
With Trend+Stops you get a true sense of the market trend rather than opinions from the financial media.
This powerful indicator tells you when a trend is commencing, in congestion and where the correct exit is. You’ll have the confidence to stay in a trend, a feat that proves difficult for most novice traders.
Trend+Stops is based on the Hawkeye Volume algorithm of pattern recognition and average true range. Using this tool will stop you from having "opinions" on market direction and allow you to take control of your trading.
Trend+Stops overcomes two of the biggest hurdles to successful trading:
Where the trend is at the given moment (and its momentum)
Where your stop exit should be
The Hawkeye Trend+Stops Indicator
One of the most difficult tasks in trading is to know when the market you are trading is in a trend, and when it is not. It is the correct selection of trades in trending markets that makes the difference between a profitable trade, and one that gets you stopped out with a loss.
The problem is that markets spend more time moving sideways than they do in a trend. Consequently many traders find themselves in a trade they believe is the start of a trend, only to discover that the market moved sideways, with the position being closed out at a loss. This is the single most frustrating part of trading, and it accounts for more traders making overall losses on their account than any other factor -- Hawkeye Trend+Stops

Hawkeye TrendHawkeye Trend is Hawkeye Traders flagship product.
With Trend you get a true sense of the market trend rather than opinions from the financial media.
This powerful indicator tells you when a trend is commencing, in congestion and where the correct exit is. You’ll have the confidence to stay in a trend, a feat that proves difficult for most novice traders.
Trend+Stops is based on the Hawkeye Volume algorithm of pattern recognition and average true range. Using this tool will stop you from having "opinions" on market direction and allow you to take control of your trading.
One of the most difficult tasks in trading is to know when the market you are trading is in a trend, and when it is not. It is the correct selection of trades in trending markets that makes the difference between a profitable trade, and one that gets you stopped out with a loss.
The problem is that markets spend more time moving sideways than they do in a trend. Consequently many traders find themselves in a trade they believe is the start of a trend, only to discover that the market moved sideways, with the position being closed out at a loss. This is the single most frustrating part of trading, and it accounts for more traders making overall losses on their account than any other factor -- Hawkeye Trend overcomes this problem.

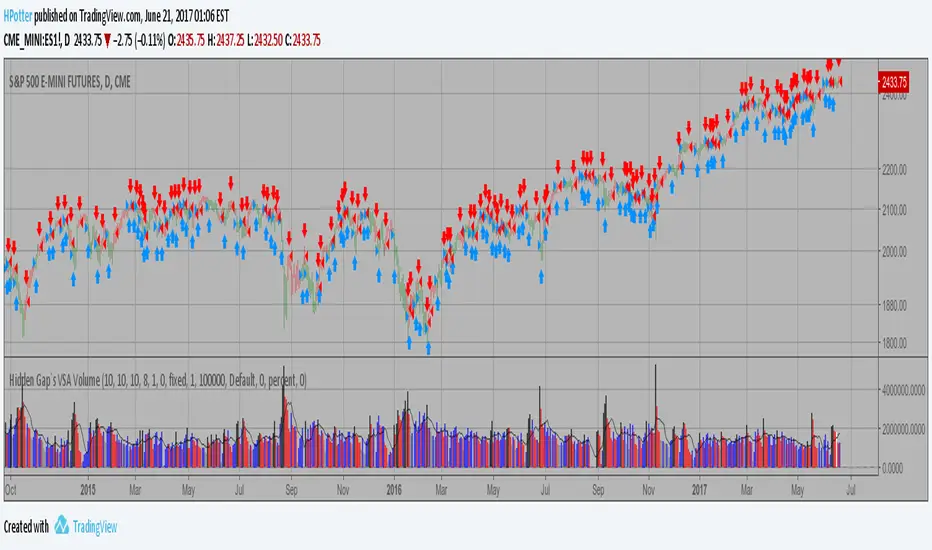
Hidden Gap`s VSA Volume If Volume is less then the previous 20 intervals, Volume is gray.
If Volume is greater then the previous 40 intervals, Volume is black.
If Volume is less then the previous 2 intervals, Volume is purple.
If Volume is less then the previous, Volume is red.
If Volume is greater then the previous, Volume is blue.
Other - white.
You can add on the indicator a 2.5 Standart Deviation of a 20 period
Bollinger Band Shifted 3 periods forward.
You can change long to short in the Input Settings
Please, use it only for learning or paper trading. Do not for real trading.
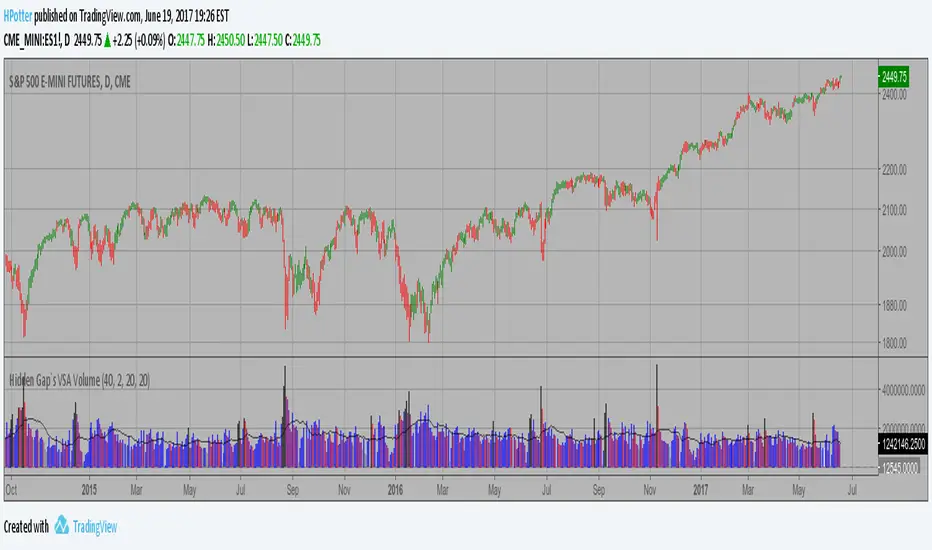
Hidden Gap`s VSA Volume If Volume is less then the previous 20 intervals, Volume is gray.
If Volume is greater then the previous 40 intervals, Volume is black.
If Volume is less then the previous 2 intervals, Volume is purple.
If Volume is less then the previous, Volume is red.
If Volume is greater then the previous, Volume is blue.
Other - white.
You can add on the indicator a 2.5 Standart Deviation of a 20 period
Bollinger Band Shifted 3 periods forward.
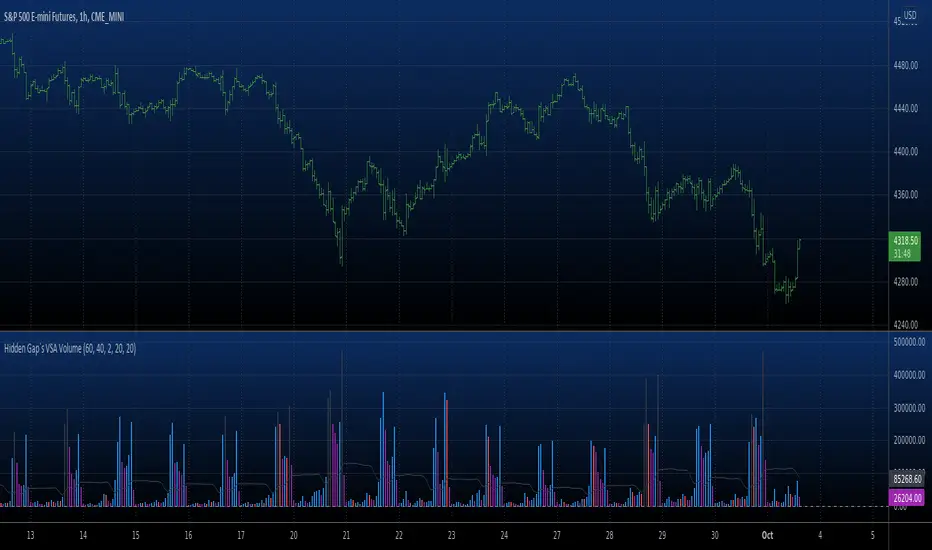

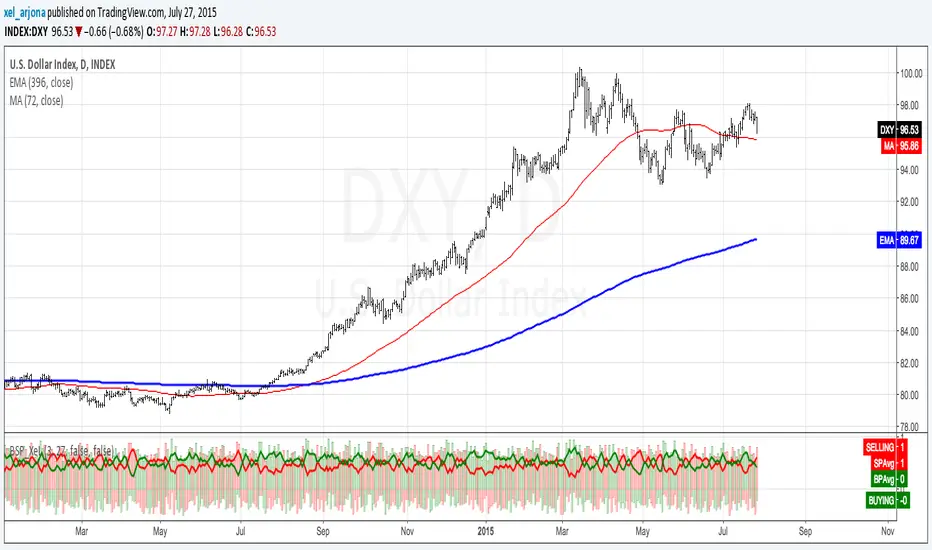
BUY & SELL PRESSURE XeLMod V2BUY & SELL PRESSURE Oscillator
Ver. 2.0 XelMod
WHAT'S THIS?
This is an UPDATED version of a previous script already posted.
List of changes from previous script:
Separated as Column Histogram just the Regressive (Rate-Of-Change) Force of the indicator which gives a faster response of the trend.
Default period is now set to 81, as better Oscillator swing lagging.
This is an excelent momentum indicator very similar to ADX but in a candle weighting distribution rather than ranges.
For additional reference:
Karthik Marar BUY AND SELL PRESSURE INDICATORS.
Cheers!
Any feedback will be welcome...
@XeL_Arjona

BUY & SELL PRESSURE by RegressionBUY & SELL PRESSURE by Regression Analysis at candle price/volume (Rate-Of-Change)
Ver. 3 By Ricardo M Arjona @XeL_Arjona
DISCLAIMER:
The Following indicator/code IS NOT intended to be a formal investment advice or recommendation by the author, nor should be construed as such. Users will be fully responsible by their use regarding their own trading vehicles/assets.
The embedded code and ideas within this work are FREELY AND PUBLICLY available on the Web for NON LUCRATIVE ACTIVITIES and must remain as is.
WHAT'S THIS?
This is my 3rd. revision of the original implementation for AmiBroker by Karthik Marar's of it's BUY AND SELL PRESSURE INDICATORS but this time, constructed under a complete REGRESSIVE ANALYSIS premise based in Rate Of Change (A kind of Slope but measured in % Performance).
Some minimal adaptation's (and cleaning) have been made:
Instead of simple Range calculation at price, Rate Of Change (Regressive) is used.
Oscillator of Pressure can be deactivated in favor of a simple RoC Cumulative Pressures at candle.
Oscillator can read Volume data from external tickers for accurate Index calculation. ( NYA can use TVOL as example.)
Code is small, cleaner and faster =) !
Cheers!
Any feedback will be welcome...
@XeL_Arjona

Volume SpikesPlots volume the same as the built-in indicator. However, this indicator colors the column according to its change relative to the previous column. In other words, this indicator displays a green column on increased volume and a red bar on decreased volume.

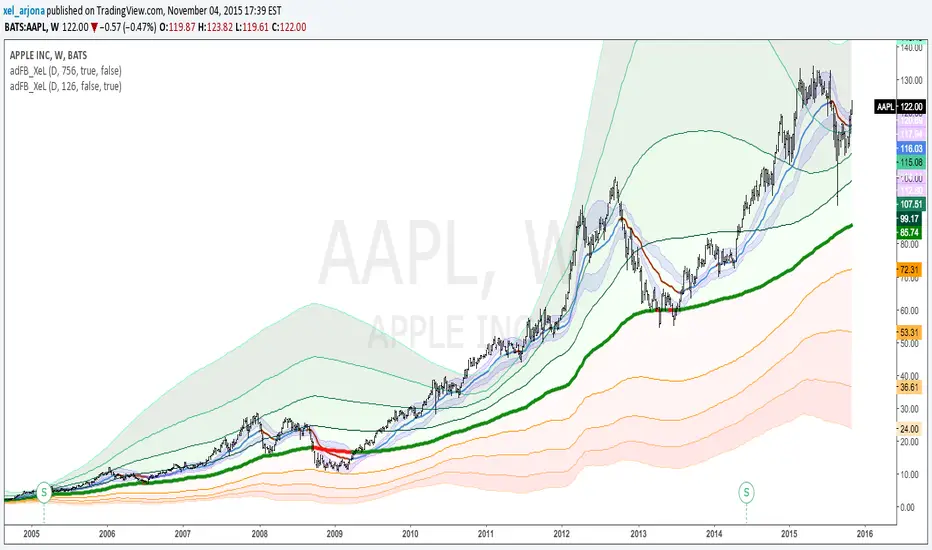
EVWMA Acc/Dist. Pressure & FRACTAL BANDS by @XeL_ArjonaEVWMA ACCUMULATION/DISTRIBUTION PRESSURE & FRACTAL BANDS
Version: 3.0 @ 4.11.2015
By Ricardo M Arjona @XeL_Arjona
DISCLAIMER:
The following indicator IS NOT INTENDED TO BE A FORMAL INVESTMENT ADVICE OR TRADING RECOMMENDATION BY THE AUTHOR, nor should be construed as such. Users will be fully responsible by their use regarding any kind of trading vehicles or assets.
The following script and ideas within this work are FREELY AND PUBLICLY availables on the Web for NON LUCRATIVE ACTIVITIES and must remain as is.
-== IMPORTANT: THIS IS AN EXPERIMENTAL INDICATOR ==-
What is this?
This work is a derivation of my previous Accumulation/Distribution scripts publicly available in TradingView in an effort to clean, speedup and make the indicator cleaner as possible.
The current indicator is based on already tested and Mathematically proof concepts as described below:
The MAIN Rolling back median line or "Vortex" is constructed by a simple and equal weighting of distributed volume along the candle range (This approach is just an "estimator" of Buyers Vs. Sellers given the lack of tick resolution in TradingView, a real "DELTA" can only be 100% reliable with Market Depth (Ask/Bid ticks)), Given this, with each "volume weights", the price is post-processed against a true statistical Average calculation formerly: ELASTIC VOLUME WEIGHTED MOVING AVERAGE.
The FRACTAL BANDS are just Standard Deviation's with GOLDEN RATIO as multiplier (1.618) derived one from each other within it's origin on the former "Vortex Median".
The Standard Error Bands comply as the original indicator described by Jon Andersen but given the true statistical nature of EVWMA, the original LinReg line has been substituted by the former.
ALL NEW IDEAS OR MODIFICATIONS to this indicator are welcome in favor to deploy a better technical tool. Any important addition to this work MUST REMAIN PUBLIC by means of CreativeCommons CC & TradingView user rules. (C) 2015 @XeL_Arjona
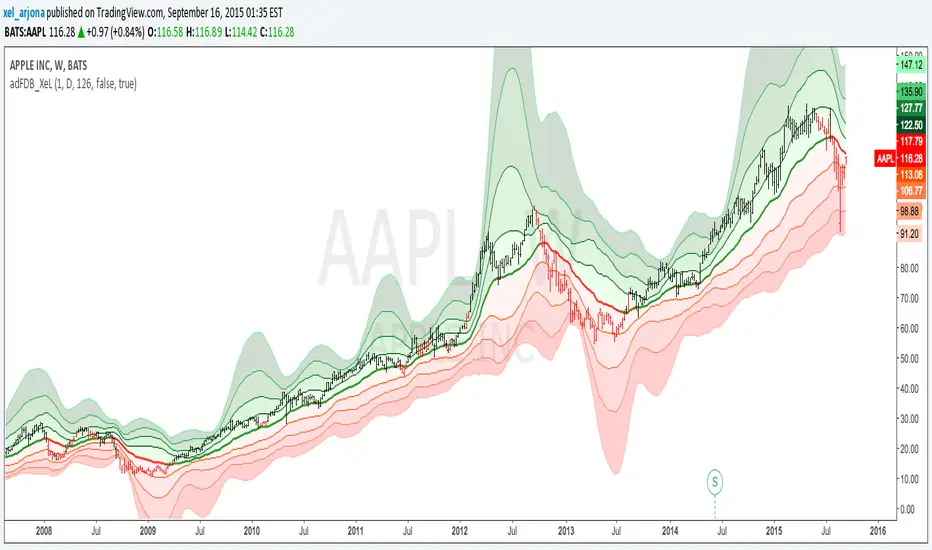
Acc/DistAMA with FRACTAL DEVIATION BANDS by @XeL_ArjonaACCUMULATION/DISTRIBUTION ADAPTIVE MOVING AVERAGE with FRACTAL DEVIATION BANDS
Ver. 2.5 @ 16.09.2015
By Ricardo M Arjona @XeL_Arjona
DISCLAIMER:
The Following indicator/code IS NOT intended to be a formal investment advice or recommendation by the
author, nor should be construed as such. Users will be fully responsible by their use regarding their own trading vehicles/assets.
The embedded code and ideas within this work are FREELY AND PUBLICLY available on the Web for NON LUCRATIVE ACTIVITIES and must remain as is.
Pine Script code MOD's and adaptations by @XeL_Arjona with special mention in regard of:
Buy (Bull) and Sell (Bear) "Power Balance Algorithm" by:
Stocks & Commodities V. 21:10 (68-72): "Bull And Bear Balance Indicator by Vadim Gimelfarb"
Fractal Deviation Bands by @XeL_Arjona.
Color Cloud Fill by @ChrisMoody
CHANGE LOG:
Following a "Fractal Approach" now the lookback window is hardcode correlated with a given timeframe. (Default @ 126 days as Half a Year / 252 bars)
Clean and speed up of Adaptive Moving Average Algo.
Fractal Deviation Band Cloud coloring smoothed.
>
ALL NEW IDEAS OR MODIFICATIONS to these indicator(s) are Welcome in favor to deploy a better and more accurate readings. I will be very glad to be notified at Twitter or TradingVew accounts at: @XeL_Arjona
Any important addition to this work MUST REMAIN PUBLIC by means of CreativeCommons CC & TradingView. Copyright 2015
Acc/Dist. Cloud with Fractal Deviation Bands by @XeL_ArjonaACCUMULATION / DISTRIBUTION CLOUD with MORPHIC DEVIATION BANDS
Ver. 2.0.beta.23:08:2015
by Ricardo M. Arjona @XeL_Arjona
DISCLAIMER
The Following indicator/code IS NOT intended to be a formal investment advice or recommendation by the author, nor should be construed as such. Users will be fully responsible by their use regarding their own trading vehicles/assets.
The embedded code and ideas within this work are FREELY AND PUBLICLY available on the Web for NON LUCRATIVE ACTIVITIES and must remain as is.
Pine Script code MOD's and adaptations by @XeL_Arjona with special mention in regard of:
Buy (Bull) and Sell (Bear) "Power Balance Algorithm by Vadim Gimelfarb published at Stocks & Commodities V. 21:10 (68-72).
Custom Weighting Coefficient for Exponential Moving Average (nEMA) adaptation work by @XeL_Arjona with contribution help from @RicardoSantos at TradingView @pinescript chat room.
Morphic Numbers (PHI & Plastic) Pine Script adaptation from it's algebraic generation formulas by @XeL_Arjona
Fractal Deviation Bands idea by @XeL_Arjona
CHANGE LOG:
ACCUMULATION / DISTRIBUTION CLOUD: I decided to change it's name from the Buy to Sell Pressure. The code is essentially the same as older versions and they are the center core (VORTEX?) of all derived New stuff which are:
MORPHIC NUMBERS: The "Golden Ratio" expressed by the result of the constant "PHI" and the newer and same in characteristics "Plastic Number" expressed as "PN". For more information about this regard take a look at: HERE!
CUSTOM(K) EXPONENTIAL MOVING AVERAGE: Some code has cleaned from last version to include as custom function the nEMA , which use an additional input (K) to customise the way the "exponentially" is weighted from the custom array. For the purpose of this indicator, I implement a volatility algorithm using the Average True Range of last 9 periods multiplied by the morphic number used in the fractal study. (Golden Ratio as default) The result is very similar in response to classic EMA but tend to accelerate or decelerate much more responsive with wider bars presented in trending average.
FRACTAL DEVIATION BANDS: The main idea is based on the so useful Standard Deviation process to create Bands in favor of a multiplier (As John Bollinger used in it's own bands) from a custom array, in which for this case is the "Volume Pressure Moving Average" as the main Vortex for the "Fractallitly", so then apply as many "Child bands" using the older one as the new calculation array using the same morphic constant as multiplier (Like Fibonacci but with other approach rather than %ratios). Results are AWSOME! Market tend to accelerate or decelerate their Trend in favor of a Fractal approach. This bands try to catch them, so please experiment and feedback me your own observations.
EXTERNAL TICKER FOR VOLUME DATA: I Added a way to input volume data for this kind of study from external tickers. This is just a quicky-hack given that currently TradingView is not adding Volume to their Indexes so; maybe this is temporary by now. It seems that this part of the code is conflicting with intraday timeframes, so You are advised.
This CODE is versioned as BETA FOR TESTING PROPOSES. By now TradingView Admins are changing lot's of things internally, so maybe this could conflict with correct rendering of this study with special tickers or timeframes. I will try to code by itself just the core parts of this study in order to use them at discretion in other areas. ALL NEW IDEAS OR MODIFICATIONS to these indicator(s) are Welcome in favor to deploy a better and more accurate readings. I will be very glad to be notified at Twitter or TradingView accounts at: @XeL_Arjona

Volume Pressure Composite Average with Bands by @XeL_ArjonaVOLUME PRESSURE COMPOSITE AVERAGE WITH BANDS
Ver. 1.0.beta.10.08.2015
By Ricardo M Arjona @XeL_Arjona
DISCLAIMER:
The Following indicator/code IS NOT intended to be a formal investment advice or recommendation by the author, nor should be construed as such. Users will be fully responsible by their use regarding their own trading vehicles/assets.
The embedded code and ideas within this work are FREELY AND PUBLICLY available on the Web for NON LUCRATIVE ACTIVITIES and must remain as is.
Pine Script code MOD's and adaptations by @XeL_Arjona with special mention in regard of:
Buy (Bull) and Sell (Bear) "Power Balance Algorithm" by :
Stocks & Commodities V. 21:10 (68-72):
"Bull And Bear Balance Indicator by Vadim Gimelfarb"
Adjusted Exponential Adaptation from original Volume Weighted Moving Average (VEMA) by @XeL_Arjona with help given at the @pinescript chat room with special mention to @RicardoSantos
Color Cloud Fill Condition algorithm by @ChrisMoody
WHAT IS THIS?
The following indicators try to acknowledge in a K-I-S-S approach to the eye (Keep-It-Simple-Stupid), the two most important aspects of nearly every trading vehicle: -- PRICE ACTION IN RELATION BY IT'S VOLUME --
A) My approach is to make this indicator both as a "Trend Follower" as well as a Volatility expressed in the Bands which are the weighting basis of the trend given their "Cross Signal" given by the Buy & Sell Volume Pressures algorithm. >
B) Please experiment with lookback periods against different timeframes. Given the nature of the Volume Mathematical Monster this kind of study is and in concordance with Price Action; at first glance I've noted that both in short as in long term periods, the indicator tends to adapt quite well to general price action conditions. BE ADVICED THIS IS EXPERIMENTAL!
C) ALL NEW IDEAS OR MODIFICATIONS to these indicator(s) are Welcome in favor to deploy a better and more accurate readings. I will be very glad to be notified at Twitter or TradingVew accounts at: @XeL_Arjona
Any important addition to this work MUST REMAIN PUBLIC by means of CreativeCommons CC & TradingView. --- All Authorship Rights RESERVED 2015 ---

BUY & SELL VOLUME PRESSURE by @XeL_ArjonaBUY & SELL PRICE TO VOLUME PRESSURE
By Ricardo M Arjona @XeL_Arjona
DISCLAIMER:
The Following indicator/code IS NOT intended to be a formal investment advice or recommendation by the author, nor should be construed as such. Users will be fully responsible by their use regarding their own trading vehicles/assets.
The embedded code and ideas within this work are FREELY AND PUBLICLY available on the Web for NON LUCRATIVE ACTIVITIES and must remain as is.
Pine Script code MOD's and adaptations by @XeL_Arjona with special mention in regard of:
Buy (Bull) and Sell (Bear) "Power Balance Algorithm" by: Stocks & Commodities V. 21:10 (68-72): "Bull And Bear Balance Indicator by Vadim Gimelfarb"
Normalisation (Filter) from Karthik Marar's VSA work: karthikmarar.blogspot.mx
Buy to Sell Convergence / Divergence and Volume Pressure Counterforce Histogram Ideas by: @XeL_Arjona
WHAT IS THIS?
The following indicators try to acknowledge in a K-I-S-S approach to the eye (Keep-It-Simple-Stupid), the two most important aspects of nearly every trading vehicle: -- PRICE ACTION IN RELATION BY IT'S VOLUME --
Volume Pressure Histogram: Columns plotted in positive are considered the dominant Volume Force for the given period. All "negative" columns represents the counterforce Vol.Press against the dominant.
Buy to Sell Convergence / Divergence: It's a simple adaptation of the popular "Price Percentage Oscillator" or MACD but taking Buying Pressure against Selling Pressure Averages, so given a Positive oscillator reading (>0) represents Bullish dominant Trend and a Negative reading (<0) a Bearish dominant Trend. Histogram is the diff between RAW Volume Pressures Convergence/Divergence minus Normalised ones (Signal) which helps as a confirmation.
Volume bars are by default plotted from RAW Volume Pressure algorithms, but they can be as well filtered with Karthik Marar's approach against a "Total Volume Average" in favor to clean day to day noise like HFT.
ALL NEW IDEAS OR MODIFICATIONS to these indicators are Welcome in favor to deploy a better and more accurate readings. I will be very glad to be notified at Twitter: @XeL_Arjona
Any important addition to this work MUST REMAIN PUBLIC by means of CreativeCommons CC & TradingView. -- 2015
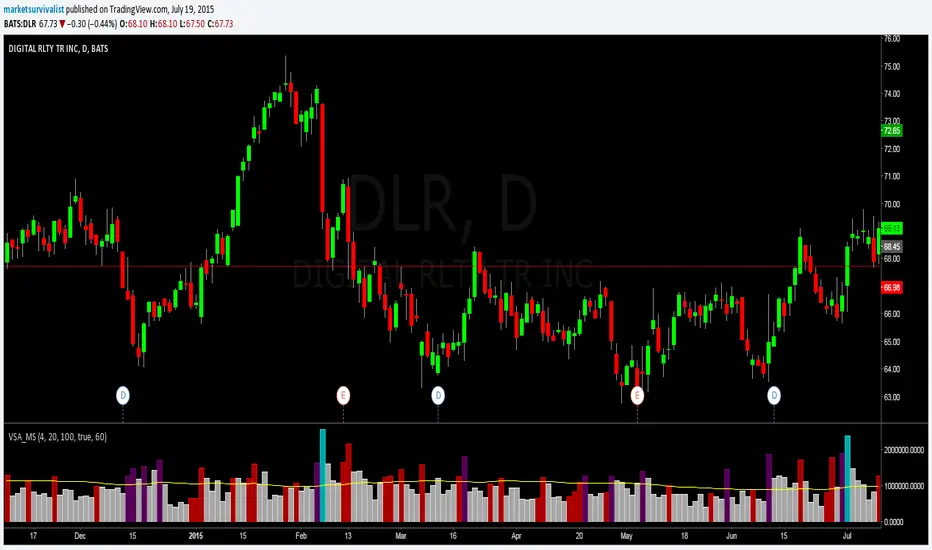
Volume Spike Analysis [marketsurvivalist]This indicator is based on the ideas about Volume Spike Analysis written about by Vincent Kott in his book Volume Spike Analysis. Formulas are presented in the book for another platform, but I wrote the script based on the charts he provided.
The indicator basically takes out the noise and colors bars based on factors of time and volume for day. There are three different time periods you can set: Short, Medium, Long. Each period can be set with a different color. The period value looks for highest volume bar within that period. If today's volume bar is the hightest value, it colors the volume bar based on the formatted color. It does not matter if the price bar is up or down. The defaults are 4 days, 20 days, 100 days. There is also a volume moving average available to show or hide based on you trading style.
The purpose is to easily see changes in volume. Typically, you would like to see volume rising as a new trend begins. This will show up quickly as you will see a cluster of rising red and / or purple bars.
Vol color barsHighlight bars according it's volume releative to near candles. This script usefull for VSA trading.
Red bar - extrime high volume
Orange bar - volume is high
Grayish bar - volume is normal
Green bar - volume is low
Blue bar - almost no volume
