FREEDOM - TJR Model\ FREEDOM – TJR Model\ 🚀
\ Automates TJR’s well-known NQ playbook with clean visuals, filters, and alerts—so you can focus on execution.\
\ Core idea\
1. Trade \ NQ\ in the \ New York session\ 🗽
2. Wait for a \ liquidity sweep\ of a \ prior session\ High/Low (Asia or London) ✂️
3. Confirm with \ SMT (NQ vs ES) divergence\ 🔀
4. Act on a \ proprietary entry signal\ 🔒
5. Risk at the swing 🛡️, target \ untapped internal/session liquidity\ 🎯
This indicator draws those session levels for you, tracks sweeps, detects SMT, applies higher-timeframe confluence, and fires alerts that respect your time window and filters.
---
\ What it draws & detects\
\ • Sessions & Liquidity Sweeps\ 🕒
* Plots \ Asia / London / New York\ session bands.
* On session close, it freezes the session’s \ High/Low\ as dotted “previous-session levels” and \ extends them forward\ until price \ crosses\ (choose \ Wicks\ or \ Close\ ).
* When price takes a previous-session \ High\ → \ Buyside sweep\ ; takes a \ Low\ → \ Sellside sweep\ .
* Optional \ Sweep Zones\ expand around the swept level using an \ ATR(21)\ margin; can auto-fade “fake” sweeps.
\ Tip: Keep “Extend previous session High/Low until cross” ON to maintain a clean roadmap into NY open.\
\ • SMT Divergence (NQ vs ES)\ 🔀
* Classic pivot-to-pivot SMT:
* \ Bearish SMT\ = NQ makes a \ higher high\ while ES does \ not\ .
* \ Bullish SMT\ = NQ makes a \ lower low\ while ES does \ not\ .
* Draws \ lines\ from pivot to pivot (no chart spam), with optional inline “SMT” label and optional confidence \ score\ (0–100) based on strength + recency.
* Context aware:
* Only shows \ Bearish SMT\ after a \ buy-side sweep\ (previous-session High taken).
* Only shows \ Bullish SMT\ after a \ sell-side sweep\ (previous-session Low taken).
* Respects your \ NY time window\ if enabled.
\ • Proprietary Entry Signals\ 🔒
* Prints entry lines + arrows only when your rules align (proprietary detection under the hood).
* Respects:
* \ Session-sweep bias\ (optional): Sells only after buy-side sweep; Buys only after sell-side sweep.
* \ Monotonic filter\ : new Sell must be \ higher\ than last Sell; new Buy must be \ lower\ than last Buy (resets each session).
* \ Minimum distance\ to nearest previous-session dotted level (in ticks).
* \ NY time filter\ window.
* \ HTF confluence\ (see below).
---
\ HTF Confluence (optional)\ 📈
* Choose \ MA slope\ (\ EMA/SMA/RMA/WMA\ ) or \ HH/HL structure\ on a higher timeframe (e.g., 60m/240m).
* Entry arrows and alerts can be gated so they only print when HTF bias agrees with the setup.
\ Tip: Start with EMA 50 on 60m for a smooth directional filter; add HH/HL only if you want stricter structure confirmation.\
---
\ Dashboard (bottom-right)\ 🧩
* \ VWAP state\ :
* \ Overbought\ (🔴) if close > VWAP + (mult × stdev)
* \ Oversold\ (🟢) if close < VWAP − (mult × stdev)
* Otherwise \ Neutral\ (⚪️)
* \ Premium / Discount\ vs previous-session 50% midline: Premium = above (red bias), Discount = below (green bias).
* \ SMT row\ : Bullish / Bearish / Neutral with optional score.
---
\ How to use the settings (quick tour)\
\ ENTRY\
* \ Entry Swing Length\ : lower = more signals.
* \ Confirmation\ : \ Candle Close\ or \ Wicks\ for breakout.
* \ Filter entry by session sweeps\ : enforces “sell after buy-side sweep, buy after sell-side sweep.”
* \ Minimum distance (ticks)\ : blocks entries too close to previous-session dotted levels.
* \ Replay mode\ : keeps entries visible in Bar Replay.
* \ NY Time filter\ : default \ 08:00–14:00 NY\ ; arrows/alerts respect the window.
* \ Arrow offset (ticks)\ : how far above/below the candle to plot the arrow.
\ SESSION SWEEPS\
* Toggle \ Buyside/Sellside zones\ , adjust \ ATR(21)\ margin & length.
* \ Hide Fake Sweep Zones\ (default ON).
* \ Extend H/L until cross\ (Wicks/Close).
* Optional \ daily reset\ for unswept dotted lines.
\ SESSIONS\
* Enable/disable \ Asia, London, NY AM, NY PM\ ; set start/end; choose color; extend midline if desired.
* DST toggles for NY/London.
\ HTF Confluence\
* Turn it ON/OFF; pick timeframe & method (MA slope or HH/HL); set MA type/length or swing length.
\ Dashboard\
* Show/hide table; set VWAP stdev length/multiplier.
* SMT settings: comparison symbol (\ default ES1!\ ), pivot length, show score/labels, recency window, etc.
\ Alerts\ (always last) 🔔
* \ Session line cross\ : choose Highs/Lows and crossing mode (\ Same as extension / Wicks / Close\ ).
* \ Entry alerts\ : \ Filtered / Unfiltered / Both\ .
* \ Filtered\ = respects sweep bias, HTF confluence, minimum distance, monotonic rule, and time window.
* \ Unfiltered\ = ignores sweep bias/HTF/monotonic (still respects minimum distance + time window).
* All entry alerts also respect the \ NY time window\ when enabled.
---
\ Suggested workflow\
* Open NQ on a 1–5m chart.
* Let the dotted \ previous-session H/L\ extend into NY; wait for a \ sweep\ .
* Check \ SMT\ : after buy-side sweep → look for \ bearish SMT\ ; after sell-side sweep → look for \ bullish SMT\ .
* Take the \ proprietary entry\ when filters agree.
* Stop at the swing; aim for \ untapped internal/session liquidity\ .
* Let \ alerts\ handle the monitoring.
---
\ Why traders like it\
* It mirrors the model popularized by \ TJR\ while removing the chart admin: sessions, sweeps, SMT, HTF gating, distances, monotonic sequencing, time windows, and ready-to-use alerts—so your execution stays consistent. ✨
---
\ Disclaimer\ ⚠️
\ This tool is for educational purposes only and does not constitute financial advice. Markets involve risk; always do your own research and test in replay/paper before trading live. FREEDOM – TJR Model is inspired by TJR’s publicly known framework but is not affiliated with, endorsed by, or sponsored by TJR. You are solely responsible for your trading decisions and outcomes.\
Volume Weighted Average Price (VWAP)

VWAP Multi-TimeframeThis is a multi-timeframe VWAP indicator that provides volume weighted average price calculations for the following time periods:
15min
30min
1H
2H
4H
6H
8H
12H
1D
1W
1M
3M
6M
1Y
You can use the lower timeframes for short term trend control areas and use the longer timeframes for long term trend control areas. Trade in the direction of the trend and watch for price reactions that you can trade when price gets close to or touches any of these levels.
This indicator will provide a data plot value of 1 for bullish when price is above all VWAPs that are turned on, -1 for bearish when price is below all VWAPs that are turned on and 0 for neutral when price is not above or below all VWAPs. Use this 1, -1, 0 value as a filter on your signal generating indicators so that you can prevent signals from coming in unless they are in the same direction as the VWAP trend.
Features
Trend direction value of 1, -1 or 0 to send to external indicators so you can filter your signal generating indicators using the VWAP trend.
Trend table that shows you whether price is above or below all of the major VWAPs. This includes the daily, weekly, monthly and yearly VWAPs.
Trend coloring between each VWAP and the close price of each candle so you can easily identify the trend direction.
Customization
Set the source value to use for all of the VWAP calculations. The default is HLC3.
Turn on or off each VWAP.
Change the color of each VWAP line.
Change the thickness of each VWAP line.
Turn on or off labels for each VWAP or turn all labels on or off at once.
Change the offset length from the current bar to the label text.
Change the label text color.
Turn on or off trend coloring for each VWAP.
Change the color for up trends and down trends.
Turn on or off the trend direction display table.
Change the location of the trend direction display table.
Adjust the background and text colors on the trend direction display table.
How To Use The Trend Direction Filtering Feature
The indicator will provide a data plot value of 1 for bullish when price is above all of the VWAPs that are turned on, a value of -1 for bearish when price is below all of the VWAPS that are turned on and a value of 0 for neutral when price is above and below some of the VWAPs that are turned on.
The name of the value to use with your external indicators will show up as: VWAP Multi-Timeframe: Trend Direction To Send To External Indicators
Make sure to use that as your source on your external indicators to get the correct values.
This 1, -1 or 0 value can then be used by another external indicator to tell the indicator what is allowed to do. For instance if you have another indicator that provides buy and sell signals, you can use this trend direction value to prevent your other indicator from giving a sell signal when the VWAP trend is bullish or prevent your other indicator from giving a buy signal when the VWAP trend is bearish.
You will need to program your other indicators to use this trend filtering feature, but this indicator is already set up with this filtering code so you can use it with any other indicator that you choose to filter(if you know how to customize pine script).
Markets You Can Use This Indicator On
This indicator uses volume and price to calculate values, so it will work on any chart that provides volume and price data.

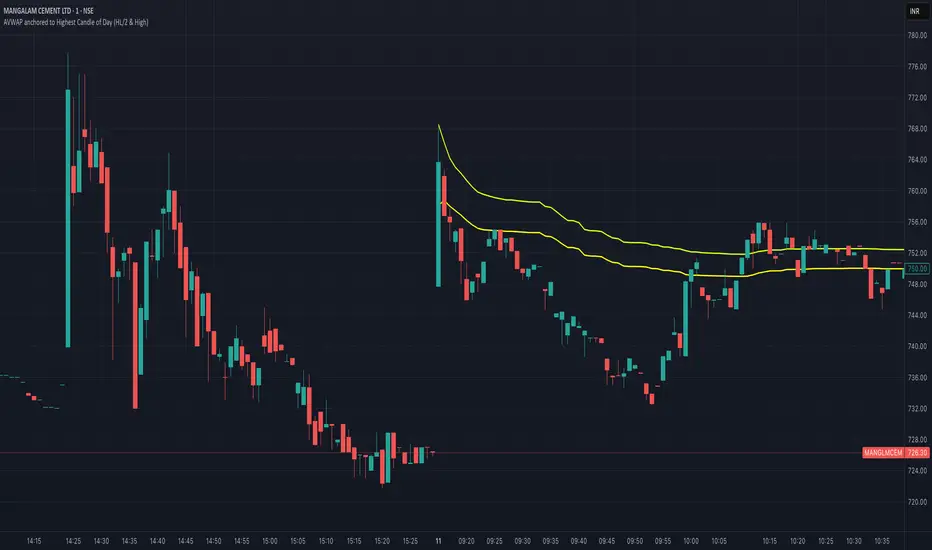
AVWAP from day's highThis indicator will automatically plot AVWAP from day's high candle.
formual will be HL/2 and H
Multiple Timeframe Rolling VWAPsThis indicator plots up to five customizable time-based Rolling Volume-Weighted Average Price (RVWAP) lines.
Each VWAP can be enabled or disabled and configured with a user-defined time period (days, hours, minutes) and minimum bars. It supports multi-timeframe analysis, allowing users to toggle between the current chart resolution and a custom timeframe (e.g., daily, weekly).
Ideal for traders analyzing volume-weighted price trends across multiple periods. Features include five independent VWAP lines with distinct colors, flexible time periods, and robust calculations. Ensure your chart has volume data for accurate results.

VWAP CALENDARThe VWAP CALENDAR indicator plots up to 20 anchored Volume-Weighted Average Price (VWAP) lines on your chart, each starting from a user-defined date and time (e.g., April 20, 2024). Designed for simplicity, it helps traders visualize VWAPs for key events or dates, with customizable labels and colors. The indicator is optimized for crypto markets (e.g., BTC/USD) but works with any symbol providing volume data.
Features: Multiple VWAPs: Configure up to 20 independent VWAPs, each with a custom anchor date and time.
Dynamic Labels: Labels update in real-time, aligning precisely with each VWAP line’s price level, positioned to the right of the chart for clarity.
Customizable Settings: Adjust label text (e.g., “Event A”), line colors, line widths (1–5 pixels), text colors, and text sizes (8–40 points, default 22).
Bubble or No-Background Labels: Choose between bubble-style labels (with colored backgrounds) or plain text labels without backgrounds.
Timeframe Support: Accurate on daily, 4-hour, 1-hour, and 30-minute charts for anchors within ~1.5 years (e.g., April 20, 2024, from August 2025).
Limitations: VWAP accuracy for anchors like April 20, 2024 (~477 days back) is reliable on 1-hour and larger timeframes. Below 30-minute (e.g., 15-minute, 24-minute), VWAPs may start later or be unavailable due to TradingView’s 5,000-bar historical data limit. For distant anchors, use 4-hour or daily charts to ensure accuracy.
Requires sufficient chart history (e.g., premium account or deep exchange data) for older anchors on 1-hour or 30-minute charts.
Usage Notes: Set anchor dates via the indicator settings (e.g., “2024-04-20 00:00”).
Enable/disable individual VWAPs as needed.
Zoom out to load maximum chart history for best results, especially on 1-hour or 30-minute timeframes.
Ideal for crypto symbols with continuous trading data, but verify data availability for other markets.
Disclaimer:
This is a free indicator provided as-is.
Clean Multi-Indicator Alignment System
Overview
A sophisticated multi-indicator alignment system designed for 24/7 trading across all markets, with pure signal-based exits and no time restrictions. Perfect for futures, forex, and crypto markets that operate around the clock.
Key Features
🎯 Multi-Indicator Confluence System
EMA Cross Strategy: Fast EMA (5) and Slow EMA (10) for precise trend direction
VWAP Integration: Institution-level price positioning analysis
RSI Momentum: 7-period RSI for momentum confirmation and reversal detection
MACD Signals: Optimized 8/17/5 configuration for scalping responsiveness
Volume Confirmation: Customizable volume multiplier (default 1.6x) for signal validation
🚀 Advanced Entry Logic
Initial Full Alignment: Requires all 5 indicators + volume confirmation
Smart Continuation Entries: EMA9 pullback entries when trend momentum remains intact
Flexible Time Controls: Optional session filtering or 24/7 operation
🎪 Pure Signal-Based Exits
No Forced Closes: Positions exit only on technical signal reversals
Dual Exit Conditions: EMA9 breakdown + RSI flip OR MACD cross + EMA20 breakdown
Trend Following: Allows profitable trends to run their full course
Perfect for Swing Scalping: Ideal for multi-session position holding
📊 Visual Interface
Real-Time Status Dashboard: Live alignment monitoring for all indicators
Color-Coded Candles: Instant visual confirmation of entry/exit signals
Clean Chart Display: Toggle-able EMAs and VWAP with professional styling
Signal Differentiation: Clear labels for entries, X-crosses for exits
🔔 Alert System
Entry Notifications: Separate alerts for buy/sell signals
Exit Warnings: Technical breakdown alerts for position management
Mobile Ready: Push notifications to TradingView mobile app
Market Applications
Perfect For:
Gold Futures (GC): 24-hour precious metals trading
NASDAQ Futures (NQ): High-volatility index scalping
Forex Markets: Currency pairs with continuous operation
Crypto Trading: 24/7 cryptocurrency momentum plays
Energy Futures: Oil, gas, and commodity swing trades
Optimal Timeframes:
1-5 Minutes: Ultra-fast scalping during high volatility
5-15 Minutes: Balanced approach for most markets
15-30 Minutes: Swing scalping for trend following
🧠 Smart Position Management
Tracks implied position direction
Prevents conflicting signals
Allows trend continuation entries
State-aware exit logic
⚡ Scalping Optimized
Fast-reacting indicators with shorter periods
Volume-based confirmation reduces false signals
Clean entry/exit visualization
Minimal lag for time-sensitive trades
Configuration Options
All parameters fully customizable:
EMA Lengths: Adjustable from 1-30 periods
RSI Period: 1-14 range for different market conditions
MACD Settings: Fast (1-15), Slow (1-30), Signal (1-10)
Volume Confirmation: 0.5-5.0x multiplier range
Visual Preferences: Colors, displays, and table options
Risk Management Features
Clear visual exit signals prevent emotion-based decisions
Volume confirmation reduces false breakouts
Multi-indicator confluence improves signal quality
Optional time filtering for session-specific strategies
Best Use Cases
Futures Scalping: NQ, ES, GC during active sessions
Forex Swing Trading: Major pairs during overlap periods
Crypto Momentum: Bitcoin, Ethereum trend following
24/7 Automated Systems: Algorithmic trading implementation
Multi-Market Scanning: Portfolio-wide signal monitoring

Swing Anchored Vwap [BigBeluga]🔵 OVERVIEW
Swing Anchored Vwap tracks the market’s directional behavior by anchoring VWAPs (Volume Weighted Average Price) to dynamically detected swing highs and lows. It visually distinguishes the active swing VWAP from historical ones—offering traders a clean view of trend-aligned value zones with clearly marked inflection points.
🔵 CONCEPTS
Swing Anchored VWAPs: VWAPs are initiated from recent swing highs during downtrends and swing lows during uptrends.
Trend Detection: The indicator identifies trend shifts based on the breaking of recent highest or lowest price value.
Trend-Based Coloring:
• Green VWAPs: are drawn from swing lows in uptrends.
• Blue VWAPs: are drawn from swing highs in downtrends.
Sensitivity Control: The Length input defines how far back the script looks to determine swing points—shorter lengths make it more reactive.
🔵 FEATURES
Real-time VWAP projection from the current swing point, updated live.
Historical VWAP traces with slightly faded color to emphasize the current active one.
Swing markers automatically placed on highs/lows where VWAPs are anchored.
Label with price value at the end of each active VWAP line for clarity.
Adaptive color scheme that visually separates uptrend/downtrend zones.
🔵 HOW TO USE
Use active VWAP as a dynamic support/resistance guide during ongoing trends.
Observe breaks or rejections around these VWAPs for trend continuation or reversal clues .
Compare current price position relative to swing VWAPs to assess trend maturity and extension .
Combine with volume analysis or structure to increase conviction at swing points.
🔵 CONCLUSION
Swing Anchored Vwap merges the logic of anchored VWAPs and swing structure into a responsive visual tool. It helps traders stay aligned with the current trend while offering historical context via previous value anchors—ideal for intraday to swing-level analysis.

Trader's Club IndicatorTrader’s Club Indicator
The Trader’s Club Indicator is an advanced confluence-based tool combining Bollinger Bands , Relative Strength Index (RSI) , VWAP with multi-band overlays , and an intelligent chained divergence detection engine. It identifies potential buy/sell setups by aligning price extremes with momentum shifts and volume-weighted trends. The “E” signal highlights enhanced entry opportunities based on RSI divergence and price candle behaviour — offering a timing edge for informed traders.
TRADING METHOD
This indicator works best on 1-Minute candles. Tested it successfully on XAUUSD.
Buy signal: 'E' in a Blue box.
Sell signal: 'E' in a Red box.
Chained Divergence: White dot on the top or bottom of a candle. This shows possibility of a reversal from that zone.
Use the Buy/Sell signals in conjunction with the VWAP levels. If the Buy/Sell Signals form at VWAP and a key support/resistance level, that is an additional confluence.
Disclaimer
This indicator is for informational and educational purposes only. Trading involves risk, and you are solely responsible for your decisions. Do not rely solely on the buy/sell ‘E’ signals — it’s crucial to use additional confirmation, context, and personal judgment before placing trades. Always practice proper risk management and consider combining this indicator with broader technical or fundamental confluences.

Ultimate Scalping Strategy v2Strategy Overview
This is a versatile scalping strategy designed primarily for low timeframes (like 1-min, 3-min, or 5-min charts). Its core logic is based on a classic EMA (Exponential Moving Average) crossover system, which is then filtered by the VWAP (Volume-Weighted Average Price) to confirm the trade's direction in alignment with the market's current intraday sentiment.
The strategy is highly customizable, allowing traders to add layers of confirmation, control trade direction, and manage exits with precision.
Core Strategy Logic
The strategy's entry signals are generated when two primary conditions are met simultaneously:
Momentum Shift (EMA Crossover): It looks for a crossover between a fast EMA (default length 9) and a slow EMA (default length 21).
Buy Signal: The fast EMA crosses above the slow EMA, indicating a potential shift to bullish momentum.
Sell Signal: The fast EMA crosses below the slow EMA, indicating a potential shift to bearish momentum.
Trend/Sentiment Filter (VWAP): The crossover signal is only considered valid if the price is on the "correct" side of the VWAP.
For a Buy Signal: The price must be trading above the VWAP. This confirms that, on average, buyers are in control for the day.
For a Sell Signal: The price must be trading below the VWAP. This confirms that sellers are generally in control.
Confirmation Filters (Optional)
To increase the reliability of the signals and reduce false entries, the strategy includes two optional confirmation filters:
Price Action Filter (Engulfing Candle): If enabled (Use Price Action), the entry signal is only valid if the crossover candle is also an "engulfing" candle.
A Bullish Engulfing candle is a large green candle that completely "engulfs" the body of the previous smaller red candle, signaling strong buying pressure.
A Bearish Engulfing candle is a large red candle that engulfs the previous smaller green candle, signaling strong selling pressure.
Volume Filter (Volume Spike): If enabled (Use Volume Confirmation), the entry signal must be accompanied by a surge in volume. This is confirmed if the volume of the entry candle is greater than its recent moving average (default 20 periods). This ensures the move has strong participation behind it.
Exit Strategy
A position can be closed in one of three ways, creating a comprehensive exit plan:
Stop Loss (SL): A fixed stop loss is set at a level determined by a multiple of the Average True Range (ATR). For example, a 1.5 multiplier places the stop 1.5 times the current ATR value away from the entry price. This makes the stop dynamic, adapting to market volatility.
Take Profit (TP): A fixed take profit is also set using an ATR multiplier. By setting the TP multiplier higher than the SL multiplier (e.g., 2.0 for TP vs. 1.5 for SL), the strategy aims for a positive risk-to-reward ratio on each trade.
Exit on Opposite Signal (Reversal): If enabled, an open position will be closed automatically if a valid entry signal in the opposite direction appears. For example, if you are in a long trade and a valid short signal occurs, the strategy will exit the long position immediately. This feature turns the strategy into more of a reversal system.
Key Features & Customization
Trade Direction Control: You can enable or disable long and short trades independently using the Allow Longs and Allow Shorts toggles. This is useful for trading in harmony with a higher-timeframe trend (e.g., only allowing longs in a bull market).
Visual Plots: The strategy plots the Fast EMA, Slow EMA, and VWAP on the chart for easy visualization of the setup. It also plots up/down arrows to mark where valid buy and sell signals occurred.
Dynamic SL/TP Line Plotting: A standout feature is that the strategy automatically draws the exact Stop Loss and Take Profit price lines on the chart for every active trade. These lines appear when a trade is entered and disappear as soon as it is closed, providing a clear visual of your risk and reward targets.
Alerts: The script includes built-in alertcondition calls. This allows you to create alerts in TradingView that can notify you on your phone or execute trades automatically via a webhook when a long or short signal is generated.

4 Anchored VWAPs This indicator shows 4 periods of Anchored VWAPs according to specific dates the user chose.

Previous VWAP Levels by Riotwolftrading The "Previous VWAP" indicator calculates and displays the previous session's Volume Weighted Average Price (VWAP) for five timeframes (Daily, Weekly, Monthly, Quarterly, Yearly).
Each VWAP is plotted as a horizontal line extending to the right edge of the chart, with customizable labels at the right to identify each level. The indicator is designed for traders who want to visualize key price levels from prior periods without cluttering the chart with current VWAPs or additional metrics like standard deviations.
**Functionality**:
- **Calculates Previous VWAPs**: Computes the VWAP for the previous session of each timeframe (Daily, Weekly, Monthly, Quarterly, Yearly) based on the input source (default: `hlc3`) and volume.
- **Visual Style** : Uses `line.new` to draw horizontal lines from five bars back to the current bar, ensuring the lines extend to the right edge of the chart. Labels are placed at the right edge using `label.new` for clear identification.
- **Customization** : Allows users to toggle visibility, adjust line styles, widths, colors, and label sizes, and choose between abbreviated or full label text.
- **Minimalist Design**: Focuses solely on previous VWAPs, omitting current VWAPs, rolling VWAPs, and standard deviation bands to keep the chart clean.
**Intended Use**: This indicator is useful for traders who rely on historical VWAP levels as support/resistance or reference points for trading decisions, particularly in strategies involving mean reversion or breakout trading.
---
### Rules and Features
*VWAP Calculation**:
- The VWAP is calculated as the cumulative sum of price (`src`) multiplied by volume (`sumSrcVol`) divided by the cumulative volume (`sumVol`) for each timeframe.
- The "previous VWAP" is the VWAP value from the prior session, captured when a new session begins (e.g., new day, week, month, etc.).
- The indicator uses the `hlc3` (average of high, low, close) as the default source, but users can modify this in the settings.
**Timeframes**:
- **Daily**: Previous day's VWAP.
- **Weekly**: Previous week's VWAP.
- **Monthly**: Previous month's VWAP.
- **Quarterly**: Previous quarter's VWAP (3 months).
- **Yearly**: Previous year's VWAP (12 months).
- New sessions are detected using `ta.change(time(period))` for each timeframe.
**Line Drawing**:
- Lines are drawn using `line.new` from `time ` (five bars back) to the current bar (`time`), ensuring they extend to the right edge of the chart.
- Lines are updated only on the last confirmed bar (`barstate.islast`) to optimize performance and avoid repainting.
- Previous lines are deleted (`line.delete`) to prevent overlapping or clutter.
**Labels**:
- Labels are drawn at the right edge (`x=time`, `xloc=xloc.bar_time`) with `label.new`.
- Users can choose between abbreviated labels (e.g., "pvD" for Previous Daily VWAP) or full labels (e.g., "Prev Daily VWAP").
- Label sizes are customizable (`tiny`, `small`, `normal`, `large`, `huge`).
- Labels are deleted (`label.delete`) on each update to maintain a clean chart.
5. **Customization Options**:
- **Visibility**: Toggle each VWAP (Daily, Weekly, Monthly, Quarterly, Yearly) on or off.
- **Colors**: Individual color settings for each VWAP line and label (default colors: Daily=#E12D7B, Weekly=#F67B52, Monthly=#EDCD3B, Quarterly=#3BBC54, Yearly=#2665BD).
- **Line Style**: Choose from `solid`, `dotted`, or `dashed` lines.
- **Line Width**: Adjustable from 1 to 4 pixels.
- **Label Settings**: Enable/disable labels, abbreviate text, and select label size.
- **Source**: Customize the price source (default: `hlc3`).
**Performance Optimization**:
- The indicator only updates lines and labels on the last confirmed bar to minimize computational overhead.
- Uses `var` to initialize variables and avoid unnecessary recalculations.
- Deletes previous lines and labels to prevent chart clutter.
---
### Usage Instructions
1. **Add to Chart**:
- In TradingView, go to the Pine Editor, paste the script, and click "Add to Chart."
- The indicator will overlay on the price chart, showing previous VWAP lines and labels.
2. **Configure Settings**:
- Open the indicator settings to customize:
- Toggle visibility of each VWAP timeframe.
- Adjust colors, line style, and width.
- Enable/disable labels, choose abbreviation, and set label size.
- Modify the source if needed (e.g., use `close` instead of `hlc3`).
3. **Interpretation**:
- **Previous VWAPs**: Act as dynamic support/resistance levels based on the prior session's volume-weighted price.
- **Timeframes**: Use shorter timeframes (Daily, Weekly) for intraday/swing trading, and longer timeframes (Monthly, Quarterly, Yearly) for positional trading.
- **Labels**: Identify each VWAP level at the right edge of the chart for quick reference.
4. **Best Practices**:
- Use on charts with sufficient volume data, as VWAP relies on volume (a warning is triggered if no volume data is available).
- Combine with other indicators (e.g., moving averages, RSI) for confirmation in trading strategies.
- Adjust line styles and colors to avoid visual overlap with other chart elements.
---
### Example Use Case
A trader using a 1-hour chart can add the "Previous VWAP" indicator to identify key levels from the prior day, week, or month. For example:
- The Previous Daily VWAP might act as a support level for a bullish trend.
- The Previous Weekly VWAP could serve as a target for a swing trade.
- Labels at the right edge make it easy to identify these levels without cluttering the chart.
This indicator provides a clean, customizable way to visualize previous VWAPs, making it ideal for traders who want historical price context with minimal chart noise. For the complete Pine Script code, refer to the artifact provided in the previous response.

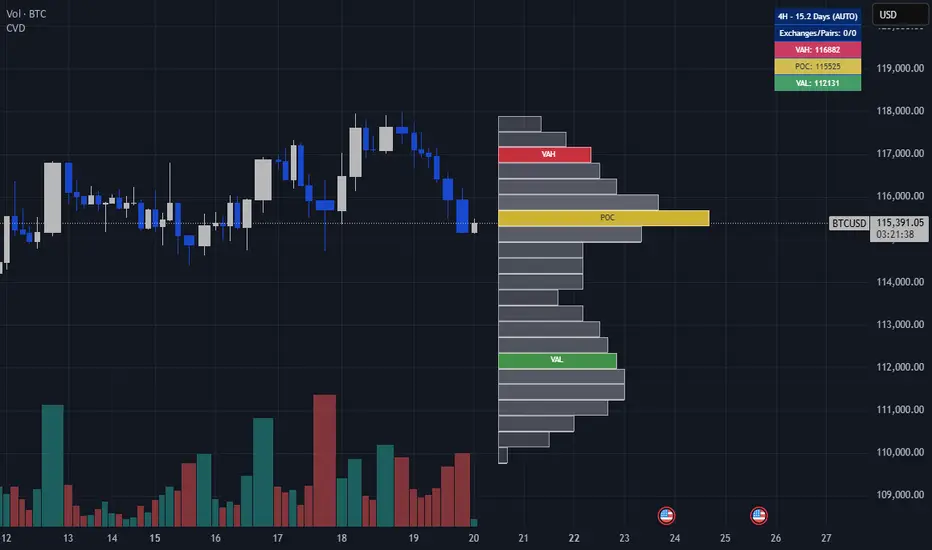
Crypto Volume Data (VAH,POC,VAL)Crypto Volume Data (VAH, POC, VAL) — Multi-Exchange Aggregated Volume Zones
This indicator delivers a high-precision volume profile for crypto assets by aggregating real traded volume across Binance, Bybit, Coinbase, Kraken, OKX, and MEXC. It auto-detects multiple quote pairs (USD, USDT, USDC, FDUSD, USDT.P, USDC.P) and merges the live volume distribution respecting each exchange’s volume for that symbol to calculate institutional-grade VAH, POC, and VAL levels.
No matter which symbol or pair from which exchange is open on the chart, the script dynamically detects the base asset and fetches volume from all matching pairs on supported exchanges. For example, whether you load BTC/USDT, ETH/USDT.P, or SOL/FDUSD, the system identifies the symbol and aggregates volume from all relevant pairs of that symbol across all mentioned exchanges, weighting them based on real volume. This leads to significantly more accurate value areas — especially compared to single-source or single-pair profiles that miss fragmented liquidity and the real volume of each exchange.
This script is fully plug-and-play. There’s no need to select lookback windows or configure pairs — it's already optimized with pre-set internal parameters for common trading timeframes. (Still, you can adjust for your needs in the settings, but keep in mind more lookback is not necessarily a good thing — it might affect the accuracy of your output depending on the timeframe.)
Key Features:
Live aggregation of volume across 5 exchanges
Supports most listed altcoins with reliable quote pair coverage
Dynamic auto symbol/quote detection and normalization
Automatically adapts to any crypto chart without user setup
Real institutional zones — not synthetic, not heuristic
Why It Matters:
In fragmented crypto markets, liquidity isn’t centralized. Volume for a coin like ETH may be split between USDT on Binance, USD on Kraken, or USDC on MEXC. Most indicators ignore that. This tool doesn’t. It brings that volume together to provide the most contextually accurate VAH/POC/VAL levels possible, tailored to the charted asset and timeframe.
This isn't just another volume indicator. It’s built from the ground up to capture where the real trades happen — not just where price moved — and shows you the zones that institutions and large players respect.
Disclaimer:
This tool is for educational and informational purposes only. It does not constitute financial advice or an invitation to trade. Always do your own research and manage risk responsibly.
Credits:
Volume unification logic, cross-pair normalization, and exchange weighting system developed by me. No third-party libraries or reused scripts involved. Original architecture built from scratch for high-resolution crypto volume profile analysis.
Note:
Script designed to respect TradingView limits for both free and paid accounts, with a smart fallback system in case of hitting the limit. If you find any bug, error, or issue, kindly comment below. I will address and fix them ASAP.
Enjoy and cheers.
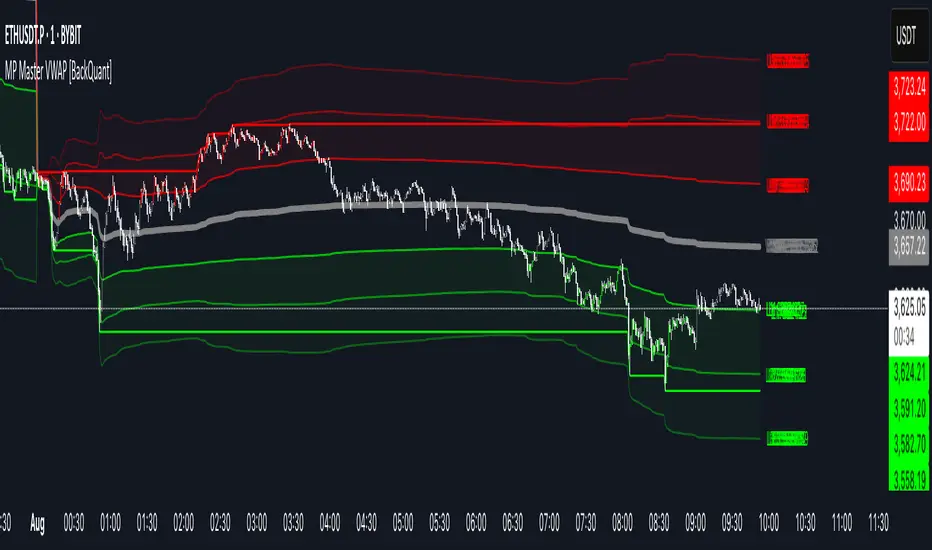
MP Master VWAP [BackQuant]MP Master VWAP
Overview
MP Master VWAP is an, volume-weighted average price suite. It re-anchors automatically to any time partition you select—Day, Week, Month, Quarter or Year—and builds an adaptive standard-deviation envelope, optional pivot clusters and context-aware candle colouring so you can read balance, imbalance and auction edges in a single glance. We use private methods on calculating key levels, making them adaptive and more responsive. This is not just a plain VWAP.
Key Components
• Anchored VWAP core – The engine resets VWAP the instant a new session for the chosen anchor begins. Separator lines and a live high–low box make those rotations obvious.
• Dynamic sigma bands – Three upper and three lower bands, scaled by real-time standard deviation. 1-σ filters noise, 2-σ marks momentum, 3-σ flags exhaustion.
• Previous-period memory – The prior session’s VWAP and bands stay on-screen in a muted style so you can trade retests of last month’s value without clutter.
• High-precision price labels – VWAP and every active band print their prices on the hard right edge; labels vanish if you want a cleaner chart.
• Pivot package – Choose Traditional, Fibonacci or Camarilla calculations on a Daily, Weekly or Monthly look-back. Levels plot as subtle circles that complement, not compete with, the VWAP map.
• Context candles – Bars tint relative to their location: vivid red above U2, soft red between U1-U2, neutral grey inside value, soft green between L2-L1, vivid green below L2.
Customisation Highlights
Period section
• Anchor reset drop-down
• Toggles for separator lines and period high/low
Band section
• Independent visibility for L1/U1, L2/U2, L3/U3
• Individual multipliers to fit any volatility profile
• Optional real-time price labels
Pivot section
• Three formula choices
• Independent timeframe—mix a Monthly VWAP with Weekly Camarilla for confluence
Visual section
• Separate switches for current vs previous envelopes
• Candle-colour toggle for traders who prefer raw price bars
Colour section
• Full palette selectors to match dark or light themes instantly
Some Potential Ways it can be used:
Mean-reversion fade – Price spikes into U2 or U3 and stalls (especially at a pivot). Fade back toward VWAP; scale out at U1 and VWAP.
Trend continuation – Close above U1 on rising volume; trail a stop behind U1. Mirror setup for shorts under L1.
Breakout validation – Session gaps below previous VWAP but quickly reclaims it. Use the cross-above alert to automate entry and target U1 / U2.
Overnight inventory flush – Globex extremes that tag L2 / U2 often reverse at the cash open; scalp rotations back to VWAP.
Risk framing – Let the gap between VWAP and L2 / U2 dictate position size, keeping reward-to-risk consistent across assets.
Alerts Included
• Cross above / below current VWAP
• Cross first sigma bands (U1 / L1)
• Break above second sigma bands (U2) or below L2
• Touch of third sigma bands (U3 / L3)
• Cross of previous-period VWAP
• New period high or low
Best Practices
• Tighten sigma multipliers on thin-liquidity symbols; widen them on index futures or high-cap crypto.
• Pair the envelope with order-flow or footprint tools to confirm participation at band edges.
• On intraday charts, anchor a higher-timeframe VWAP (e.g., Monthly on a 15-minute) to reveal institutional accumulation.
• Treat the previous period’s VWAP as yesterday’s fair value—gaps that never revisit it often morph into trend days.
Final Notes
MP Master VWAP condenses auction-market theory into one readable overlay: automatic period resets, adaptive deviation bands, historical memory, multi-style pivots and self-explanatory colour coding. You can deploy it on equities, futures, crypto or FX—wherever volume meets time, VWAP remains the benchmark of true price discovery.
Trading Path
Below indicator are combined in them.
POI
VOLUME FVG
ORDER BLOCKS
VWAP
200 EMA HIGH
PIVOT
VWAP Multi-Period with SD & Value ZonesVWAP Multi-Period with SD & Value Zones
A dynamic VWAP indicator that works on Weekly, Monthly, Quarterly (3M) and Yearly (12M) timeframes.
VWAP line: true volume-weighted average price
±1, ±2, ±3 SD bands: volume-weighted volatility levels
Value Zone: filled area between ±1 SD
Prior Value Zone: last period’s ±1 SD area extended into the new period
Usage: Add to chart, select your period (W/M/3M/12M), and use the bands and zones as volume-weighted support/resistance and risk boundaries.
Demander à ChatGPT

SwingTrade ADX Strategy v6This is a swing trading strategy that combines VWAP (Volume Weighted Average Price), ADX (Average Directional Index) for trend strength, and volume ratios to generate long/short entry and exit signals. It's designed for daily charts but can be adapted.
#### Key Features:
- **Entries**: Based on VWAP crossovers, rising/falling delta (price deviation from VWAP), ADX trend confirmation, and volume ratios.
- **Exits**: Dynamic exits when VWAP delta reverses after a peak.
- **Filters**: Optional toggles for VWAP signals, ADX, and volume. Backtest date range for custom periods.
- **Visuals**: VWAP line, signal shapes/labels, and an info panel showing key metrics (VWAP Delta %, ADX, Volume Ratio).
- **Alerts**: Built-in alerts for buy/sell entries and exits.
#### How to Use:
1. Apply to your chart (e.g., stocks, forex, crypto).
2. Adjust parameters in the settings (e.g., ADX threshold, volume period).
3. Enable/disable indicators as needed.
4. Backtest using the date filters and review equity curve.
**Disclaimer**: This is for educational purposes only. Past performance is not indicative of future results. Not financial advice—trade at your own risk. Backtest thoroughly and use with proper risk management.
Feedback welcome! If you find it useful, give it a like.

Anti Nyangkut – Indikator Karya Anak Bangsa Anti Nyangkut – Indikator Karya Anak Bangsa
Indikator ini khusus buat kamu yang sering beli di pucuk dan jual di support, lalu akhirnya jadi bahan backtest orang lain.
💡 Sinyal buy only - muncul kalau harga udah:
✅ Di atas MA5
✅ Di atas Bollinger Bands Upper
✅ Di atas VWAP (khusus 1H & 4H)
🟢 TP dan SL otomatis muncul — biar gak cuma "niat hold sampe hijau"
📊 Cocok buat scalping & swing di 1H / 4H / 1D
Gak ada sinyal jual. Exit di tangan masing-nasing, jangan lupa pasang SL.
—
100% gratis. Bayarnya pakai amal jariyah.
—
Anti Nyangkut – An Indicator by the People, for the People
This one's for you if you always buy the top, sell the bottom, and end up becoming someone else's backtest data.
💡 Buy-Only Signals — triggered when price is:
✅ Above MA5
✅ Above Bollinger Bands Upper
✅ Above VWAP (on 1H & 4H only)
🟢 Auto TP & SL lines — so you stop saying "I'll hold until it turns green"
📊 Perfect for scalping & swing trades on 1H / 4H / 1D
There’s no sell signal. Exits are your responsibility — just don’t skip the stop loss.
—
100% free. Just pay with good karma.

RSI WMA VWMA Divergence Indicator// This Pine Script® code is subject to the terms of the Mozilla Public License 2.0 at mozilla.org
// © Kenndjk
//@version=6
indicator(title="RSI WMA VWMA Divergence Indicator", shorttitle="Kenndjk", format=format.price, precision=2)
oscType = input.string("RSI", "Oscillator Type", options = , group="General Settings")
// RSI Settings
rsiGroup = "RSI Settings"
rsiLengthInput = input.int(14, minval=1, title="RSI Length", group=rsiGroup)
rsiSourceInput = input.source(close, "Source", group=rsiGroup)
// WMA VWMA
wmaLength = input.int(9, "WMA Length", minval=1, group="WMA Settings")
vwmaLength = input.int(3, "VWMA Length", minval=1, group="WMA Settings")
wma = ta.wma(close, wmaLength)
vwma = ta.vwma(close, vwmaLength)
useVWMA = input.bool(true, "Use VWMA for Divergence (when WMA + VWMA mode)", group="WMA Settings")
// Oscillator selection
rsi = ta.rsi(rsiSourceInput, rsiLengthInput) // Calculate RSI always, but use conditionally
osc = oscType == "RSI" ? rsi : useVWMA ? vwma : wma
// RSI plots (conditional)
isRSI = oscType == "RSI"
rsiPlot = plot(isRSI ? rsi : na, "RSI", color=isRSI ? #7E57C2 : na)
rsiUpperBand = hline(isRSI ? 70 : na, "RSI Upper Band", color=isRSI ? #787B86 : na)
midline = hline(isRSI ? 50 : na, "RSI Middle Band", color=isRSI ? color.new(#787B86, 50) : na)
rsiLowerBand = hline(isRSI ? 30 : na, "RSI Lower Band", color=isRSI ? #787B86 : na)
fill(rsiUpperBand, rsiLowerBand, color=isRSI ? color.rgb(126, 87, 194, 90) : na, title="RSI Background Fill")
midLinePlot = plot(isRSI ? 50 : na, color = na, editable = false, display = display.none)
fill(rsiPlot, midLinePlot, 100, 70, top_color = isRSI ? color.new(color.green, 0) : na, bottom_color = isRSI ? color.new(color.green, 100) : na, title = "Overbought Gradient Fill")
fill(rsiPlot, midLinePlot, 30, 0, top_color = isRSI ? color.new(color.red, 100) : na, bottom_color = isRSI ? color.new(color.red, 0) : na, title = "Oversold Gradient Fill")
// WMA VWMA plots
wmaColor = oscType != "RSI" ? (useVWMA ? color.new(color.blue, 70) : color.blue) : na
wmaWidth = useVWMA ? 1 : 2
vwmaColor = oscType != "RSI" ? (useVWMA ? color.orange : color.new(color.orange, 70)) : na
vwmaWidth = useVWMA ? 2 : 1
plot(oscType != "RSI" ? wma : na, "WMA", color=wmaColor, linewidth=wmaWidth)
plot(oscType != "RSI" ? vwma : na, "VWMA", color=vwmaColor, linewidth=vwmaWidth)
// Smoothing MA inputs (only for RSI)
GRP = "Smoothing (RSI only)"
TT_BB = "Only applies when 'Show Bollinger Bands' is selected. Determines the distance between the SMA and the bands."
maLengthSMA = input.int(14, "SMA Length", minval=1, group=GRP, display=display.data_window)
maLengthEMA = input.int(14, "EMA Length", minval=1, group=GRP, display=display.data_window)
maLengthRMA = input.int(14, "SMMA (RMA) Length", minval=1, group=GRP, display=display.data_window)
maLengthWMA = input.int(14, "WMA Length", minval=1, group=GRP, display=display.data_window)
maLengthVWMA = input.int(14, "VWMA Length", minval=1, group=GRP, display=display.data_window)
bbMultInput = input.float(2.0, "BB StdDev", minval=0.001, maxval=50, step=0.5, tooltip=TT_BB, group=GRP, display=display.data_window)
showSMA = input.bool(false, "Show SMA", group=GRP)
showEMA = input.bool(false, "Show EMA", group=GRP)
showRMA = input.bool(false, "Show SMMA (RMA)", group=GRP)
showWMAsmooth = input.bool(false, "Show WMA", group=GRP)
showVWMAsmooth = input.bool(false, "Show VWMA", group=GRP)
showBB = input.bool(false, "Show SMA + Bollinger Bands", group=GRP, tooltip=TT_BB)
// Smoothing MA Calculations
sma_val = (showSMA or showBB) and isRSI ? ta.sma(rsi, maLengthSMA) : na
ema_val = showEMA and isRSI ? ta.ema(rsi, maLengthEMA) : na
rma_val = showRMA and isRSI ? ta.rma(rsi, maLengthRMA) : na
wma_val = showWMAsmooth and isRSI ? ta.wma(rsi, maLengthWMA) : na
vwma_val = showVWMAsmooth and isRSI ? ta.vwma(rsi, maLengthVWMA) : na
smoothingStDev = showBB and isRSI ? ta.stdev(rsi, maLengthSMA) * bbMultInput : na
// Smoothing MA plots
plot(sma_val, "RSI-based SMA", color=(showSMA or showBB) ? color.yellow : na, display=(showSMA or showBB) ? display.all : display.none, editable=(showSMA or showBB))
plot(ema_val, "RSI-based EMA", color=showEMA ? color.purple : na, display=showEMA ? display.all : display.none, editable=showEMA)
plot(rma_val, "RSI-based RMA", color=showRMA ? color.red : na, display=showRMA ? display.all : display.none, editable=showRMA)
plot(wma_val, "RSI-based WMA", color=showWMAsmooth ? color.blue : na, display=showWMAsmooth ? display.all : display.none, editable=showWMAsmooth)
plot(vwma_val, "RSI-based VWMA", color=showVWMAsmooth ? color.orange : na, display=showVWMAsmooth ? display.all : display.none, editable=showVWMAsmooth)
bbUpperBand = plot(showBB ? sma_val + smoothingStDev : na, title="Upper Bollinger Band", color=showBB ? color.green : na, display=showBB ? display.all : display.none, editable=showBB)
bbLowerBand = plot(showBB ? sma_val - smoothingStDev : na, title="Lower Bollinger Band", color=showBB ? color.green : na, display=showBB ? display.all : display.none, editable=showBB)
fill(bbUpperBand, bbLowerBand, color=showBB ? color.new(color.green, 90) : na, title="Bollinger Bands Background Fill", display=showBB ? display.all : display.none, editable=showBB)
// Divergence Settings
divGroup = "Divergence Settings"
calculateDivergence = input.bool(true, title="Calculate Divergence", group=divGroup, tooltip = "Calculating divergences is needed in order for divergence alerts to fire.")
lookbackLeft = input.int(5, "Pivot Lookback Left", minval=1, group=divGroup)
lookbackRight = input.int(5, "Pivot Lookback Right", minval=1, group=divGroup)
rangeLower = input.int(5, "Min Range for Divergence", minval=0, group=divGroup)
rangeUpper = input.int(60, "Max Range for Divergence", minval=1, group=divGroup)
showHidden = input.bool(true, "Show Hidden Divergences", group=divGroup)
bearColor = color.red
bullColor = color.green
textColor = color.white
noneColor = color.new(color.white, 100)
_inRange(cond) =>
bars = ta.barssince(cond)
rangeLower <= bars and bars <= rangeUpper
bool plFound = false
bool phFound = false
bool bullCond = false
bool bearCond = false
bool hiddenBullCond = false
bool hiddenBearCond = false
float oscLBR = na
float lowLBR = na
float highLBR = na
float prevPlOsc = na
float prevPlLow = na
float prevPhOsc = na
float prevPhHigh = na
if calculateDivergence
plFound := not na(ta.pivotlow(osc, lookbackLeft, lookbackRight))
phFound := not na(ta.pivothigh(osc, lookbackLeft, lookbackRight))
oscLBR := osc
lowLBR := low
highLBR := high
prevPlOsc := ta.valuewhen(plFound, oscLBR, 1)
prevPlLow := ta.valuewhen(plFound, lowLBR, 1)
prevPhOsc := ta.valuewhen(phFound, oscLBR, 1)
prevPhHigh := ta.valuewhen(phFound, highLBR, 1)
// Regular Bullish
oscHL = oscLBR > prevPlOsc and _inRange(plFound )
priceLL = lowLBR < prevPlLow
bullCond := priceLL and oscHL and plFound
// Regular Bearish
oscLL = oscLBR < prevPhOsc and _inRange(phFound )
priceHH = highLBR > prevPhHigh
bearCond := priceHH and oscLL and phFound
// Hidden Bullish
oscLL_hidden = oscLBR < prevPlOsc and _inRange(plFound )
priceHL = lowLBR > prevPlLow
hiddenBullCond := priceHL and oscLL_hidden and plFound and showHidden
// Hidden Bearish
oscHH_hidden = oscLBR > prevPhOsc and _inRange(phFound )
priceLH = highLBR < prevPhHigh
hiddenBearCond := priceLH and oscHH_hidden and phFound and showHidden
// Plot divergences (lines and labels on pane)
if bullCond
leftBar = ta.valuewhen(plFound, bar_index , 1)
line.new(leftBar, prevPlOsc, bar_index , oscLBR, xloc=xloc.bar_index, color=bullColor, width=2)
label.new(bar_index , oscLBR, "R Bull", style=label.style_label_up, color=noneColor, textcolor=textColor)
if bearCond
leftBar = ta.valuewhen(phFound, bar_index , 1)
line.new(leftBar, prevPhOsc, bar_index , oscLBR, xloc=xloc.bar_index, color=bearColor, width=2)
label.new(bar_index , oscLBR, "R Bear", style=label.style_label_down, color=noneColor, textcolor=textColor)
if hiddenBullCond
leftBar = ta.valuewhen(plFound, bar_index , 1)
line.new(leftBar, prevPlOsc, bar_index , oscLBR, xloc=xloc.bar_index, color=bullColor, width=2, style=line.style_dashed)
label.new(bar_index , oscLBR, "H Bull", style=label.style_label_up, color=noneColor, textcolor=textColor)
if hiddenBearCond
leftBar = ta.valuewhen(phFound, bar_index , 1)
line.new(leftBar, prevPhOsc, bar_index , oscLBR, xloc=xloc.bar_index, color=bearColor, width=2, style=line.style_dashed)
label.new(bar_index , oscLBR, "H Bear", style=label.style_label_down, color=noneColor, textcolor=textColor)
// Alert conditions
alertcondition(bullCond, title="Regular Bullish Divergence", message="Found a new Regular Bullish Divergence, Pivot Lookback Right number of bars to the left of the current bar.")
alertcondition(bearCond, title="Regular Bearish Divergence", message="Found a new Regular Bearish Divergence, Pivot Lookback Right number of bars to the left of the current bar.")
alertcondition(hiddenBullCond, title="Hidden Bullish Divergence", message="Found a new Hidden Bullish Divergence, Pivot Lookback Right number of bars to the left of the current bar.")
alertcondition(hiddenBearCond, title="Hidden Bearish Divergence", message="Found a new Hidden Bearish Divergence, Pivot Lookback Right number of bars to the left of the current bar.")

Smart MTF S/R Levels[BullByte]
Smart MTF S/R Levels
Introduction & Motivation
Support and Resistance (S/R) levels are the backbone of technical analysis. However, most traders face two major challenges:
Manual S/R Marking: Drawing S/R levels by hand is time-consuming, subjective, and often inconsistent.
Multi-Timeframe Blind Spots: Key S/R levels from higher or lower timeframes are often missed, leading to surprise reversals or missed opportunities.
Smart MTF S/R Levels was created to solve these problems. It is a fully automated, multi-timeframe, multi-method S/R detection and visualization tool, designed to give traders a complete, objective, and actionable view of the market’s most important price zones.
What Makes This Indicator Unique?
Multi-Timeframe Analysis: Simultaneously analyzes up to three user-selected timeframes, ensuring you never miss a critical S/R level from any timeframe.
Multi-Method Confluence: Integrates several respected S/R detection methods—Swings, Pivots, Fibonacci, Order Blocks, and Volume Profile—into a single, unified system.
Zone Clustering: Automatically merges nearby levels into “zones” to reduce clutter and highlight areas of true market consensus.
Confluence Scoring: Each zone is scored by the number of methods and timeframes in agreement, helping you instantly spot the most significant S/R areas.
Reaction Counting: Tracks how many times price has recently interacted with each zone, providing a real-world measure of its importance.
Customizable Dashboard: A real-time, on-chart table summarizes all key S/R zones, their origins, confluence, and proximity to price.
Smart Alerts: Get notified when price approaches high-confluence zones, so you never miss a critical trading opportunity.
Why Should a Trader Use This?
Objectivity: Removes subjectivity from S/R analysis by using algorithmic detection and clustering.
Efficiency: Saves hours of manual charting and reduces analysis fatigue.
Comprehensiveness: Ensures you are always aware of the most relevant S/R zones, regardless of your trading timeframe.
Actionability: The dashboard and alerts make it easy to act on the most important levels, improving trade timing and risk management.
Adaptability: Works for all asset classes (stocks, forex, crypto, futures) and all trading styles (scalping, swing, position).
The Gap This Indicator Fills
Most S/R indicators focus on a single method or timeframe, leading to incomplete analysis. Manual S/R marking is error-prone and inconsistent. This indicator fills the gap by:
Automating S/R detection across multiple timeframes and methods
Objectively scoring and ranking zones by confluence and reaction
Presenting all this information in a clear, actionable dashboard
How Does It Work? (Technical Logic)
1. Level Detection
For each selected timeframe, the script detects S/R levels using:
SW (Swing High/Low): Recent price pivots where reversals occurred.
Pivot: Classic floor trader pivots (P, S1, R1).
Fib (Fibonacci): Key retracement levels (0.236, 0.382, 0.5, 0.618, 0.786) over the last 50 bars.
Bull OB / Bear OB: Institutional price zones based on bullish/bearish engulfing patterns.
VWAP / POC: Volume Weighted Average Price and Point of Control over the last 50 bars.
2. Level Clustering
Levels within a user-defined % distance are merged into a single “zone.”
Each zone records which methods and timeframes contributed to it.
3. Confluence & Reaction Scoring
Confluence: The number of unique methods/timeframes in agreement for a zone.
Reactions: The number of times price has touched or reversed at the zone in the recent past (user-defined lookback).
4. Filtering & Sorting
Only zones within a user-defined % of the current price are shown (to focus on actionable areas).
Zones can be sorted by confluence, reaction count, or proximity to price.
5. Visualization
Zones: Shaded boxes on the chart (green for support, red for resistance, blue for mixed).
Lines: Mark the exact level of each zone.
Labels: Show level, methods by timeframe (e.g., 15m (3 SW), 30m (1 VWAP)), and (if applicable) Fibonacci ratios.
Dashboard Table: Lists all nearby zones with full details.
6. Alerts
Optional alerts trigger when price approaches a zone with confluence above a user-set threshold.
Inputs & Customization (Explained for All Users)
Show Timeframe 1/2/3: Enable/disable analysis for each timeframe (e.g., 15m, 30m, 1h).
Show Swings/Pivots/Fibonacci/Order Blocks/Volume Profile: Select which S/R methods to include.
Show levels within X% of price: Only display zones near the current price (default: 3%).
How many swing highs/lows to show: Number of recent swings to include (default: 3).
Cluster levels within X%: Merge levels close together into a single zone (default: 0.25%).
Show Top N Zones: Limit the number of zones displayed (default: 8).
Bars to check for reactions: How far back to count price reactions (default: 100).
Sort Zones By: Choose how to rank zones in the dashboard (Confluence, Reactions, Distance).
Alert if Confluence >=: Set the minimum confluence score for alerts (default: 3).
Zone Box Width/Line Length/Label Offset: Control the appearance of zones and labels.
Dashboard Size/Location: Customize the dashboard table.
How to Read the Output
Shaded Boxes: Represent S/R zones. The color indicates type (green = support, red = resistance, blue = mixed).
Lines: Mark the precise level of each zone.
Labels: Show the level, methods by timeframe (e.g., 15m (3 SW), 30m (1 VWAP)), and (if applicable) Fibonacci ratios.
Dashboard Table: Columns include:
Level: Price of the zone
Methods (by TF): Which S/R methods and how many, per timeframe (see abbreviation key below)
Type: Support, Resistance, or Mixed
Confl.: Confluence score (higher = more significant)
React.: Number of recent price reactions
Dist %: Distance from current price (in %)
Abbreviations Used
SW = Swing High/Low (recent price pivots where reversals occurred)
Fib = Fibonacci Level (key retracement levels such as 0.236, 0.382, 0.5, 0.618, 0.786)
VWAP = Volume Weighted Average Price (price level weighted by volume)
POC = Point of Control (price level with the highest traded volume)
Bull OB = Bullish Order Block (institutional support zone from bullish price action)
Bear OB = Bearish Order Block (institutional resistance zone from bearish price action)
Pivot = Pivot Point (classic floor trader pivots: P, S1, R1)
These abbreviations appear in the dashboard and chart labels for clarity.
Example: How to Read the Dashboard and Labels (from the chart above)
Suppose you are trading BTCUSDT on a 15-minute chart. The dashboard at the top right shows several S/R zones, each with a breakdown of which timeframes and methods contributed to their detection:
Resistance zone at 119257.11:
The dashboard shows:
5m (1 SW), 15m (2 SW), 1h (3 SW)
This means the level 119257.11 was identified as a resistance zone by one swing high (SW) on the 5-minute timeframe, two swing highs on the 15-minute timeframe, and three swing highs on the 1-hour timeframe. The confluence score is 6 (total number of method/timeframe hits), and there has been 1 recent price reaction at this level. This suggests 119257.11 is a strong resistance zone, confirmed by multiple swing highs across all selected timeframes.
Mixed zone at 118767.97:
The dashboard shows:
5m (2 SW), 15m (2 SW)
This means the level 118767.97 was identified by two swing points on both the 5-minute and 15-minute timeframes. The confluence score is 4, and there have been 19 recent price reactions at this level, indicating it is a highly reactive zone.
Support zone at 117411.35:
The dashboard shows:
5m (2 SW), 1h (2 SW)
This means the level 117411.35 was identified as a support zone by two swing lows on the 5-minute timeframe and two swing lows on the 1-hour timeframe. The confluence score is 4, and there have been 2 recent price reactions at this level.
Mixed zone at 118291.45:
The dashboard shows:
15m (1 SW, 1 VWAP), 5m (1 VWAP), 1h (1 VWAP)
This means the level 118291.45 was identified by a swing and VWAP on the 15-minute timeframe, and by VWAP on both the 5-minute and 1-hour timeframes. The confluence score is 4, and there have been 12 recent price reactions at this level.
Support zone at 117103.10:
The dashboard shows:
15m (1 SW), 1h (1 SW)
This means the level 117103.10 was identified by a single swing low on both the 15-minute and 1-hour timeframes. The confluence score is 2, and there have been no recent price reactions at this level.
Resistance zone at 117899.33:
The dashboard shows:
5m (1 SW)
This means the level 117899.33 was identified by a single swing high on the 5-minute timeframe. The confluence score is 1, and there have been no recent price reactions at this level.
How to use this:
Zones with higher confluence (more methods and timeframes in agreement) and more recent reactions are generally more significant. For example, the resistance at 119257.11 is much stronger than the resistance at 117899.33, and the mixed zone at 118767.97 has shown the most recent price reactions, making it a key area to watch for potential reversals or breakouts.
Tip:
“SW” stands for Swing High/Low, and “VWAP” stands for Volume Weighted Average Price.
The format 15m (2 SW) means two swing points were detected on the 15-minute timeframe.
Best Practices & Recommendations
Use with Other Tools: This indicator is most powerful when combined with your own price action analysis and risk management.
Adjust Settings: Experiment with timeframes, clustering, and methods to suit your trading style and the asset’s volatility.
Watch for High Confluence: Zones with higher confluence and more reactions are generally more significant.
Limitations
No Future Prediction: The indicator does not predict future price movement; it highlights areas where price is statistically more likely to react.
Not a Standalone System: Should be used as part of a broader trading plan.
Historical Data: Reaction counts are based on historical price action and may not always repeat.
Disclaimer
This indicator is a technical analysis tool and does not constitute financial advice or a recommendation to buy or sell any asset. Trading involves risk, and past performance is not indicative of future results. Always use proper risk management and consult a financial advisor if needed.

VWAP Volume Profile [BigBeluga]🔵 OVERVIEW
VWAP Volume Profile is an advanced hybrid of the VWAP and volume profile concepts. It visualizes how volume accumulates relative to VWAP movement—separating rising (+VWAP) and declining (−VWAP) activity into two mirrored horizontal profiles. It highlights the dominant price bins (POCs) where volume peaked during each directional phase, helping traders spot hidden accumulation or distribution zones.
🔵 CONCEPTS
VWAP-Driven Profiling: Unlike standard volume profiles, this tool segments volume based on VWAP movement—accumulating positive or negative volume depending on VWAP slope.
Dual-Sided Profiles: Profiles expand horizontally to the right of price. Separate bins show rising (+) and falling (−) VWAP volume.
Bin Logic: Volume is accumulated into defined horizontal bins based on VWAP’s position relative to price ranges.
Gradient Coloring: Volume bars are colored with a dynamic gradient to emphasize intensity and direction.
POC Highlighting: The highest-volume bin in each profile type (+/-) is marked with a transparent box and label.
Contextual VWAP Line: VWAP is plotted and dynamically colored (green = rising, orange = falling) for instant trend context.
Candle Overlay: Price candles are recolored to match the VWAP slope for full visual integration.
🔵 FEATURES
Dual-sided horizontal volume profiles based on VWAP slope.
Supports rising VWAP , falling VWAP , or both simultaneously.
Customizable number of bins and lookback period.
Dynamically colored VWAP line to show rising/falling bias.
POC detection and labeling with volume values for +VWAP and −VWAP.
Candlesticks are recolored to match VWAP bias for intuitive momentum tracking.
Optional background boxes with customizable styling.
Adaptive volume scaling to normalize bar length across markets.
🔵 HOW TO USE
Use POC zones to identify high-volume consolidation areas and potential support/resistance levels.
Watch for shifts in VWAP direction and observe how volume builds differently during uptrends and downtrends.
Use the gradient profile shape to detect accumulation (widening volume below price) or distribution (above price).
Use candle coloring for real-time confirmation of VWAP bias.
Adjust the profile period or bin count to fit your trading style (e.g., intraday scalping or swing trading).
🔵 CONCLUSION
VWAP Volume Profile merges two essential concepts—volume and VWAP—into a single, high-precision tool. By visualizing how volume behaves in relation to VWAP movement, it uncovers hidden dynamics often missed by traditional profiles. Perfect for intraday and swing traders who want a more nuanced read on market structure, trend strength, and volume flow.

VWAP with Prev. Session BandsVWAP with Prev. Session Bands is an advanced indicator based on TradingView’s original VWAP. It adds configurable standard deviation or percentage-based bands, both for the current and previous session. You can anchor the VWAP to various timeframes or events (like Sessions, Weeks, Months, Earnings, etc.) and selectively show up to three bands.
The unique feature of this script is the ability to display the VWAP and bands from the previous session, helping traders visualize mean reversion levels or historical volatility ranges.
Built on top of the official TradingView VWAP implementation, this version provides enhanced flexibility and visual clarity for intraday and swing traders alike.
