High Low Open Mid Ranges & Levels (Multi-Timeframe)This indicator automatically plots the chosen timeframe's high, low, mid point and open. These levels on higher timeframes act as support and resistance levels on lower timeframes, helping find entries, stoploss and profit targets.
Most common timeframes to choose are Daily, 1W, 1M, and 3M. Other timeframes that are good include, 2D, 2W and 2M.
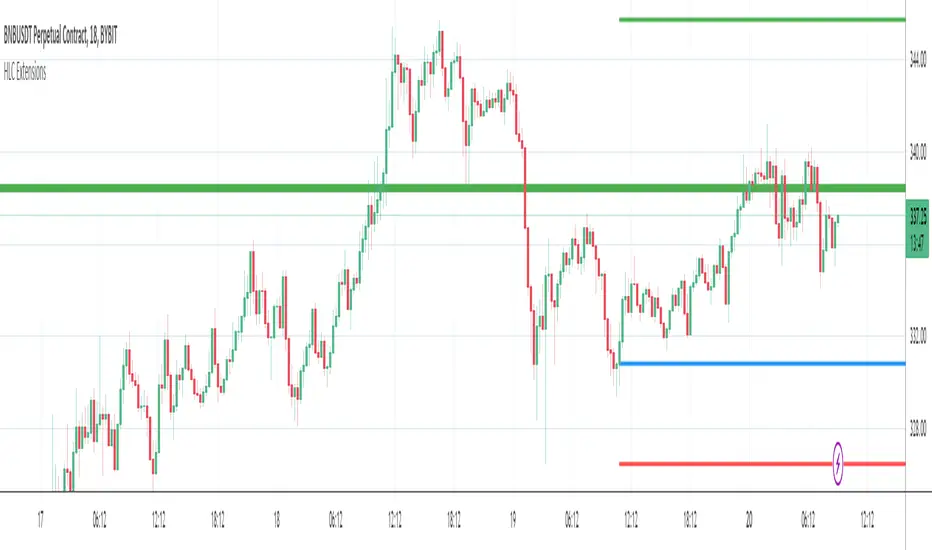
For example, you can see in the snapshot below, we are on the 4hr TF showing those levels from the 2W. This historical 2W zone (open and mid) was (and currently still is) resistance. You can see it also provided a good entry to go short.
This is also useful for intraday scalping. Below, we are on the 15min TF with levels set on the 2D timeframe. You can see how the Open and Mid levels acted as resistance, providing good entries on range trades, with take profit set at the previous 2D low.
There is also a table which tells you all the main TFs high, low, open, and mid levels. They are the most important ones to look out for.
This indicator should not be used in isolation; it is best to pair it up with other TA such as orderblocks, S/D zones, S&R or overlay indicators.
Carta Mingguan

Price Range TableThe table shows the ranking of the price as a percentage relative to the past candles.
100 ~ highest price of the time frame
0 ~ lowest price of the time frame

MTF Key Levels - Support and ResistanceThis indicator shows how to Multi Time Frame (MTF) interpret levels:
Watch how price acts around these levels and how they can act as support/resistance and can be used as great confluence levels for your technical analysis.
This indicator displays:
VWAP Levels
Daily / Weekly / Monthly / Yearly
Within the chart above I have marked out how displaying these VWAP levels can provide support and resistance levels to be aware of.
Daily – Weekly - Monthly – Yearly Levels
O = Open / H = High / L = Low
pO = Previous Open / pH = Previous High / pL = Previous Low / pEQ = Previous Equlibrium
Having previous Low/High levels makes you aware of Swing Failure Patterns (SFP). Also the daily/weekly/monthly opening and previous opening can assist with the trend.
Daily Open: Gives you an idea who is in control for the day. This level very often acts as strong support or resistance.
Weekly Open: Indicates where the price is within the higher timeframe.
Monthly Open & Yearly Levels: Overview of direction for the whole month without looking at a monthly chart and Yearly chart
Line Options
Within the line options you can choose to have a clean chart and display a “short line”. These line length can be adjusted by the user.
Line just to the right.
Line across the screen.
Disclaimer: The Monthly and Yealy VWAP will only show on higher timeframes this is due to restriction of how many candles can be shown on the chart. The candles displayed need to go back to either the start of the month of year to be able to calculate their VWAPs.

DAYOFWEEK performance1 -Objective
"What is the ''best'' day to trade .. Monday, Tuesday...."
This script aims to determine if there are different results depending on the day of the week.
The way it works is by dividing data by day of the week (Monday, Tuesday, Wednesday ... ) and perform calculations for each day of the week.
1 - Objective
2 - Features
3 - How to use (Examples)
4 - Inputs
5 - Limitations
6 - Notes
7 - Final Tooughs
2 - Features
AVG OPEN-CLOSE
Calculate de Percentage change from day open to close
Green % (O-C)
Percentage of days green (open to close)
Average Change
Absolute day change (O-C)
AVG PrevD. Close-Close
Percentage change from the previous day close to the day of the week close
(Example: Monday (C-C) = Friday Close to Monday close
Tuesday (C-C) = Monday C. to Tuesday C.
Green % (C1-C)
Percentage of days green (open to close)
AVG Volume
Day of the week Average Volume
Notes:
*Mon(Nº) - Nº = Number days is currently calculated
Example: Monday (12) calculation based on the last 12 Mondays. Note: Discrepancies in numbers example Monday (12) - Friday (11) depend on the initial/end date or the market was closed (Holidays).
3 - How to use (Examples)
For the following example, NASDAQ:AAPL from 1 Jan 21 to 1 Jul 21 the results are following.
The highest probability of a Close being higher than the Open is Monday with 52.17 % and the Lowest Tuesday with 38.46 %. Meaning that there's a higher chance (for NASDAQ:AAPL ) of closing at a higher value on Monday while the highest chance of closing is lower is Tuesday. With an average gain on Tuesday of 0.21%
Long - The best day to buy (long) at open (on average) is Monday with a 52.2% probability of closing higher
Short - The best day to sell (short) at open (on average) is Tuesday with a 38.5% probability of closing higher (better chance of closing lower)
Since the values change from ticker to ticker, there is a substantial change in the percentages and days of the week. For example let's compare the previous example ( NASDAQ:AAPL ) to NYSE:GM (same settings)
For the same period, there is a substantial difference where there is a 62.5% probability Friday to close higher than the open, while Tuesday there is only a 28% probability.
With an average gain of 0.59% on Friday and an average loss of -0.34%
Also, the size of the table (number of days ) depends if the ticker is traded or not on that day as an example COINBASE:BTCUSD
4 - Inputs
DATE RANGE
Initial Date - Date from which the script will start the calculation.
End Date - Date to which the script will calculate.
TABLE SETTINGS
Text Color - Color of the displayed text
Cell Color - Background color of table cells
Header Color - Color of the column and row names
Table Location - Change the position where the table is located.
Table Size - Changes text size and by consequence the size of the table
5 - LIMITATIONS
The code determines average values based on the stored data, therefore, the range (Initial data) is limited to the first bar time.
As a consequence the lower the timeframe the shorter the initial date can be and fewer weeks can be calculated. To warn about this limitation there's a warning text that appears in case the initial date exceeds the bar limit.
Example with initial date 1 Jan 2021 and end date 18 Jul 2021 in 5m and 10 m timeframe:
6 - Notes and Disclosers
The script can be moved around to a new pane if need. -> Object Tree > Right Click Script > Move To > New pane
The code has not been tested in higher subscriptions tiers that allow for more bars and as a consequence more data, but as far I can tell, it should work without problems and should be in fact better at lower timeframes since it allows more weeks.
The values displayed represent previous data and at no point is guaranteed future values
7 - Final Tooughs
This script was quite fun to work on since it analysis behavioral patterns (since from an abstract point a Tuesday is no different than a Thursday), but after analyzing multiple tickers there are some days that tend to close higher than the open.
PS: If you find any mistake ex: code/misspelling please comment.

Naked - Daily Weekly MonthlyUser request for Naked Daily Weekly Monthly Opens.
This indicator plots the Daily Weekly Opens (the day after day after creation), they then will stay on the chart until a candle close is completed on the other side of the plot.
In the above chart picture you can see how previous monthly and daily opens have acted as support and resistance.
Thanks go to:
StackOverFlow Bjorn Mistiaen
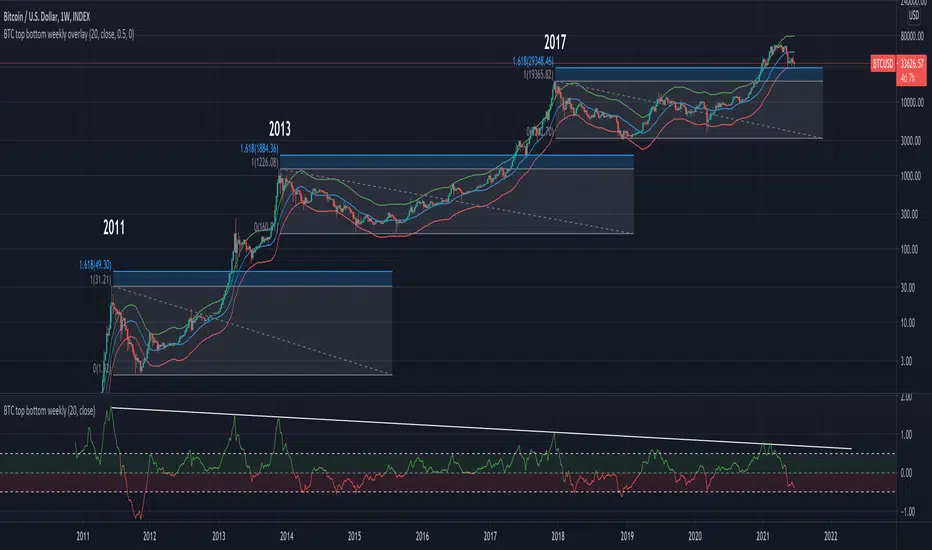
BTC top bottom weekly oscillatorThis indicator is based on the 20 weekly simple moving average and it could be used to help finding potential tops and bottoms on a weekly BTC chart.
This version uses an "oscillator" presentation, it fluctuates around the value zero.
The indicator plots 0 when the close price is near the 20 weekly moving average.
If it's below 0 it reflects the price being below the 20 weekly moving average, and opposite for above.
IT's possible to see how many times the price has hit the 0.5 coef support. In one case it hit 0.6 showing that the 0.5 support can be broken.
The indicator is calculated as Log(close / sma(close))
Instructions:
- Use with the symbol INDEX:BTCUSD so you can see the price since 2010
- Set the timeframe to weekly
Optionals:
- change the coef to 0.6 for a more conservative bottom
- change the coef to 0.4 for a more conservative top

BTC top bottom weekly bandsThis indicator is based on the 20 weekly simple moving average and it could be used to help finding potential tops and bottoms on a weekly BTC chart.
When using the provided "coef" parameter set to the default of 0.5 it shows how most bottoms since 2013 have hit the lower band of this indicator.
The lower band is calculated as exp(coef) * sma(close)
Instructions:
- Use with the symbol INDEX:BTCUSD so you can see the price since 2010
- Set the timeframe to weekly
- Use logarithmic chart (toggle "log" on)
Optionals:
- change the coef to 0.6 for a more conservative bottom
- change the coef to 0.4 for a more conservative top
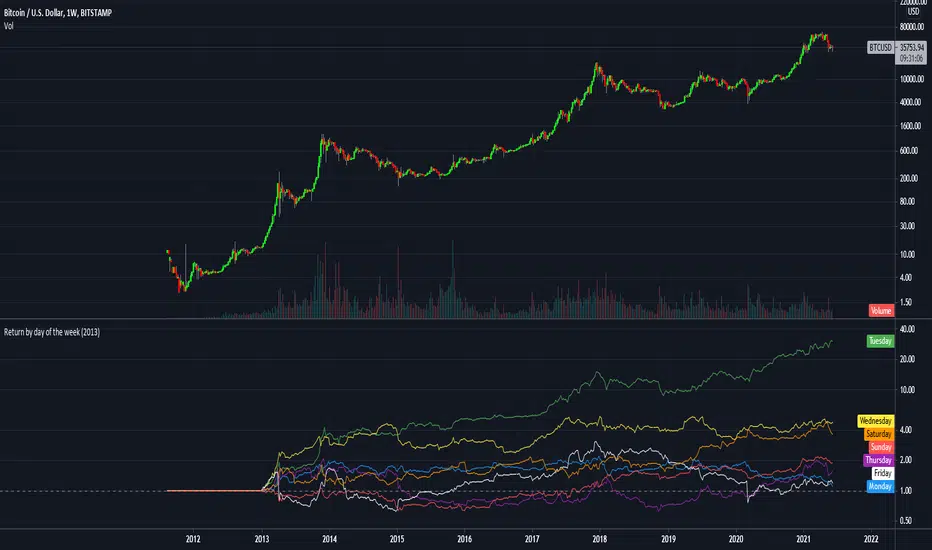
Return by day of the weekBuy on Mondays sell on Tuesdays.
Just a simple tracking of returns.
It works only on the weekly charts
Yesterdays & Last Weeks High Low Close ExtensionsPlots the Extensions of Yesterdays and Last Weeks High Low Close
Unfortunately all of the levels wont always show therefore it is good use this in conjunction with my Levels script
I tried to combine the 2 scripts but doing so gave me memory overload errors in Tradingview thats why I have made them separate
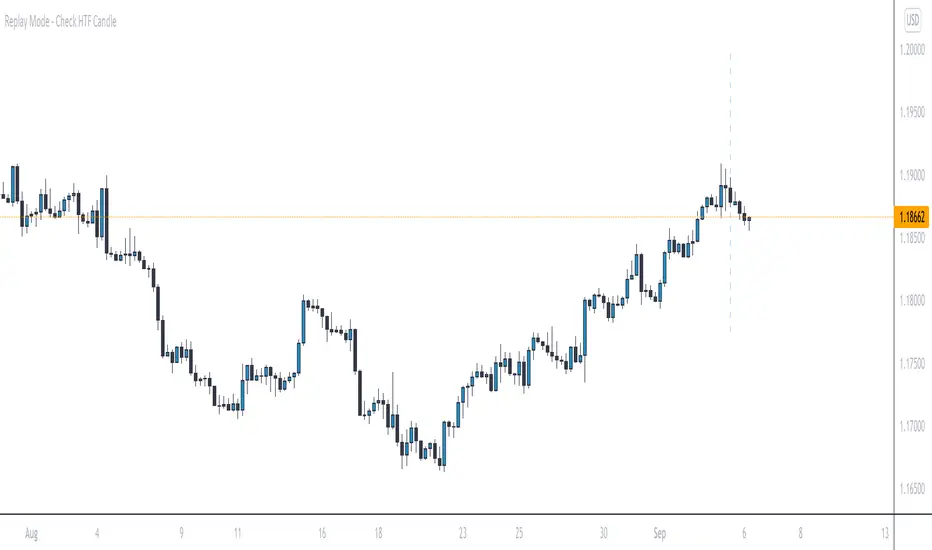
Replay Mode - Check HTF CandleThis indicator is intended to be used while using Replay Mode.
A vertical line will be drawn when you can safely check the 4H, Daily, or Weekly candle without seeing future price.
It is similar to the built-in Session Breaks, but has the benefit of not needing to remove one candle before checking the Daily.
When the line is the color of your 4H settings, it is safe to check the 4H candle.
When the line is the color of your Daily settings, it is safe to check the 4H and Daily candles.
When the line is the color of your Weekly settings, it is safe to check the 4H, Daily and Weekly candles
Replay Mode - Check Daily/WeeklyThis indicator is intended to be used while using Replay Mode.
It is similar to the built-in Session Breaks, but has the benefit of not needing to remove one candle before checking the Daily.
When on an intraday chart (timeframe less than Daily), a vertical line will be drawn when you can safely check the Daily or Weekly candle without seeing future price.
When the line is the color of your Daily settings, it is safe to check the Daily candle.
When the line is the color of your Weekly settings, it is safe to check both the Daily and Weekly candle.

First Week Trend [MX]I created this indicator based on one of my ways of analyzing the BTC trend in particular, I noticed that the break of the first weekly candle usually indicates the trend for the rest of the month.
This indicator has a bug in which if you change the timeframe of the indicator it will show erroneous values
If you use the candlestick chart, you will need to pull the visual order of this indicator to the top to overlay the colors of the standard candles, or simply hide the standard candles
the trend colors are bugged in timeframes other than the weekly
special thanks to @xdecow who helped me with the code
////////////////////////////////////////////////////////////////////////
Eu criei esse indicador baseado em uma das minhas formas de analisar a tendência do BTC em específico, eu notei que o rompimento do primeiro candle do semanal costuma indicar a tendência para o resto do mês.
Esse script tem um bug em que se mudar o timeframe do indicador ele irá mostrar valores errados
Se você usa o gráfico de candlesticks, você precisará puxar para o topo a ordem visual desse indicador para sobrepor as cores do candles padrões, ou simplesmente ocultar os candles padrões
as cores da tendencia estão bugados em outros timeframes diferentes do semanal
agradecimentos especiais ao @xdecow que me ajudou no código

Pre and Market OpeningsPre and Market Openings is to enable you to quickly visualize the opening markets and how they could influence trading.
The below script has used the market time data from the below links:
Tokyo/Asia www.tradinghours.com
London www.tradinghours.com
New York www.tradinghours.com
The below script aims to plot:
Daily Asia Open
Weekly Asia Open
Daily London Open
Weekly London Open
Daily New York Open
Weekly New York Open
Using background colour it also shows market sessions (pre-market) for London and New York and regular for London, New York and Asia.
There is also plotted text for days of the week and sessions.
As you can see from the picture below that these market openings can act as support and resistance:
BTC
ETH

MrBB:BullBear Support BandVery simple and effective S/R band. Created bycombining the weekly 21EMA and weekly 20SMA, it provides strong support/resistance depending on market direction, and works as a basing area for retraces during parabolic (and normal) bull markets.
Key Levels SpacemanBTC IDWMKey levels, plotted automatically
Additional timeframes can be added on request
Useful for seeing strength of the trend in the market

Weekly/Daily/Hourly/Minutes Colored Background IntervalsThis is my "Weekly/Daily/Hourly/Minutes Colored Background Intervals" assistant. I wouldn't describe it as an indicator, it just exhibits coloration of referenced periods of time with bgcolor() in Pine. With the arrival of 2021, I pondered the necessity of needing a visualization pre-2021 to visually recognize periodicity of market movements by the week, day, hour, or an adjustable period of minutes. While this script is simply generic, I hope you may find useful in your endeavors as a member on TradingView.
Explaining the script's usage, the "Minutes" input can be adjusted from anywhere between 5-55 minutes for only intraday. This can be modified to accommodate 90 minutes (1.5hrs) or any other minutes period desirable by tweaking certain numbers up to 1440. Minutes and Hourly backgrounds are disabled by default for most daily traders. Changing the input() code to `true` will provide them on by default when the script loads, if you choose that route. Each time periods background color is enable/disable capable. All of the colors are easily adjustable to any combination you can ponder for your visual acuity with the color swatch provided by input(type=input.color). The coloring can be "swapped" by input() depending on how you wish to start and end the day visually. I thought this would come in handy. The weekly background can have different starting points, whether it be Sunday, Monday, or any other day such as Friday for example.
The entire script's contents isn't intended for complete re-use as is for publicly published scripts. It's more along the lines of code that could be used to personally modify indicators you have, depending on the time frames you may actually be trading on. The code is basically modular, so you can use bits and pieces of it in your personally modified Pine Editor scripts that you wish to customize for yourself. I will say that the isXxx() functions are completely reusable in any script without any need for author permission inquiries from me, as easy as copy and paste. Those may come in handy for many folks. If you find them useful in certain circumstances, use isXxx() functions as you please. Day of the week detection by functions will have applications beyond my current intended use for them.
Of notable mention, this is a miniature lesson by example of how the new input(type=input.color) may be used. I'm also using `var` inside functions to aid in computational efficiency of the script runtime. The colors are permanently stored at the very beginning of the scripts operation inside the function and just reused from that point onward. Its a rare use case, but well suited for this scripts intention. Once again I have demonstrated the "Power of Pine" for developers of any experience level to learn from via code elegance.
When available time provides itself, I will consider your inquiries, thoughts, and concepts presented below in the comments section, should you have any questions or comments regarding this indicator. When my indicators achieve more prevalent use by TV members , I may implement more ideas when they present themselves as worthy additions. Have a profitable future everyone!

Key Levels TheHuntThis indicator is made to show you some key levels on the chart on the different timeframes. You can hide them or show them in the settings. The levels are the Monthly Weekly and Daily opens, current monthly, weekly and daily high / low, last weeks high / low & last daily high / low as well as Monday high and low. These levels can be used as key pivots or key liquidity areas. You can also adjust the time to also use the correct Mon range for forex pairs.
As you can see on the chart, that is how the levels show up on the chart.

Day Selectable Weekly Anchor VWAPSimple script to anchor VWAP on selected day of the week.
It is very useful when you want to anchor VWAP from a particular day instead of default Monday when you use weekly VWAP
Please note that this is a weekly VWAP and not daily or monthly vwap.
Example use case:
Lets say I want to anchor VWAP on specific day like Friday instead of Monday, I would just select the Friday from the drop down window and voila!

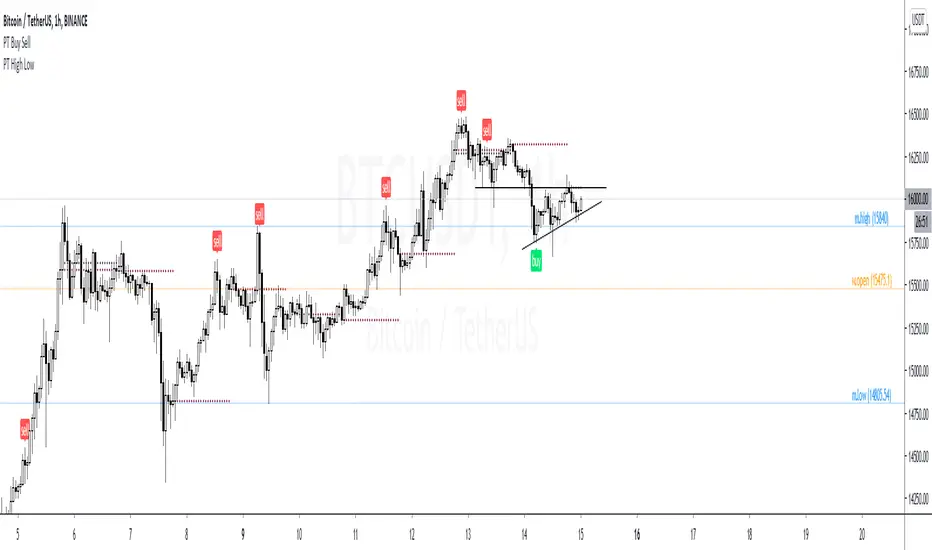
PT High Low Version 1.0 of our PT High Low indicator helps create a visual for the Daily, Weekly, Monthly & Yearly range. These levels will give you an idea of where the price can react if reached. Consider them pivotal areas. We included a toggle that will help you go between the candle's High/Low to the candle's Open/Close. Both features are unique when scalping & swinging. The High/Low will paint a beautiful visual for your day to day trading & the Open/Close will help you determine where price maxed opened & closed for that specified timeframe.
Strategy:
Price tends to gravitate between the Daily level when playing intraday scalps. If playing the weekly, you want to be above the weekly pivot to punt longs & under the weekly level to punt shorts. More likely than not, when the price hits a monthly or yearly level, we get a noticeable reaction off it.
This Oscillator was built around our buy sell indicator & it is used on all time frames for swinging & scalping. It is included as part of the library. Just message us for access!
BT D/W/M SeparatorsThis will print vertical lines for Daily/Weekly/Monthly open and close times. Also highlighting the days of the week including weekends for the crypto lovers :-)
EMA with time-interval dependant visiblity settingThis scrip exposes 4 Exponential Moving Average (EMA) indicators which their visibility can be set to a daily or weekly time-frame (aka intervals). Based on your current chart time-frame, the matching EMA indicators come on and off.
This helps to have meaningful EMAs relevant to your time internal.
In a traditional 10 EMA indicates a plotted indicator would bear a meaning of a 10 day EMA when in daily and 10 week EMA when in weekly chart which may or may not be useful as some who for example only require a 10 week EMA for thier analysis and wouldn't want to cloud a daily chart with an EMA which won't resemble a valuable output for this particular user.
With EMA+, you can choose to see the 10 week EMA only when your chart is in the weekly time interval, so when switched to a daily interval a 10x EMA is not shown anymore.
If you prefer to see a 10 week EMA and a 21 day EMA on the other hand, you will only have 1 EMA shown when in weekly mode which is a 10 week EMA and one EMA when in daily mode with is 21 day EMA.