Swing PointsEnglish:
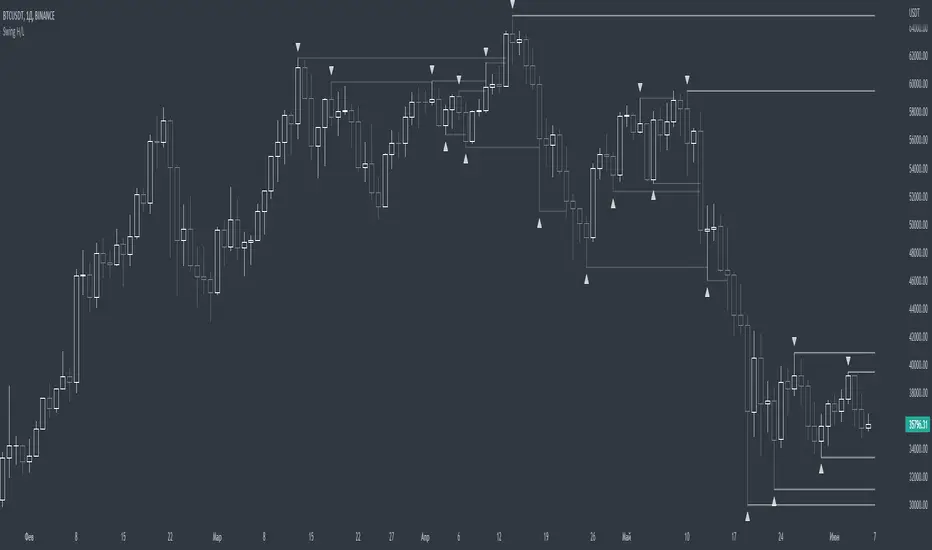
The indicator shows the fractals where stop-losses may be located and can be used to trade from their taking.
You can adjust the length of the fractal (the number of bars with which it is surrounded on both sides, to confirm the validity).
You can also display lines from fractal points for clarity.
To keep the chart clean, you can enable deletion of already taken fractals.
Example of use with deleted fractals and without lines:
Русский:
Индикатор показывает фракталы где могут находиться стоп-лоссы и его можно использовать для торговли от их снятия.
Можно настраивать длину фрактала (количество баров, которыми он окружен с обеих сторон, для подтверждения валидности).
Так же можно выводить линии от фрактальных точек для наглядности.
Для сохранения чистоты графика можно включить удаление уже снятых фракталов.
Пример использования с удалением снятых фракталов и без линий:
Williams Fractal
Smaller Fractals (+ Transparency)Smaller Fractals (+ Transparency)
I find that fractals are super useful, but can visually clutter up the chart pretty quickly. Their opaqueness and just overall bigness can become a bit much.
As such, these are just like regular fractals, only smaller (pine script's`size.tiny` instead of the default `size.small`).
Also, you can set a transparency level to these little guys (default is 50%).
Simple, more polite, and hopefully more useful fractals for those wnting a cleaner looking chart. 😁

Williams Fractals - LH/HLSame of original Williams Fractals, but with the following changes
- changed arrow directions
- added option to show Lower Highs and Higher Lows
- added alerts for Lower High and Higher Low
Enjoy~~

[VDB]TrendScalp-FractalBox-3EMAThere are many indicators with William’s Fractal and Alligator. As many use EMA’s it may be useful to define a 3-EMA ribbon and combining Fractal Levels/Box (filling background between top and bottom fractals) for trend scalping. I searched for this kind of indicator in community – some show fractals, some just levels, some with alligator etc. but couldn't find the one needed. Hence thought of this indicator which may be of interest to other users too.
Key Points:
EMA ribbon is created using 3 EMA’s 35/70/105. Users can change these as per their preference. This is used for trend identification – 1. Bullish bias if Price > EMA1 > EMA2 > EMA3. 2. Bearish bias if Price < EMA1 < EMA2 < EMA3.
Background is marked during crossing of EMA1 and EMA2 to alert possible trend change.
5-bar fractals are used to mark the Fractal levels and background between top and bottom fractals are filled to create a Fractal Box.
Fractal levels are marked only when the fractal formation is complete. Given offset is used this is lagging.
How to Use:
Sloping EMA ribbon is used for identifying the trend.
Fractal box break-out/ break-downs are used to trigger the trade with fractal high/low for entry/SL. Waiting for price contraction towards EMA ribbon resulting in smaller boxes is key to initiate trade. Avoid bigger boxes as SL’s will be big and price may move within. To draw the vertical lines of FractalBox change fractal level0 style to step-line.
This indicator combined with the cycle high/low (overbought/oversold) indicators such as CCI/Stochastic/RSI etc. can make it a good trend scalping setup while trading in the direction of momentum in higher timeframe.
This setup could be used for any timeframes. Do your back-testing before using it in live market.
This indicator was achieved by combing some fractal ideas from “Fractal and Alligator Alerts by JustUncleL”
DISCLAIMER : This indicator has been created for educational reference only and do not constitute investment advice. This indicator should not be relied upon as a substitute for extensive independent market research before making your actual trading decisions. Market data or any other content is subject to change at any time without notice. Liability for any loss or damage, including without limitation any loss of profit, which may arise directly or indirectly from use of this indicator is accountability of user using it.

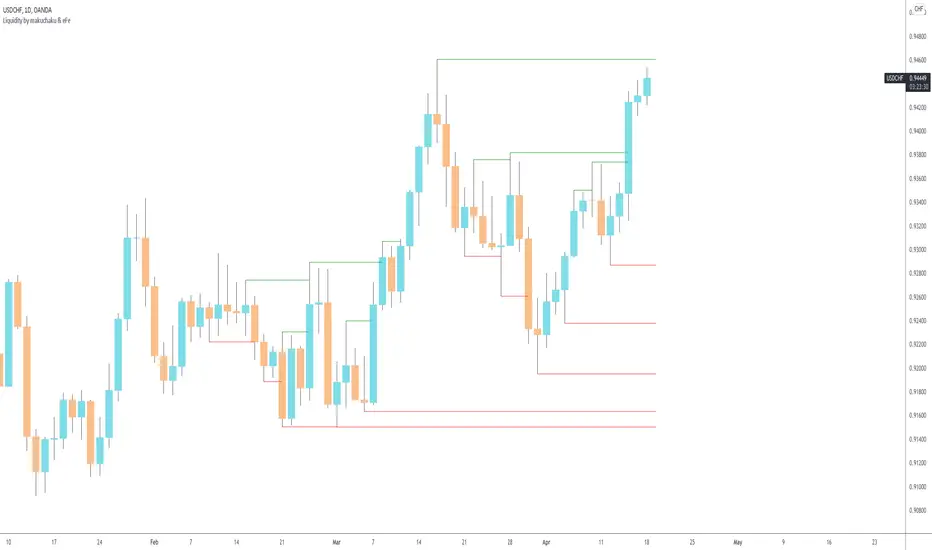
Makuchaku's trading tools - Liquidity visualizerThis indicator plots those pivots/fractals which have not been taken out by price, whereby showing where are the clusters of highs/lows where stop orders (or liquidity) could be hiding.
This is a fantastic tool for taking reversal trades.
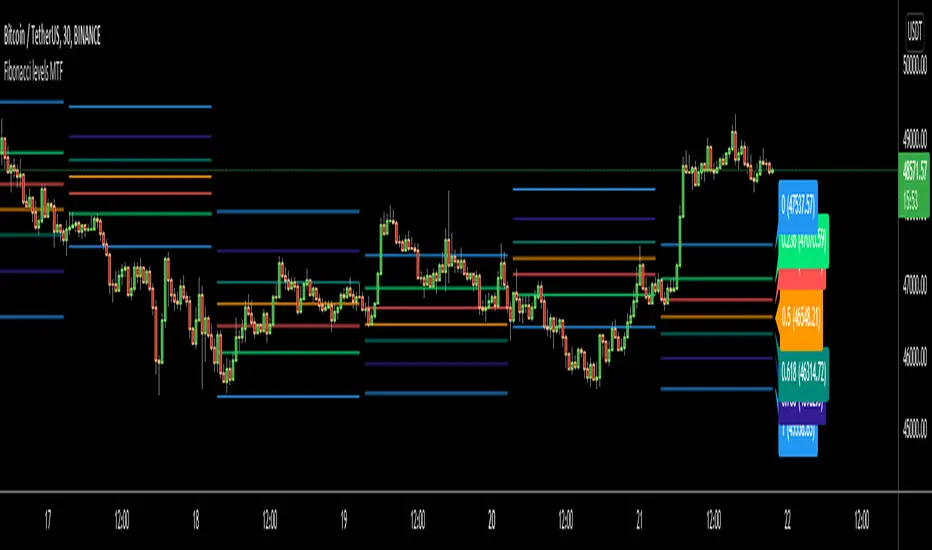
Fibonacci levels MTFHello All,
I got some requests for a script that shows Fibonacci Levels of Higher Time Frame Candles. so I made/published this script. I hope it would be useful for you.
Options:
You can set Higher Time Frame, by default it's 1 Day.
Optionally it can use Current or Last Candle of higher time frame to calculate/show its Fibonacci Levels.
It can show higher time frame candles at the background optionally. You can change its colors.
You can enable/disable/change each Fibonacci levels and their colors.
You can enable/disable Fibonacci Labels that is shown at the right ride and see only Fibonacci lines/levels
example, Fibonacci levels with higher time frame candles:
P.S. if you have ideas to improve this script, drop a comment under the script please
Enjoy!
[JL] How Many Signals last N barsGot this idea after I found Multiple Indicators Screener from QuantNomad.
This script learnt some codes from QuantNomad's great script. Thanks to him.
------------------------------------------------------------------------------------------------------------------------------------------------------------------------
This table show how many signals happened during the last N bars.
I only take care Forex, so this table only has 28 symbols. Feel free to change it.
Calculate the following signals:
RSI cross over/under 50
Short Moving average cross over/under long moving average
Stochastic k cross over/under d
MACD hist cross over/under 0
Williams Fractals: Up and Down fractals happened.
The concept is simple: Range period will always happen more cross signals than the trend period.
When the counter is less than median of all symbols, will be set green color. So more green mean more chance to be trend.

EneX SignalEneX is signal that give recommendation signals for entry and exit on spot market. This indicators not suitable for leverage trading in futures market.
EneX signal consider several indicators and has entry and exit rules.
EneX signal is suitable for investors who believe in trend following strategy (disclaimer on).
This script composed by Yohan Naftali for educational purpose only. Reader who will use this signal must do own research.
Indicator and Plot Involved
1. Williams Fractals with default periods = 2
2. William Alligator Indicators with default simple moving average 8, 13, and 21
3. Exponential Moving Averages with default value EMA 50, 100, and 200
4. Relative Strength Index with default overbought level = 80 and oversold level = 20
5. Williams Fractals are joined to create support and resistance line and fill area between support and resistance lines.
Entry signal conditions
1. Entry on Weakness when bullish fractal appear on n/2 period
2. Entry when price break resistance line
All entry condition must above EMA and alligator signal and not in overbought RSI
Exit signal conditions
1. Lowest price is below Exponential Moving Average
2. Lowest price is below William alligator lines
You can easily find entry and exit points by using Entry (E), Exit(X) signals
How to use
1. Monitor chart and wait until E or X signals
2. Entry if Entry Signal (E) appear (green colored label)
3. Exit if Exit Signal (X) appear (red colored label)
4. Change indicators setting when necessary
Best Practice
1. Entry only when entry signal (E) appear
2. Never entry when price below William alligator signal
3. Exit when exit signal (X) appear
4. Not exit when exit signal appear when you believe or you have information that price will be rebound
5. Exit if you believe that current price meet your target price
6. Always wise when use EneX signals
Disclaimer
Do your own research and consider fundamental price of asset.
The indicators provided on this script is for educational purposes only.
Author does not offer advisory or brokerage services, nor does it recommend or advise users to buy or sell particular stocks or securities.
Please examined script and give feedback for further improvement.

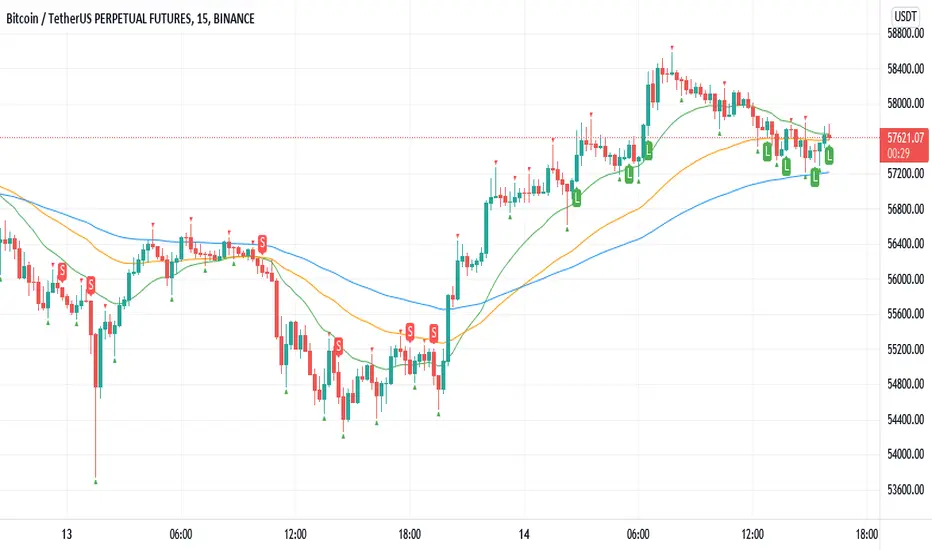
Williams Fractals BUY/SELL signals indicatorThis indicator made with using Williams Fractals, 20 50 100 Moving Averages and Relative Strength Index. You can easily find entry points by using Long (L), Short (S) signals.
This is a 15min scalping strategy for BTC:USDT Perpetual pair. For use different pairs or TFs you may need to change settings.
How to use
****************
When flashing Long (L) or Short (S) signal you should wait until the candle closing for the confirmation.
After that candle closed with the signal, you can enter a trade in next candle opening.
Your SL should be 3.1% from etnry and TP should be 0.5% from entry for best results. (You can use Long Position / Short Position tool in Prediction and Measurement Tools in drawing pannel to calculate this. This settings only for BTC:USDT Perp 15 min TF. For other TFs or Pairs settings may vary. You can easily change these settings and backtest your own.)
After entering a trade you can be ignored next signals until close the trade.
To learn more about this strategy, please try the "Williams Fractals Strategy" I coded. Thank you!
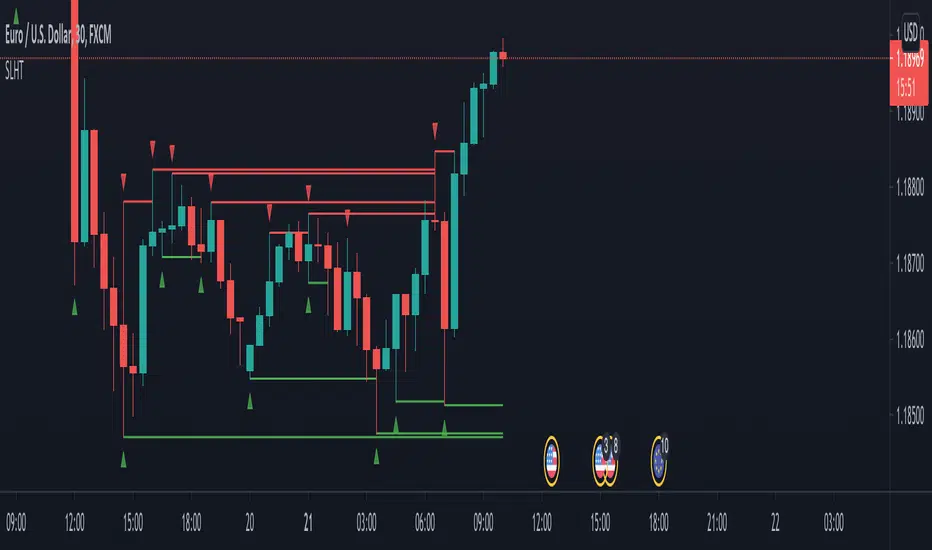
SL Hunter Tracker SL Hunter Tracker
coded by Bogdan Vaida
SL Hunter Tracker is a meticulous hunter that tracks SL hunters.
First it plots the fractals on the chart, then it draws lines from them
to the last wick that touched that height. You can add sweep alerts, once
per bar close, so that you get notified when a wick was touched.
Tested on: EURUSD 30'
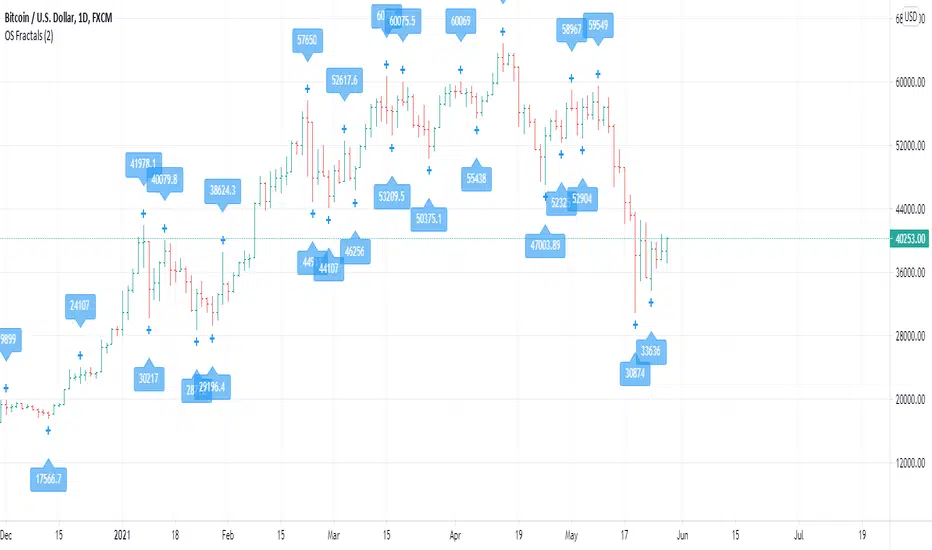
OS FractalsAn up fractal is formed when a high is both preceded and followed by lower highs. A down fractal is formed when a low is both preceded and followed by higher lows.
Bill Williams uses a period of 2 (2 after and 2 before) to define a fractal. This indicator has 2 as default but lets you decide the range you want.
The indicator lets you also select alerts when price crosses an up of down fractal, which would usually mean to entry a position. This indicator works best when used with an alligator, as long signals are valid above the Balance Line and short signals are valid when triggered below the Balance Line.
Any comments for improvement are welcome.
Fractal lines multi time framePlot lines using last two William's fractals to find trends, it supports different resolutions and alerts

Fractals ROC AlertI am playing William's Fractals and got an idea to calculate each fractal's strength by these rules:
- downFractal. FractalROC = (close - lowest(n+1))/(open【2*n】-lowest(n+1))
- upFractal FractalROC = (highest(n+1)-close)/(highest(n+1)-open【2*n】)
And set up a level to filter small fractals.
Bigger FractalROC, Stronger trend

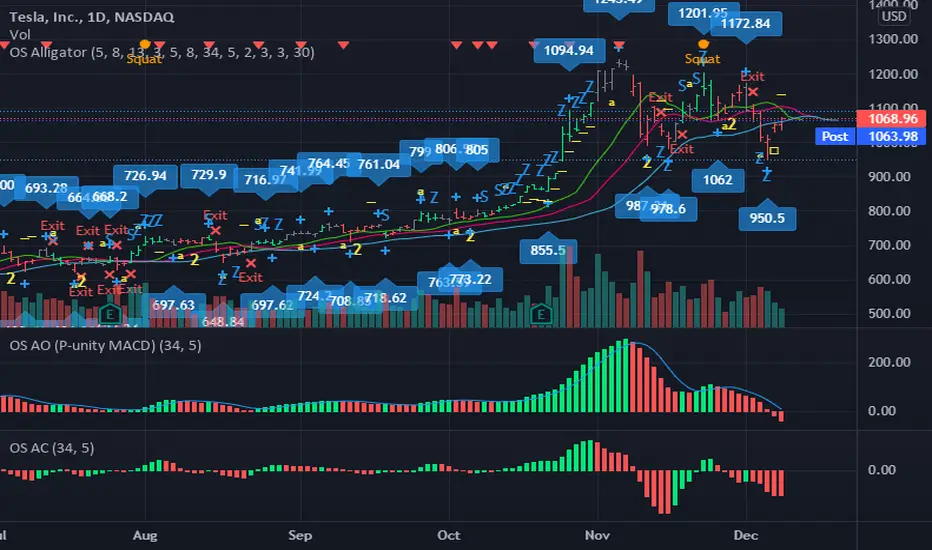
OS AlligatorOS Alligator includes Bill and Justine Williams´ indicators explained both in their "New Trading Dimensions" and "Trading Chaos: Second Edition" books. This script replicates the visual alerts shown on their graphs.
OS Alligator includes:
- Fractals (with labels for easy reading)
- Divergent Bars (signaled by top and bottom triangles)
- Zone bar colors (the bar is green when both AO and AC are green, red when both are red, and black when different)
- Zone buys and sells (subsequent AO of the same color), with letter Z
- Saucer buys and sells, with letter S
- Highest High and Lowest Low tracking (for traling stop setting)
- Balance line (Teeth) crossover alerts
and of course the Alligator's Mouth (Lips, Teeth, Jaw) with SMMA.
All these functions are customizable both in periods and in color. For example if you want to modify the Fractal or HiLo periods you can do so.
You can also add alerts based on any or all indicators.
Thank you for reading. Any comments for improvement are welcome.
-ownsov
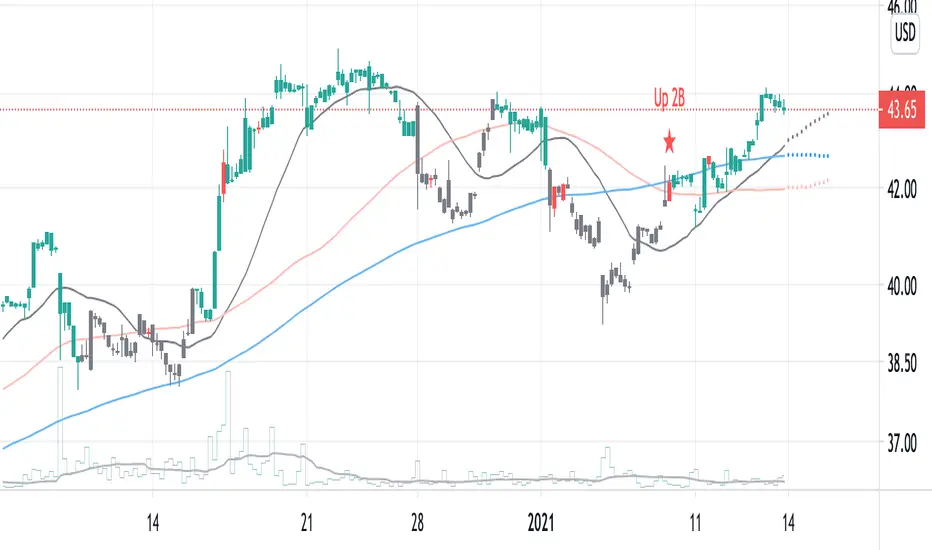
2B detector betaIdentifying a trend reversal is practically tricky, given that price movement is somewhat unpredictable and mostly obeys a power law. In which the price difference is primarily out of normal distribution. According to Benoit Mandelbrot, the price distribution follows an alpha-stable distribution with α equal to 1.7.
Real data observation suggests that stock prices do not follow the Random Walk Hypothesis or Brownian motion. Instead, they follow a fractal pattern. Fractals exhibit similar patterns at different scales called self-similarity. Using this character, one can develop fractal patterns to identify local highs and local lows.
This indicator identifies the reversal signal so-called 2B base on the following logic:
1. Identify local highs and local lows with fractals
2. Define relative positions of those local highs and lows (ABC and 2B)
3. Define the local range of ABC and B
Disclaimer: This indicator is only for research purposes. Please do not take it as investing or trading advice.
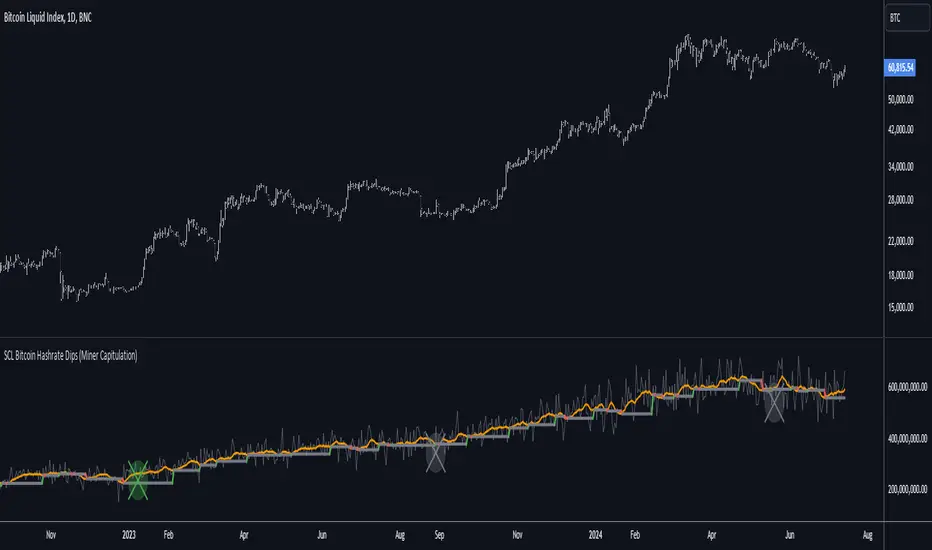
[SCL] Bitcoin Hashrate Dips (Miner Capitulation)Gives long-term buy signals for Bitcoin from dips and recoveries in the hashrate (the "miner capitulation" theory). It has an overlay and a standalone mode and is fully configurable. It uses Williams Lows and ATR instead of moving averages.
Features that might be interesting for Pinescripters:
+ Automatic (as far as is possible currently) adjustment of plots for overlay and standalone display modes.
+ A neat label function for debugging floats
+ Fully commented
+ The debug that I used to overcome problems in developing it is left in
+ Ideas for how to deal with a wildly oscillating and exponentially increasing data source
You need to run this indicator on the Bitcoin daily chart for it to make any sense. The best is a BTC/USD chart with a long history, such as BNC:BLX.
Trend LineBasic Trend Line base on fractals (v0.1)
Can not draw a line on the future X axis, So just a line segment but not a ray.
I don't have a better idea to upgrade...

Williams Fractals with Alerts by MrTuanDoanCustom William Fractals for alerts and educational purpose.
Added custom alerts for Williams Fractals.
Also added filter to show less fractals on chart.
The simple idea how I use fractals in Binary Option is to determine temporary resistance and support.
Simple strategy:
- Mark Resistance/Support on higher time frame (e.g. 5M)
- Set an alert for new fractal
- Whenever a new fractal that appears close to your marked Resistance/Support, go to lower time frame (e.g. 1M)
- Wait for rejection at the level that lower than new down fractal (or higher than new up fractal).
- Enter with the same expiry of lower time frame.
Good luck and happy trading. :-)

Williams Fractals, A simpler scriptA simpler script to filter fractals and support large range parameter.

Deep_Fractal_Signals_and_Rubber_Band_TradesThis indicator is based on Williams Fractals and the TopDog Trading "Rubber Band Trade"
The Deep Fractal Signals are triangles that indicate the price is forming a pattern of decreasing lows in a down trend (orange) or, increasing highs in an up trend (green).
The triangles are placed above or below the last bar of the pattern, unlike Fractals which are drawn 2 candles prior to the current candle, and are re-painted on the chart.
When the triangle is indicated above the moving average in a down trend (blue), or below the moving average in an up trend (yellow), this is a Rubber Band Trade.
When the slope of the moving average is less than the Gain set by the user, or are counter-trend, the triangles are plotted in silver.
When used in conjunction with the Power Analyzer indicator, a signal to the long side should be taken when the Power Analyzer momentum indicator is at a cycle low. Similarly, a signal to the short side should be taken when the indicator is at a cycle high.
The first, second or third signal in a new trend have the highest probability of a follow through.
The indicator sometimes gives a false signal at the very end of the trend, just before the market reverses. This is an attempt by the Market Makers to persuade traders that the trend will continue.
Please leave a comment and "Like" this indicator if you find it useful.
FX Engineering

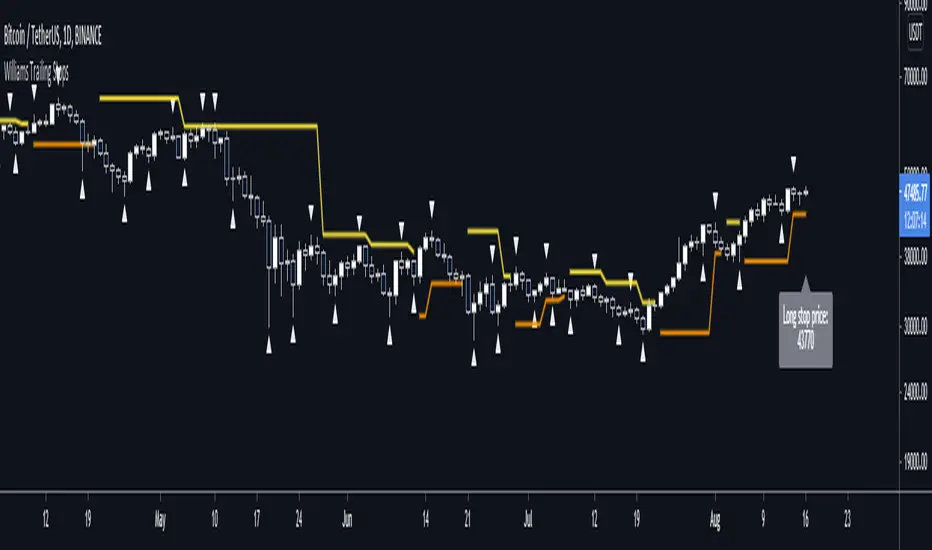
Williams Fractal Trailing StopsUnlike the built-in version, you can configure how many bars it takes to confirm a fractal. This indicator plots all Williams high and low fractals, and a stop line that trails the fractals up and down. Includes long and short stop alerts. You can choose whether the trail flips long-short based on the price being exceeded within a candle or on candle close. This indicator deals only with fractals and doesn't get into the Alligator or anything else.
I've commented it extensively, so that it might be useful for people learning Pinescript. Enjoy!

MultiTimeFrame Fractals D W M [xdecow]This indicator shows fractals in different timeframes. With the possibility of coloring the bars with any combination of current, daily, weekly and monthly timeframes.
The return points are calculated as follows:
high > last 3 highs and close above highest low
low < last 3 lows and closes below lowest high
The direction of higher timeframes fractals tend to be more durable and reliable. This indicator helps to find the fractal alignment of different timeframes, so that you can look for trade opportunities in the same direction as the higher timeframes and improve your chances.
