PI_GRM Bitcoin Golden Ratio Multipier [wozdux]Golden Ratio Multiplier
Formula GRM=MA350(BTC USD) * (1.6;2;3;5;8;13;21)
The multiplier examines medium-and long-term time cycles.
For this, a multiple of 350 MA is used to determine the areas of potential resistance.
Additionally, fibo levels from the main line.
version 2021 year modification
Wozdux

Time Wolna_2021_iun3[wozdux] Description of the Time_Wolna indicator
The indicator is designed to study the behavior of time. There are many indicators that study just the price, a little less indicators that study the volume of trading and vanishingly few indicators that study time.
This is not an oscillator, it does not have oversold or overbought levels. This indicator has an indefinite beginning and an indefinite end. Its value is not in the absolute values of the indicator, but in relative ones. This indicator calculates the time of price rise and the time of price decline. It clearly shows how long the price rises and how long the price falls.
The initial idea was to use my RSIVol indicator to study the time. Each bar is counted as a unit of time. If the price rises during the period of one bar, then one is added, if the price falls, then one is subtracted. By default, the blue line shows this time movement according to the RsiVol indicator.
The basic RsiVol indicator is shown at the bottom of the diagram. The bill goes along the blue line, which calculates the movement of the volume price. If the blue RSIVol line is above the yellow level, then the blue Time_Wolna time line is colored green. If the blue line in the base RsiVol indicator falls below the lower yellow level, then the blue time line of the Time_Wolna indicator turns red.
The result is a broken line that clearly shows the waves of rising and falling prices. In principle, the time indicator makes it easier to recognize waves.
It is known that time plays an important role in Elliott wave analysis, although in practice this is almost never done. The mention of Elliott is just a lyrical digression.
Time is very difficult to study. This indicator does not give clear buy or sell signals. This is just an analysis tool to help analysts.
In addition to the RsiVol indicator, simply the Rsi from the price and a simple moving average from the price are also used.
So, the settings of this indicator.
"switch Price == close <==> ( High+Low)/2" -- select the base price in all subsequent calculations
"Key EMA=> True=ema(Price); False=ema(Price*Volume)" --The key for switching the moving average from the price or from the volume price.
"T==> EMA(price, T)" --The period for calculating the moving average
" key red==> Yes/No Rsi")--the key turns on or off the RSI line red line
"key green==> Yes/No Orsi") --the key turns on or off the Volume RSI line green line
" key olive==> Yes/No RsiVol200 " -- the key enables or disables the Volumetric RSIVol200 olive line. This is RsiVol minus the 200-period moving average.
"keyVol blue==> Yes/No " - the key enables or disables the base blue line RSIVol
"keyVol blue==> V->tt(RsiVol) ->tt(ema(Price))"—The blue line selection will be calculated as the time from RSIVol or as the time from the moving average EMA.
"keyVol blue==> : 1=Time, 2=Time* price, 3=Time*(Ci-Ck) 4=Time*Volume, 5=Time*price*Volume")- selection for the blue baseline. By default, the time of the price rise or fall is calculated simply. Key=1. But you can investigate the joint influence of time and price and then the key is=2. If we study the combined effect of time and price changes per bar, then the key=3. If we study the joint influence of time and volume, then the key=4. If we study the joint influence of time, price and volume, then the key=5.
"key RsiO red + green==> : 1=Time, 2=Time*Price, 3=Time*(Ci-Ck) 4=Time*Volume, 5=Time*Price*Volume") - - - similar settings for the red green line. By default, the time of the price rise or fall is calculated simply. Key=1. But you can investigate the joint influence of time and price and then the key is=2. If we study the combined effect of time and price changes per bar, then the key=3. If we study the joint influence of time and volume, then the key=4. If we study the joint influence of time, price and volume, then the key=5.
"Key Color – - here you can disable changing the color of the blue line to green or red when the base indicator RsiVol exits above the upper and below the lower levels.
"Level nul ==> * Down Level Rsi - screen configuration in order to raise or lower chart
"Level nul ==> * Down Level ORsi -- beauty setup in order to raise or lower chart
"Level nul ==> * DownLevel RsiVol200 -- beauty setup in order to raise or lower chart
"blue =volume * price" – period for calculation of volumetric rates
"blue => RSIVOL(Volume*price,len) and EMA" – the period for calculating RsiVol
"blue__o1=> ema ( RSIVOL, o1)" – additional smoothing RsiVol
"red=rsi (Price,14)" – the period for calculating Rsi
"red= ema ( RSI ,3)" -- additional smoothing Rsi
"fuchsia__ => RsiVol200 (vp,200)" - the period for calculating RsiVol200
"fuchsia__o2=> ema ( RSIVOL200 , o2)" -- additional smoothing RsiVol200
To study the time between two fixed dates. Setting the start point of the calculation and the end point of the calculation
"Data(0)=Year" – the year of the start date
"Data(0)= Month" – the month of the start date
"Data (0)=Day" the day of the start date
"Data(1)=Year" – the year of the end date.
"Data(1)=Year" – month of the end date.
"Data(1)=Day" -- the day of the end date.
--------русский вариант описания ------
Описание индикатора Time_Wolna
Индикатор призван изучать поведение времени. Есть много индикаторов изучающих просто цену, немного меньше индикаторов изучающих объем торгов и исчезающе мало индикаторов, изучающих время.
Это не осциллятор у него нет уровней перепроданности или перекупленности. Данный индикатор имеет неопределенное начало и неопределенный конец. Ценность его не в абсолютных значениях индикатора, а в относительных. Этот индикатор высчитывает время подъема цены и время снижения цены. Он наглядно показывает сколько времени цена поднимается и сколько времени цена опускается.
Первоначальная идея была использовать мой индикатор RSIVol для изучения времени. Каждый бар считается за единицу времени. Если цена поднимается за период одного бара, то прибавляется единица, если цена опускается, то вычитается единица. По умолчанию голубая линия показывает такое движения времени по индикатору RsiVol.
Внизу на диаграмме показан базовый индикатор RsiVol. Счёт идет по синей линии, которая вычисляет движение объемной цены. Если синяя линия RSIVol находится выше желтого уровня, то голубая линия времени Time_Wolna окрашивается в зеленый цвет. Если синяя линия в базовом индикаторе RsiVol опускается ниже нижнего желтого уровня, то голубая линия времени индикатора Time_Wolna окрашивается в красный цвет.
В результате получается ломанная линия, четко показывающая волны восхождения и снижения цены. В принципе индикатор времени позволяет легче распознавать волны.
Известно, что время играет важную роль в волновом анализе Эллиотта, хотя на практике это почти никогда не делается. Упоминание Эллиотта это просто лирическое отступление.
Время очень трудно изучать. Этот индикатор не дает четких сигналов на покупку или продажу. Это всего лишь инструмент анализа в помощь аналитикам.
Кроме индикатора RsiVol, используются и просто Rsi от цены и простая скользящая средняя от цены.
Итак, настройки данного индикатора.
"switch Price == close <==> ( High+Low)/2" -- выбираем базовую цену во всех последующих вычислениях
"Key EMA=> True=ema(Price); False=ema(Price*Volume)" --Ключ переключения скользящей средней от цены или от объемной цены.
" T==> EMA(price,T)"--Период вычисления скользящей средней
"key red==> Yes/No Rsi")--ключ включает или выключает линию RSI красная линия
"key green==> Yes/No Orsi") --ключ включает или выключает линию Объемной RSI зеленая линия
"key olive==> Yes/No RsiVol200" -- ключ включает или выключает линию Объемной RSIVol200 оливковая линия. Это RsiVol минус 200-периодная скользящая средняя.
"keyVol blue==> Yes/No " – ключ включает или выключает базовую голубую линию RSIVol
"keyVol blue==> V->tt(RsiVol) ->tt(ema(Price))"—выбор голубая линия будет вычисляться как время от RSIVol или как время от скользящей средней EMA.
"keyVol blue==> : 1=Time, 2=Time* price, 3=Time*(Ci-Ck) 4=Time*Volume, 5=Time*price*Volume")—выбор для голубой базовой линии. По умолчанию вычисляется просто время подъема или опускания цены. Ключ=1. Но можно исследовать совместное влияние времени и цены и тогда ключ=2. Если изучаем совместное влияние времени и изменения цены за один бар, то ключ=3. Если изучаем совместное влияние времени и объема, то ключ=4. Если изучаем совместное влияние времени, цены и объема, то ключ=5.
"key RsiO red + green==> : 1=Time, 2=Time*Price, 3=Time*(Ci-Ck) 4=Time*Volume, 5=Time*Price*Volume") ---аналогичные настройки для красной зеленой линии. По умолчанию вычисляется просто время подъема или опускания цены. Ключ=1. Но можно исследовать совместное влияние времени и цены и тогда ключ=2. Если изучаем совместное влияние времени и изменения цены за один бар, то ключ=3. Если изучаем совместное влияние времени и объема, то ключ=4. Если изучаем совместное влияние времени, цены и объема, то ключ=5.
"Key Color" – здесь можно отключить изменение цвета голубой линии на зеленый или красный в моменты выхода базового индикатора RsiVol выше верхнего и ниже нижнего уровней.
"Level nul ==> * Down Level Rsi - косметическая настройка для того, чтобы поднять или опустить график
"Level nul ==> * Down Level ORsi -- косметическая настройка для того, чтобы поднять или опустить график
"Level nul ==> * DownLevel RsiVol200 -- косметическая настройка для того, чтобы поднять или опустить график
" blue =>volume * price" – период для вычисления объемной цены
" blue => RSIVOL(Volume*price,len) and EMA" – период для вычисления RsiVol
"blue__o1=> ema ( RSIVOL, o1)" – дополнительное сглаживание RsiVol
" red=rsi (Price,14)" – период для вычисления Rsi
" red= ema ( RSI ,3)" -- дополнительное сглаживание Rsi
"fuchsia__ => RsiVol200 (vp,200)" -- период для вычисления RsiVol200
"fuchsia__o2=> ema ( RSIVOL200 , o2)" -- дополнительное сглаживание RsiVol200
Для исследования времени между двумя фиксированными датами. Задаем начальную точку вычисления и конечную точку вычисления
"Data(0)=Year" – год начальной даты
"Data(0)= Month" – месяц начальной даты
"Data(0)=Day" день начальной даты
"Data(1)=Year" – год конечной даты.
"Data(1)=Year" – месяц конечной даты.
"Data(1)=Day" -- день конечной даты.

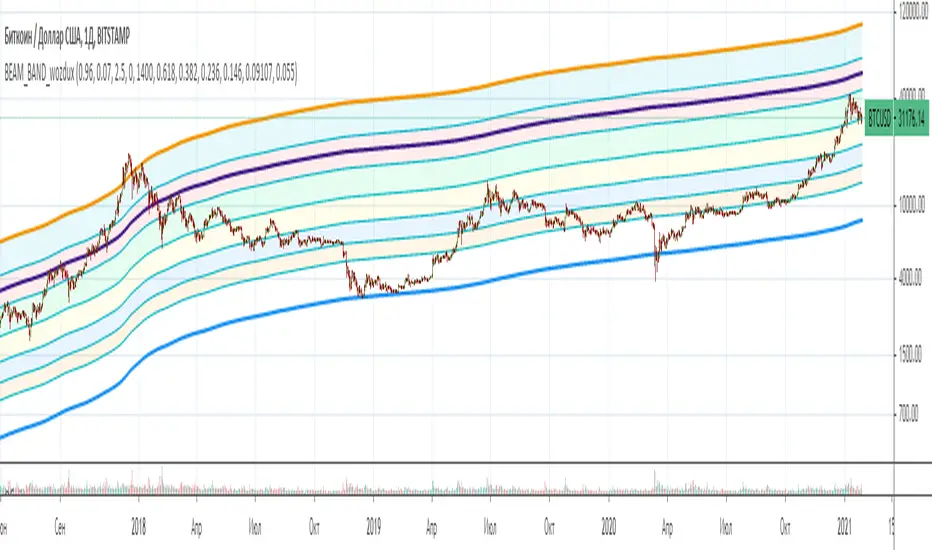
BEAM_BAND_wozdux.2021_1[wozdux]The indicator, which tracks the cycles of Bitcoin.
The corridor between the upper and lower levels is marked by the fibonacci levels. Additional fibonacci levels become support or resistance levels as the price moves.
Top level-determines the width of the channel.
Bottom level-defines the main bottom line.
The number of bars is the value of the bitcoin cycle. This is an empirical selected value. for other amount of cryptocoins, it is necessary to pick apart.
The formula for calculating this indicator is taken from the article THE BEAM INDICATOR. In addition, I extended this indicator with fibonacci levels in order to segment the price movement between the levels of the BAEM channel.
///////////////////////////////////////////
Индикатор, отслеживающий циклы Биткоина. Коридор между верхним и нижним уровнем размечен уровнями фибоначчи.
Дополнительные уровни фибоначчи становятся уровнями поддержки или сопротивления в процессе движения цены.
Уровень верха - определяет ширину канала.
Уровень низа - определяет основную нижнюю линию.
Цикл количество баров - это величина цикла биткоина. Это эмпирическая подобранная величина, для других криптомонет её нужно подбирать отдельно.
Формула для вычисления данного индикатора взята из статьи THE BEAM INDICATOR. Кроме того, я расширила этот индикатор уровнями фибоначчи для того, чтобы сегменты движения цены между уровнями канала BAEM.
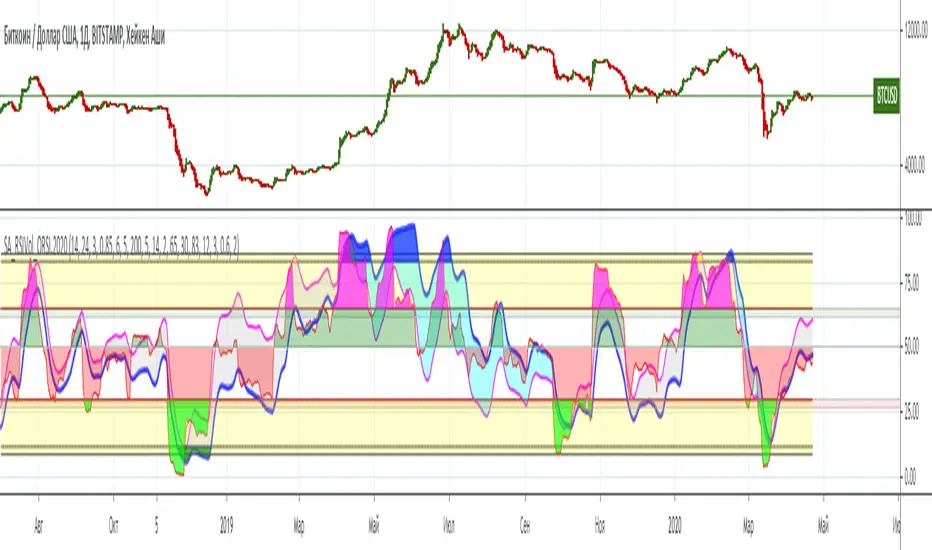
SA_RSIVolume_ORSI.2020.bibl[wozdux] Description of the SA_RSIvol_ORSI indicator
The rsivol indicator has undergone changes and additions. Since this modified indicator is used in the video, I publish it with explanations.
First add-on
In order to eliminate some delay in the rsivol blue line, A rsivol with a period of 200 was introduced. Then this line became some long-term reference and the regular RSIVOL was divided into RSIVOL200. The result is a pink line. In the indicator, it is indicated as RSIVOL200 by a pink line.
Second addition
In the old indicator, the rsivol parameter itself is calculated as the RSI of the conditional volume price. This volume price is calculated as the average product of the price per volume divided by the average volume for a certain period.
OS=ema (volume*cena, TT)/ ema(volume, TT)
Here, an exponential moving average is used to calculate the volume price. Then the RSI function is taken from this calculated price. As we know from the meaning of the RSI, this is the percentage of purchases from the sum of all transactions or the intensity of purchases. Using volume prices instead of simple prices, we get a more truthful picture of purchases in the market.
So, the EMA itself is good, but it tends to be late. There is another formula for calculating the moving average, which contains the advantages of the EMA and does not have its disadvantages. This function is ALMA.
An alternative way to calculate the volume price is to use the ALMA function instead of the EMA. In this function, in addition to the period, two additional parameters are used.
ALMA(xx, TT,ss,kk)
In the indicator, it is possible to simultaneously see the RSIVOL lines, both with EMA and ALMA.
The third addition
Similarly, you can use ALMA instead of EMA to calculate a simple price RSI. However, there were no interesting results for the price RSI. In the indicator, I left the option to see how it looks just for information. If you are interested, you can watch it.
The fourth addition
The fourth addition concerns the regular RSI. The function itself has been changed. The built-in RSI function is re-created and named ORSI. It is supplemented with volume. In other words, ORSI calculates the purchase rate based on volume, but in a different way than RSIVOL. As a result, we have two lines of RSI and ORSI simultaneously. The price RSI shows the rate of price increase. Volume ORSI shows the rate of volume engagement. The greater the difference between these indicators, the stronger the trend in one direction or another. These two speeds are represented as two lines with the area between them filled in with color.
The indicator also shows a different way of displaying it: a histogram of the difference between these speeds. You can turn the histogram on or off.
New line coloring
The RSI and ORSI chart is made as a colored area above and below the 50 level. Above the level, the color is green, below the level, the color is red.
How do I use the indicator?
The indicator is used just like any other. We are looking for divergences between the indicator lines and the price chart.
RSIVOL200 responds faster to a trend reversal. The divergences on RSIvol200 are clearer.
RSI-ORSI . You can use either one option or the other for trading. Everyone chooses the most convenient one.
Sharing or as a histogram of the difference allows you to see the market picture more subtly.
I have not yet studied this indicator in all its manifestations. I suggest that everyone who wants to do this.
SETTINGS
switch close <==> ( H+L)/2 == switch KEY to select the price type
blue RSIVOL= switch the color of the fields == enable / disable rsivol coloring above and below levels
blue => vp=volume * price === period for calculating the volume price
blue => RSIVOL(vp,len) === period for calculating RSIVOL
blue RSIVOL KEY === enable / disable rsivol line
blue _RSIVOL_ to include the width LINE === enable the RSIVOL line as a ribbon
blue_RSIVOL_ line width == = ribbon width
blue _RSIVOL => EMA(true) or ALMA(false) coefficients ( kk, ss) = = = use EMA or ALMA to calculate the volume price. By default, ALMA, when the button does not have a check mark.
ALMA-->kk=={0,1} = = = coefficient for the formula ALMA with a range of changes from 0 to 1
ALMA-->ss=={1.10} = = = coefficient for the formula ALMA with a range of changes from 1 to 10
key => and-and RSIVOL(ema) blue + RSIVOL (alma) black === This key allows you to display both RSIVOL lines on the chart simultaneously as both ema and alma.
blue__o1=> ema ( RSIVOL, o1) = = = additional rsivol smoothing after all calculations
fuchsia RSIVOL ( 200 ) = rsivol/rsivol200 = = = enable RSIVOL200
fuchsia__ => RsiVol200 (vp, 200) === period for calculating RSIvol200
fuchsia__o2=> ema ( RSIVOL200 , o2) = = = additional rsivol200 smoothing
key red => rsi(close) === disable key RSI
key => or-or price RSI <--> volume ORSI ===key for displaying the RSI or ORSI
key => and-and price RSI + volume ORSI = = = key for displaying both RSI and ORSI
red=rsi (close, 14) === period for calculating the RSI and ORSI
red= ema ( RSI, 2) = = additional smoothing of RSI and ORSI
key ==> histogram of the difference (RSI-ORSI) === enable displaying the RSI-ORSI difference histogram
yellow line level_UP_ _ rsi === upper level for RSI-ORSI
yellow line level_DOWN_ _ rsi== = lower level for RSI-ORSI
level_UP_rsivol == top level for RSIvol
level_DOWN_rsivol == lower level for RSIvol
RSI => replace EMA true --> ALMA(kk, ss) false== replace EMA with ALMA in the RSI calculation
ALMA=>kk=={0,1} = = = coefficient of alma
ALMA=>ss=={1.10} = = = coefficient of alma
======Описание на русском языке=========
Описание индикатора SA_RSIvol_ORSI
Индикатор RSIVOL претерпел изменения и дополнения. Поскольку этот измененный индикатор используется в видео, то публикую его с пояснениями.
Первое дополнение
Для того, чтобы устранить некоторое запаздывание синей линии RSIVOL, была введена RSIVOL с периодом 200. Затем эта линия стала некоторым долгосрочным эталоном и обычную RSIVOL разделили на RSIVOL200. В результате получилась розовая линия. В индикаторе она обозначена как RSIVOL200 розовой линией.
Второе дополнение
В старом индикаторе сам параметр RSIVOL вычисляется как RSI от условной объемной цены. Эта объемная цена вычисляется как усредненное произведение цены на объем, деленное на усредненный объем за какой-то период.
ОС=ema(volume*cena, TT)/ ema(volume,TT)
Здесь для вычисления объемной цены используется экспоненциальная скользящая средняя. Далее от этой вычисленной цены берется функция RSI. Как мы знаем по смыслу RSI это доля закупок от суммы всех сделок или интенсивность закупок. Используя объемную цены вместо простой цены, мы получаем более правдивую картину закупок на рынке.
Так вот, сама по себе EMA хорошая, но она имеет свойство запаздывать. Существует другая формула вычисления скользящей средней, которая содержит достоинства EMA и отсутствуют её недостатки. Эта функция ALMA.
Альтернативным способом вычисления объемной цены является использование вместо EMA функции ALMA. В этой функции, кроме периода используются дополнительные два параметра.
ALMA(xx,TT,ss,kk)
В индикаторе есть возможность одновременно видеть линии RSIVOL , как с EMA, так и ALMA.
Третье дополнение
Аналогично для вычисления простой ценовой RSI можно использовать ALMA вместо EMA. Однако для ценовой RSI интересных результатов не получилось. В индикаторе я оставила возможность посмотреть, как это выглядит просто для информации. Кому интересно, можете посмотреть.
Четвертое дополнение
Четвертое дополнение касается обычной RSI. В саму функцию внесены изменения. Встроенная функция RSI сделана заново и названа ORSI. Она дополнена объемом. Иначе говоря, ORSI вычисляет скорость закупок с учетом объема, но другим способом, чем RSIVOL. В результате, имеем две линии RSI и ORSI одновременно. Ценовая RSI показывает скорость наращивания цены. Объемная ORSI показывает скорость вовлечения объема. Чем больше разница между этими показателями, тем сильнее тренд в ту или иную сторону. Эти две скорости представлены как две линии, область между которыми заполнена цветом.
В индикаторе представлен и другой способ отображения: гистограмма разницы между этими скоростями. Гистограмму можно включить или выключить.
Новая раскраска линий
График RSI и ORSI выполнен как окрашенная область над и под уровнем 50. Над уровнем окраска зеленым цветом, под уровнем окраска красным цветом.
Как использовать индикатор?
Индикатор используется также, как любой другой. Ищем дивергенции между линиями индикатора и ценовым графиком.
RSIVOL200 быстрее реагирует на разворот тренда. Дивергенции на RSIvol200 более четкие.
RSI-ORSI . Можно использовать либо один вариант, либо другой для торговли. Каждый выбирает для себя наиболее удобный.
Совместное использование или в виде гистограммы разницы позволяет более тонко видеть картину рынка.
Я еще не изучила данный индикатор во всех его проявлениях. Предлагаю это сделать каждому, кто пожелает.
НАСТРОЙКИ
switch close <==> ( H+L)/2 == КЛЮЧ переключатель для выбора типа цены
blue RSIVOL= switch the color of the fields == включить / выключить окраску RSIVOL над и под уровнями
blue => vp=volume * price === период для вычисления объемной цены
blue => RSIVOL(vp,len) === период для вычисления RSIVOL
blue RSIVOL KEY === включить \ выключить линию RSIVOL
blue _RSIVOL_ to include the width LINE === включить линию RSIVOL в виде ленты
blue_RSIVOL_ line width ===ширина ленты
blue _RSIVOL => EMA(true) or ALMA(false) coefficients ( kk, ss) === использовать EMA или ALMA для вычисления объемной цены. По умолчанию ALMA, когда на кнопке нет галочки.
ALMA-->kk=={0,1} === коэффициент для формулы ALMA с диапазоном изменения от 0 до 1
ALMA-->ss=={1,10} === коэффициент для формулы ALMA с диапазоном изменения от 1 до 10
key => and-and RSIVOL(ema) blue + RSIVOL (alma) black === Этот ключ позволяет отобразить на графике обе линии RSIVOL одновременно и как ema и как alma.
blue__o1=> ema ( RSIVOL, o1) === дополнительное сглаживание RSIVOL после всех вычислений
fuchsia RSIVOL ( 200 ) = rsivol/rsivol200 === включить RSIVOL200
fuchsia__ => RsiVol200 (vp,200) === период для вычисления RSIvol200
fuchsia__o2=> ema ( RSIVOL200 , o2) === дополнительное сглаживание RSIvol200
key red => rsi(close) === ключ выключения RSI
key => or-or price RSI <--> volume ORSI ===ключ для отображения RSI или ORSI
key => and-and price RSI + volume ORSI === ключ для отображения одновременно RSI и ORSI
red=rsi (close,14) === период вычисления RSI и ORSI
red= ema ( RSI ,2) == дополнительное сглаживание RSI и ORSI
key ==> histogram of the difference (RSI-ORSI) === включить отображение гистограммы разницы RSI-ORSI
yellow line level_UP__rsi === верхний уровень для RSI-ORSI
yellow line level_DOWN__rsi=== нижний уровень для RSI-ORSI
level_UP_rsivol == верхний уровень для RSIvol
level_DOWN_rsivol == нижний уровень для RSIvol
RSI => replace EMA true --> ALMA(kk,ss) false== заменить EMA на ALMA в вычислении RSI
ALMA=>kk=={0,1} === коэффициент alma
ALMA=>ss=={1,10} === коэффициент alma
LinReg-Bitcoin's Power Oscillator.2019.01[wozdux]Bitcoin power oscillator from Harold Christopher Burger.
Since the first day of history is the most important, it is not correct to use this indicator on young exchanges with a short history.
The oscillator is calculated based on regression lines from the first day of history to the current day. The way of calculation of the oscillator. First, the regression line from the first day of history to the current bar is calculated for each bar.
Thus, for each bar, the formula of a straight regression line of the form Y=b*x + a is calculated. Where x is the number of days elapsed from the beginning of the history to the current drill. Y is the bitcoin price of the current day (bar) on the regression line. Thus, Y Is the predicted bitcoin price that would have to be. The second stage of calculation. Now we have the real price of bitcoin for the current day and the predicted price by the regression line. We calculate the ratio of the real price to the predicted one and take the logarithm of the obtained value. G=log10(Close/Y). This value is drawn in the form of a graph of the bitcoin power oscillator. The resulting oscillator oscillates in a constant range of values from -1 to +1.
This oscillator clearly captures the moments of price reversal. At the tops, the reversal occurs when the oscillator reaches the value range from 0.6 to 0.8. In the lowlands, the reversal occurs in the range of values from -0.8 to -0.4.
Indicator setting-description of buttons from top to bottom.
1) Raise the chart by X units. This is a corrective point in order to raise the chart above/below the zero line
2) Offset the start day of the story. The first day of history is the point relative to which all regression lines, all bars are calculated. This point can be slightly corrected by shifting the initial day to the left for a certain number of days.
3) button to switch between different ways to calculate the offset (A) in the formula Y=b*x + A.
4) the Orange level is the trend line of the historical power oscillator troughs. The orange level is an inclined level of price reversal from the bottom up.
5) the Green level is an important area of likely bitcoin price reversal at the tops.
6) the Red level is the horizontal level of the price reversal from the bottom up.
....
Осциллятор мощности биткоина от Harold Christopher Burger. "Это моя попытка воспроизвести вычисления данного генератора методами Pine Script .
Поскольку первый день истории имеет самое важное значение, то использовать данный индикатор на молодых биржах с короткой историей будет не корректно.
Осциллятор вычисляется на основе линий регрессии от первого дня истории до текущего дня. Путь вычисления осциллятора. Сначала для каждого бара вычисляется линия регрессии от первого дня истории до текущего бара.
Таким образом, для каждого бара вычисляется формула прямой линии регрессии вида Y=b*x + a. Где х -это количество дней, прошедших от начала истории до текущего бура. Y- это цена биткоина текущего дня (бара) на линии регрессии. Таким образом, Y- Это предсказанная цена биткоина, которая должна была бы быть. Второй этап вычисления. Теперь у нас есть реальная цена биткоина на текущий день и предсказанная цена линией регрессии. Вычисляем отношение реальной цены к предсказанной и берем логарифм , полученнного значения. G=log10(Close/Y). Это значение рисуем в виде графика осциллятора мощности биткоина. Полученный осциллятор колеблется в постоянном диапазоне значений от -1 до +1.
Данный осциллятор четко отлавливает моменты разворота цены. На вершинах разворот происходит тогда, когда осциллятор достигает области значения от 0.6 до 0.8. В низинах разворот происходит в области значений от -0.8 до -0.4.
Настройка индикатора - описание кнопок сверху вниз.
1 ) Поднять график на Х единиц. Это корректирующий пункт для того, чтобы приподнять график выше/ниже относительно нулевой линии
2) Смещение начального дня истории. Первый день истории -это та точка оносительно которой вычисялются все линиии регрессии, всех баров. Эту точку можно немного подкорректировать, сместив начальный день влево на какое-то количество дней.
3) Кнопка переключения между разными способами вычисления смещения (A) в формуле Y=b*x + A.
4) Оранжевый уровень - это линия тренда исторических впадин осциллятора мощности. Оранжевый уровень это наклонный уровень разворота цены снизу вверх.
5) Зеленый уровень - это важная область вероятного разворота цены биткоина на вершинах.
6) Красный уровень -это горизонтальный уровень областей разворота цены снизу вверх.

Kringold2[WOZDUX] gold equivalentThe indicator is a tool for global analysis. The default is the price of gold. The price of the instrument from the main window is divided by the price of gold. The result is the price of the instrument in units of gold. The screen uses the Dow Jones index as an example. In the indicator window, the price of the index in units of gold or the so-called gold Dow Jones. The use of the gold equivalent makes it possible to see more truthful trends. The Indicator has the ability to change gold to any other equivalent. It is enough to change the name of the exchange and the name of the instrument in the options tool and exchange. In addition, in the settings, the second box on top allows you to view the graph in a linear or logarithmic scale. The first box at the top switches the line chart or the CCI =WT indicator to this chart.
-------------------------------------------
Индикатор это инструмент для глобального анализа. По умолчанию используется цена золота. Цена инструмента из основного окна делится на цену золота. В результате получается цена инструмента в единицах золота. На экране для примера используется индекс Доу джонса. В окне индикатора цена индекса в единицах золота или так называемый золотой Доу Джонс. Использование золотого эквивалента дает возможность видеть более правдивые тенденции движения. В Индикаторе есть возможность поменять золото на любой другой эквивалент. Достаточно в опциях инструмент и биржа изменить название биржи и название инструмента. Кроме того, в настройках, второй бокс сверху дает возможность смотреть график в линейном или логарифмическом масштабе. Первый бокс сверу переключает линейный график или индикатор CCI =WT к данному графику.

RSI_SpeedUp_Volume measures the speed of purchases.If the RSI indicator shows the dominance of purchases over sales, it is interesting to know the speed of purchases. We calculate the speed using the wt indicator. We compute WT (RSI,len). Setting and designation of indicator RSI_SpeedUP. The RSI lines you are looking for are shown in smooth lines. The speed is shown by stepped lines.
In the indicator RSI and speed are calculated in two ways. The first method-calculations are made from the closing price.
The second way is from the volume price. Volume price is the closing price multiplied by volume. Basic settings of the RSI_SpeedUp-V indicator (1,24,9,40,14). What they mean?
RSI is calculated for two periods 24 and 9. The first parameter in the setting is "1", that the display of lines will be from the first period = 24. If the parameter is "2", the lines will be displayed from the second period = 9.
If the parameter is "3", the display will be simultaneously from both periods.
The fourth parameter " 40 " shows the width of the green and pink areas.
The fifth parameter " 14 " is the period with which the wt rate is calculated(rsi,14).
By default, the indicator window displays only the rates from the simple price and the volume price. In order to enable the display of RSI lines, press the "vkl RSI"button.
The blue line is RSI (close). Blue line-RSI (close*volume). Stepped green-speed from simple price wt(rsi (close)). Step brown line-speed from the volume price wt(rsi (close*volume)).
How to use. The volume price starts to react to the trend change earlier. Long before the reversal, it changes its direction. Comparison with the simple price speed line gives additional information about the market mood.
Good luck with your trading.
--------------------------
Если индикатор RSI показывает доминирование покупок над продажами, то интересно знать скорость покупок. Скорость мы вычисляем с помощью индикатора WT. Мы вычисляем WT ( RSI,len). Настройки и обозначения индикатора RSI_SpeedUP. Искомые линии RSI показаны гладкими линиями. Скорость показана ступенчатыми линиями.
В индикаторе RSI и скорость вычисляются двумя способами. Первый способ - вычисления производятся от цены закрытия. Второй способ от объемной цены. Объемная цена это цена закрытия умноженная на объем. Базовые настройки индикатора RSI_SpeedUp-V (1,24,9,40,14). Что они означают?
RSI вычисляется для двух периодов 24 и 9. Первый параметр в настройке "1" , что отображение линий будет от первого периода = 24. Если параметр "2", то отображение линий будет от второго периода = 9. Если параметр "3", то отображение будет одновременно от обоих периодов.
Четвертый параметр "40" показывает ширину области зеленой и розовой.
Пятый параметр "14" это период с которым вычисляется скорость wt(rsi,14).
По умолчанию в окне индикатора отображаются только скорости от простой цены и от объемной цены. Для того чтобы включить отображение линий RSI надо нажать кнопочку "vkl RSI".
Синяя линия - RSI (close). Голубая линия - RSI (close*volume). Ступенчатая зеленая - скорость от простой цены wt(rsi(close)). Ступенчатая коричневая линия - скорость от объемной цены wt(rsi(close*volume)).
Как пользоваться. Объемная цена раньше начинает реагировать на изменение тенденции. Задолго до разворота она изменяет своё направление. Сравнение с линией скорости простой цены дает дополнительную информацию о настроении рынка.
Успехов Вам в торговле.

WT3 speedup[WOZDUX]=Velocity and acceleration of the CCIModification of the CCI indicator WT3.
1) three indicators in one window. "kluch2" includes display 2 additional lines.
2) you can calculate the indicator by closing price and you can calculate the volume price. The key is the "key" includes the calculations according to the bulk price.
3) "kluchperegib" shows inflection points
4) For the line with the period "n1" the width of the channel on which it moves is calculated. The channel helps to track the boundaries of fluctuations.The channel width is Set in the "lband" variable.
5)" obLevel1 " defines the critical levels for the cci indicator.
6) since the meaning of the cci indicator and its modification wt is that it is the speed of price movement. Calculate the acceleration of prices. the variable "nwt"is used for this purpose.
The lilac line shows the acceleration of the price. Acceleration used to warn us about the reversal of the movement.
The General line of the indicator and the acceleration line together give more accurate information about the market mood. If the acceleration falls from top to bottom in advance, then wait for a quick price reversal from top to bottom. If the acceleration starts to rise from the bottom up, then also wait for a turn from the bottom up.
---------------
Скорость и ускорение CCI .
Модификация индикатора CCI под названием wt.
1) три индикатора в одном окне. "kluch2" включает дисплей 2 дополнительных линий.
2) Вы можете рассчитать индикатор по цене закрытия, и вы можете рассчитать цену объема. Ключ "ключ" включает в себя расчеты по объемной цене.
3)" kluchperegib " показывает пункты перегиба
4) Для линии с периодом "n1" рассчитывается Ширина канала, по которому она движется. Канал помогает отслеживать границы колебаний.Ширина канала Задается в переменной "lband".
5) "obLevel1" определяет критические уровни для индикатора cci.
6) так как смысл индикатора cci и его модификации wt заключается в том, что это скорость движения цены. Рассчитаем ускорение цены. для этого используется переменная "nwt".
Сиреневая линия показывает ускорение цены. Ускорение раньше предупреждало нас о развороте движения.
Общая линия индикатора и линия ускорения вместе дают более точную информацию о настроении рынка. Если ускорение падает сверху вниз заранее, то ждите быстрого разворота цены сверху вниз. Если ускорение начинает подниматься снизу вверх, то также ждите разворота снизу вверх.
