Pro Rata Volume (PRV)Pro Rata Volume (PRV): pro rata volume is a volume indicator that extrapolates the volume of the current bar to the time span of the bar of a time-based chart.
X-volume

Volume Density w/barcolorOpacity limit set to 70 min & barcolor overlay
The transparency of each candle is based on volume density.
Volume density is calculated as follows.
Volume density = Volume / Price range
Price range uses true range "max(high - low, abs(high - close), abs(low - close))".
Since volume density varies drastically by stock or time, the transparency is calculated based on the deviation rate from the average volume density.
Volume Weighted Reversal BandsThis is a vwap & vwma hybrid with upper & lower deviation bands that provide excellent price channels and reversal areas. It can be used on lower & higher timeframes, just increase the deviation % for higher timeframes. Try out the 1 minute timeframe with .5% deviation for great scalping levels.
Here is the calculation used for the main line.
(VWMA100 + VWMA500 + VWMA1000 + VWAP) / 4
So it combines 3 VWMAs with the VWAP and divides that number by 4 to give us a moving average. Then we add new levels above and below that moving average to get our channels. The channels are separated by the % deviation you choose in the settings. For tighter bands, lower the percentage deviation and for wider bands, increase the percentage deviation.
The fattest line in the middle is the main moving average and you can expect price to regularly return to this level. The thick lines are the main moving average plus or minus the percentage deviation you have set. There are 10 levels in each direction from the main moving average. The is also a thin short term moving average as well with a custom calculation. It takes 4 different length moving averages that are weighted and 4 more that are volume weighted and divides the total by 8.The lines will be green when price is above the line and red when price is below the line. The thin white line is the VWAP on its own.
These lines will act as dynamic support and resistance so you can scalp them back and forth. These levels work so well because they are volume weighted and the algos hedge their positions back and forth constantly.
For best results, use this indicator on tickers with the highest volume and trading action as the price will stick to these levels better when the big money players are hedging. Some great tickers for this indicator are APPL, SPY, BTC, ETH.
All colors and linewidths can be customized in the settings easily as well as turning off the VWAP or short moving average and adjusting the percentage deviation for the channels.
***MARKETS***
This indicator can be used on all markets, including stocks, crypto, futures and forex.
***TIMEFRAMES***
This indicator can be used on all timeframes.
***TIPS***
Try using numerous indicators of ours on your chart for extra confirmation. Our favorites to pair with these bands are the Scalper Ribbon and Trend Friend Signals. The 3 combined give you a lot of extra confirmation on whether the market is going to reverse at these levels.

MFI + Realtime DivergencesMoney Flow Index (MFI) + Realtime Divergences + Alerts
This version of the MFI indicator adds the following 5 additional features to the stock MFI:
- Optional divergence lines drawn directly onto the oscillator in realtime.
- Configurable alerts to notify you when divergences occur.
- Configurable lookback periods to fine tune the divergences drawn in order to suit different trading styles and timeframes, including the ability to enable automatic adjustment of pivot period per chart timeframe.
- Background colouring option to indicate when the MFI oscillator has crossed above or below its centerline, or optionally when both the MFI has crossed its centerline and an external oscillator, which can be linked via the settings, has also crossed its centerline.
- Alternate timeframe feature allows you to configure the oscillator to use data from a different timeframe than the chart it is loaded on.
This indicator adds additional features onto the standard MFI , whose core calculations remain unchanged. Namely the configurable option to automatically, quickly and clearly draw divergence lines onto the oscillator for you as they occur in realtime. It also has the addition of unique alerts, so you can be notified when divergences occur without spending all day watching the charts. Furthermore, this version of the TSI comes with configurable lookback periods, which can be configured in order to adjust the sensitivity of the divergences, in order to suit shorter or higher timeframe trading approaches.
What is the Money Flow Index ( MFI )?
Investopedia describes the True Strength Indicator as follows:
“The Money Flow Index ( MFI ) is a technical oscillator that uses price and volume data for identifying overbought or oversold signals in an asset. It can also be used to spot divergences which warn of a trend change in price. The oscillator moves between 0 and 100.
Unlike conventional oscillators such as the Relative Strength Index ( RSI ), the Money Flow Index incorporates both price and volume data, as opposed to just price. For this reason, some analysts call MFI the volume-weighted RSI .”
What are divergences?
Divergence is when the price of an asset is moving in the opposite direction of a technical indicator, such as an oscillator, or is moving contrary to other data. Divergence warns that the current price trend may be weakening, and in some cases may lead to the price changing direction.
There are 4 main types of divergence, which are split into 2 categories;
regular divergences and hidden divergences. Regular divergences indicate possible trend reversals, and hidden divergences indicate possible trend continuation.
Regular bullish divergence: An indication of a potential trend reversal, from the current downtrend, to an uptrend.
Regular bearish divergence: An indication of a potential trend reversal, from the current uptrend, to a downtrend.
Hidden bullish divergence: An indication of a potential uptrend continuation.
Hidden bearish divergence: An indication of a potential downtrend continuation.
Setting alerts.
With this indicator you can set alerts to notify you when any/all of the above types of divergences occur, on any chart timeframe you choose.
Configurable pivot periods.
You can adjust the default pivot periods to suit your prefered trading style and timeframe. If you like to trade a shorter time frame, lowering the default lookback values will make the divergences drawn more sensitive to short term price action.
How do traders use divergences in their trading?
A divergence is considered a leading indicator in technical analysis , meaning it has the ability to indicate a potential price move in the short term future.
Hidden bullish and hidden bearish divergences, which indicate a potential continuation of the current trend are sometimes considered a good place for traders to begin, since trend continuation occurs more frequently than reversals, or trend changes.
When trading regular bullish divergences and regular bearish divergences, which are indications of a trend reversal, the probability of it doing so may increase when these occur at a strong support or resistance level . A common mistake new traders make is to get into a regular divergence trade too early, assuming it will immediately reverse, but these can continue to form for some time before the trend eventually changes, by using forms of support or resistance as an added confluence, such as when price reaches a moving average, the success rate when trading these patterns may increase.
Typically, traders will manually draw lines across the swing highs and swing lows of both the price chart and the oscillator to see whether they appear to present a divergence, this indicator will draw them for you, quickly and clearly, and can notify you when they occur.
Disclaimer: This script includes code from the stock MFI by Tradingview as well as the Divergence for Many Indicators v4 by LonesomeTheBlue.

VWAP Anchored Date with multiplierA modified version from the default VWAP indicator with 2 major enhancements:
1- Start date: instead of being limited to applying the indicator on the entire chart, this script allows you to select the start time to show the VWAP. You can also use this option to show VWAP on an instrument starting from a specific time, all time high for example.
2- Multiplier: You can choose a period multiplier for VWAP, like 2 days, 4 month, 3 years and so on
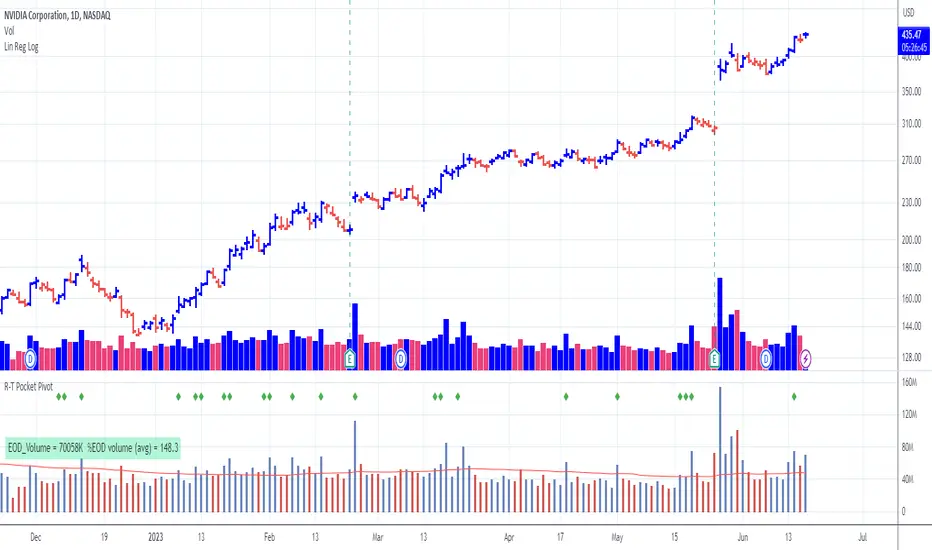
Pocket Pivot with extrapolated Volume and Moving AveragesThe script shows historical pocket pivots, much as other scripts with a green diamond shape on the volume pane.
When the market is open, the current bar, however, is extrapolated to the end of the day using a sixth-order polynomial.
Thus real-time pocket pivots are shown. To work properly, the user must input a time-zone offset parameter; the default is west coast USA.
Time-zone offset is -12 hours to +12 hours compared to the NYSE exchange time zone (USA west coast: -3.)
The volume extrapolation polynomial is based on a historical NASDAQ intraday volume model developed locally by a team.
Only ten-day lookback pocket pivots are computed as defined initially by Dr. Chris Kacher. (The default lookback can be changed by the user.)
Only pocket pivots are shown where the low of the daily bar is within user-defined proximity to the 50-day moving average or 10-day moving average (for continuation pocket pivots.)
Relative Volume IndicatorA simple indicator showing the relation of volume to highest volume for a define number of bars. Helps to differentiate periods of low and high volume.
Define the number of bars to find the highest volume used as a basis.
Apply a simple moving average to smoothen the volume. Set it to 1 to disable smoothing.
Define a threshold differentiating low and high volume.

OMXS30 Volume This indicator summarizes the volume for all stocks in the OMXS30 index. Wait until the candle closes before reading the volume.

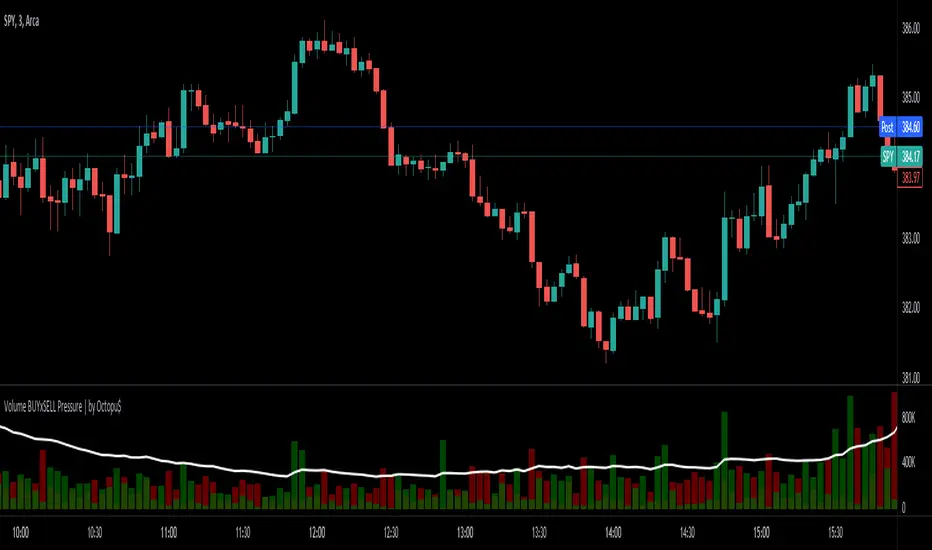
⚖ Volume BUYxSELL Pressure | by Octopu$⚖ Volume BUYxSELL Pressure | by Octopu$
Volume is the number of shares traded in a particular stock, index, or other investment over a specific period of time.
It can indicate market strength, as rising markets on increasing volume are typically viewed as strong and healthy.
In fact, the more, the better. Institutions tend to get more involved in a stock with daily dollar volume in the hundreds of millions or more
But also, when prices fall on increasing volume, the trend is gathering strength to the downside.
That's where BUYxSELL Pressure | by Octopu$ comes in.
Typically, Volume bars follow the candles.
If the Candle is Green (Close > Open), the Volume Bar is also Green.
Now if the Candle is Red (Close < Open) the Volume Bar is also Red.
You never know if it is being Bought or Sold.
This changes the game: along with Price Action, Trend Direction, and other factors. This is possible!
This indicator is composed of:
Volume itself (all of it), displayed by Gray bars;
Identifies Buying Pressure on Green Bars;
And Selling Pressure with Red Bars.
Volume Average as a White Line, for the last "X" Days
Additionally,
It presents a Yellow Triangle as and indication of when the Volume is above the Average in the current TF you are in.
Additionally, this can be set up via an Input: Means if you like to watch it 10% above Average, you got it. 25%? 50%?... You name it.
On top of that,
Includes an indication for Volume Spike as well. So if informs you visually on the Volume Bars of any surges on the TF you are in.
For example: 2x the Volume from the last Candle. Or maybe 3x? 5x... The way you like it the best.
This way, with the combination of your understanding as well as other Indicator and Factor as Confluence, you can improve your analysis and figure out what is going on.
www.tradingview.com
(SPY 5m as an example only)
SPY
Features:
• Total Volume
• Average Volume
• Buying Pressure
• Selling Pressure
• % Above Average
• Volume Spike/Surge (Multiplier)
• Custom Settings
Options:
• Show/Hide Average Line
• Change Length of Average (Days)
• Select/Personalize % of Above Avg
• Add Personalized X Multiplier
• Fully customizable on Style and Colors
• Change shapes and Location
Notes:
v1.0
Indicator release.
Changes and updates can come in the future for additional functionalities or per requests. Follow and Stay Tuned!
Did you like it? Please Support and Shoot me a message! I'd appreciate if you dropped by to say thanks! Thank you.
- Octopu$
🐙
[Kronorium] Volume-Based Regime ChangesColor coded indicator that depicts different types of unusual volume activity.
Arrows along the top will signify bearish or bullish presence. Blue arrows on the bottom indicate a bullish-regime entering, conversely, red arrows along the top will indicate a bearish-regime entering.
Unusual Volume is displayed along the top of the screen as yellow flags. This alert is agnostic-- no particular direction. At this point you must consult moving averages, or other price related indicators to decide a direction.
Volume alerts are calculated against the variable "Volume Lookback" -- volume within this window will be referenced against itself. Whenever volume expands or contracts beyond the windowed-range, alerts will be dispatched accordingly in that direction.

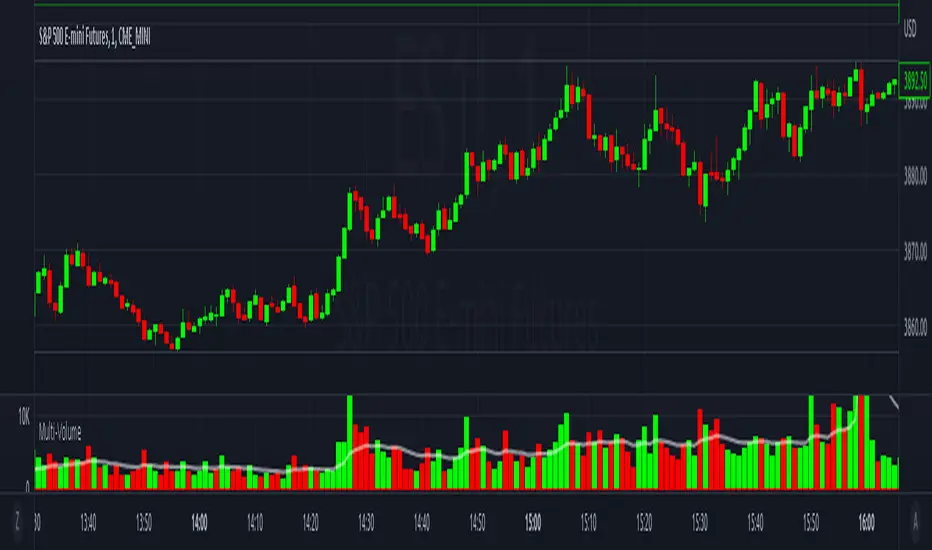
Multi-VolumeThis indicator displays volume in several formats:
Volume Bar Format:
Normal Volume: Shows the normal volume bar colors based on each candle's price direction
Up/Down Volume: Breaks down each volume bar into buying volume (volume added when price goes up) and selling volume (volume added when price goes down)
Volume Pressure: Breaks down each volume bar based on the length of the candle and its "pressure wick". See below for more information.
Flip Down Volume:
The down volume bar will be displayed below the center line.
Show Delta:
When selected with "Up/Down Volume" or "Volume Pressure", a small line will be displayed at the net volume (difference between up and down volume).
Projected Volume:
Instead of current volume, it will show expected volume at end of candle based on volume per second.
Volume Pressure:
On a green candle:
The red part represents the upper wick, the volume as the price comes back down from its high
The green part represents the rest of the candle, the volume as the price goes up from its low to the close
On a red candle:
The green part represents the lower wick, the volume as the price comes back up from its low
The red part represents the rest of the candle, the volume as the price goes down from its high to the close
To Update to Latest Version:
To update to the latest version, just close the indicator and add it again.
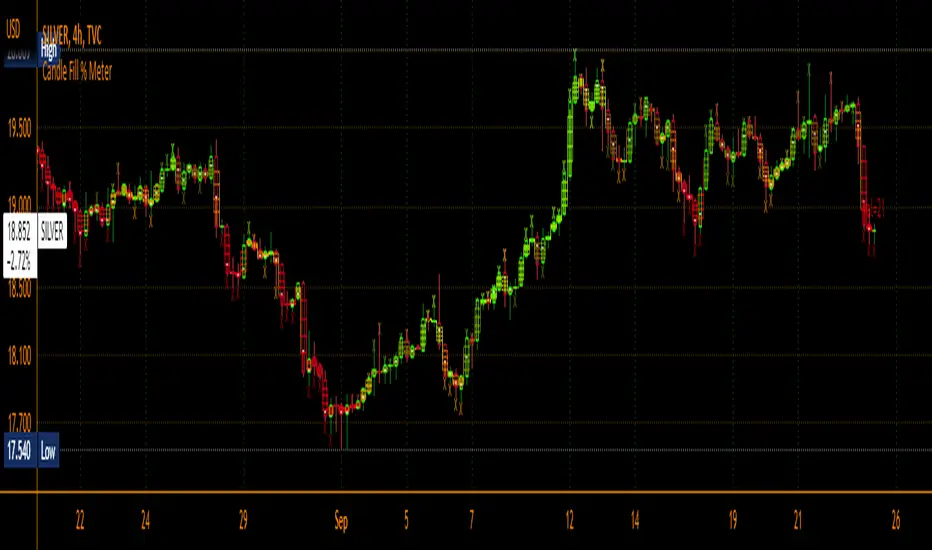
Candle Fill % MeterFor use with Hollow Candles
Fills Candles based on either the value of the RSI or coppock scaled to fit properly between the open and close. Makes for a compact visual with lot's of information given. Toggle bells and whistles in settings such as arrows to indicate the direction of the value being measured, dividing levels, fill from candle open all the time instead of the bottom up and more.
Volume Buy/Sell (by iammaximov)Buy/Sell Volume
Buy/Sell volume based on total bar amplitude (high/low price) and close/open (for calculate vbuy > vsell or vbuy < vsell)

Improved Lowry Up-Down Volume + Stocks Indicatordocs.cmtassociation.org
In Paul F. Desmond's award winning paper in 2002 entitled "Identifying Bear Market Bottoms and New Bull Markets", he proposed an indicator for panic buying and selling that can be used to determine major market bottoms.
The paper explains that in major bear markets, you should have at least one, or more than one multiple 90% down days. Recoveries out of bear markets, or beginnings of new bull markets, should have at least one of the following conditions:
1) At least one 90% up volume day
2) At least two back-to-back 80% up volume days
Up and Down volume are defined as:
1) 90% up volume - defined as 90% up volume / total volume (or 10% down volume / total volume)
2) 90% down volume - defined as 90% down volume / total volume (or 10% up volume / total volume)
Several scripts exist in Tradingview to show this indicator for Up and Down volume, along with arrows or indicators for green up days or red down days.
However, this script is an improved version as it allows you the option to customize a couple parameters:
1) You may chose whether you'd like to use volume or stocks - sometimes it's better to have confluence between volume and actual stocks at the 90% threshold
2) You may chose the exchanges to consider - in the paper the NYSE is discussed, but this allows the expansion into NYSE, NASDAQ, DOW, and even a combined NYSE + NASDAQ + DOW indicator
3) It uniquely codes in the ability to plot a buy signal for both 90% up days, but also two back-to-back 80% up days - which is in the spirit of the original paper
I hope you enjoy this script and please let me know if you'd like me to make any modifications or additions.
Thank you, sincerely,
Jim Bosse

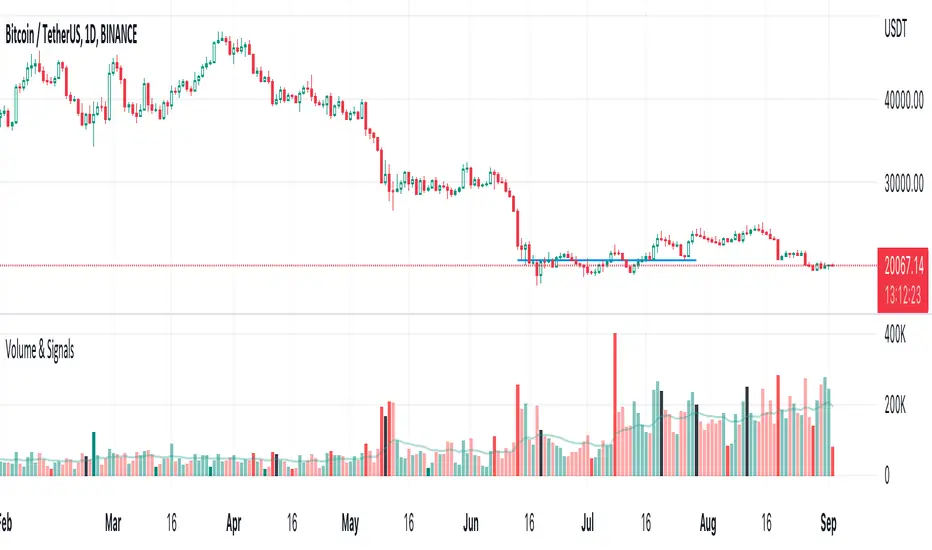
Volume & Signals
Highlighted large and small volume with solid colors.
Normal bars are the same colors as the built-in volume indicator.
Black bars are where you can Sell into strength
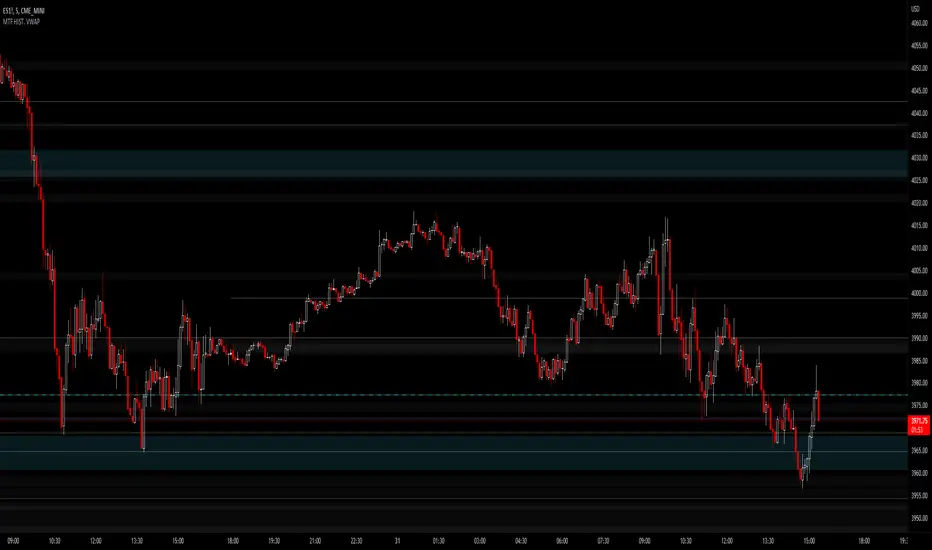
JMF MTF historical Vwap map and static levels. What is a vwap map?
This is a Multi time frame Historical vwap heatmap. The study plots lines and maps out historical vwap zones based on closing vwap value of the time frame selected and the time frames high range. Show casing high volume concentration areas and low volume area's from each time frame chosen on chart.
Static Vwap Lines can be turned off in settings, as well as the map, you can use each individually or paired together for a more complete overview of the levels. You can also refine the search by using the "Gap %" input. This will filter out and search for average price's that have gapped up or down "X" percent from the previous days average price. Leaving you with Static vwaps and map zones from the most important "Gap Day's". This helps clean up the over all visual, but be careful choosing a higher gap percentage, that you don't lose too much granularity the map offers.
What will a "Static vwap and Map look like"
The look will vary greatly depending on where the stock is in its historical range. If the name is in a consolidation range with a lot of recent average prices directly above and below, you will have a heavy, crowded, Darker/intense heat signature from the map, You will also see levels in map mode over lapping and lines bundled together. These high traffic area's can act as great support or resistance since they are showing a congregation of historical average prices where participants have previously interacted. On the contrary, if you see "open air" in the map, or large areas of blank chart where no heat signature is mapping, this is an area of LOW volume and average prices. Current price will or can move quickly through these areas IF price accepts inside the open air range. If price does NOT accept inside the open air range, Then the blank low volume zone can and will act as support or resistance given the situation.
Capture the gaps.
I look to capture these "Gaps" created by the map and static levels both long or short. I have noticed over time that the higher time frame maps zones are WELL respected intraday, Daily, Weekly, Monthly etc. I look for areas where we are clearing a high volume zone, we break above, hold and accept into open air, and start to move through the open air zones up or down.
I also use the more granular smaller levels as support and resistance intraday while in plays.
Time frames and settings .
User has 3 inputs for seperate time frames to show. You can show a combo of all 3 timeframes, or you can show only a single time frame of your choosing, or two. Mix and match with the string input time frames.
Acceptable inputs are - 5,10,15,30,60,90,240,D,W,M,2D,4W,3M and so on. Any combination of string input timeframe should work, that means numbers (5,10,15,etc) or letters (D,W,M,etc) or combination of the two.
Look and feel
Each time frame has its own color input, transparency input, line style input, and line weight input. User can customize any of the lines or maps to their liking with a wide variety of styles, widths, and colors.
Any or all of the time frames can be enabled or disabled as well, to make the map as busy, or as calm as you would like.
Enjoy !
In the end I encourage any who tries the Heatmap to really sit down and spend some time playing around with the settings in order to find out how they like the map set up. I usually run the default settings on a intraday 5min chart, and then another instance of the study on a 15min chart with W,M,3M. plotted. That way I can see granular intraday levels, and macro long term levels in the same view. See what fit's you the best, and how you like to trade. Most of all ENJOY!
Good luck -
JMF.
IMPORTANT INFO -
As always, the creator of this code is NOT a licensed investment advisor. No output of this tool is to be taken as investment advice or a recommendation to buy or sell any security.
Trading is risky, any one using this tool acknowledges they CAN LOSE some if not all of their initial investment even with this tool enabled.
User assumes ALL RESPONSIBILITY when using this tool in their technical analysis .
Price VolumePrice Volume measures the number of shares traded X price in a period of time.
Sometimes the Price Volume indicator is more accurate then volume indicator.
Price Volume can indicate market strength, as a market with increasing Price Volume is generally seen as strong and healthy.
When prices fall on increasing Price Volume, the trend is gathering strength to the downside.

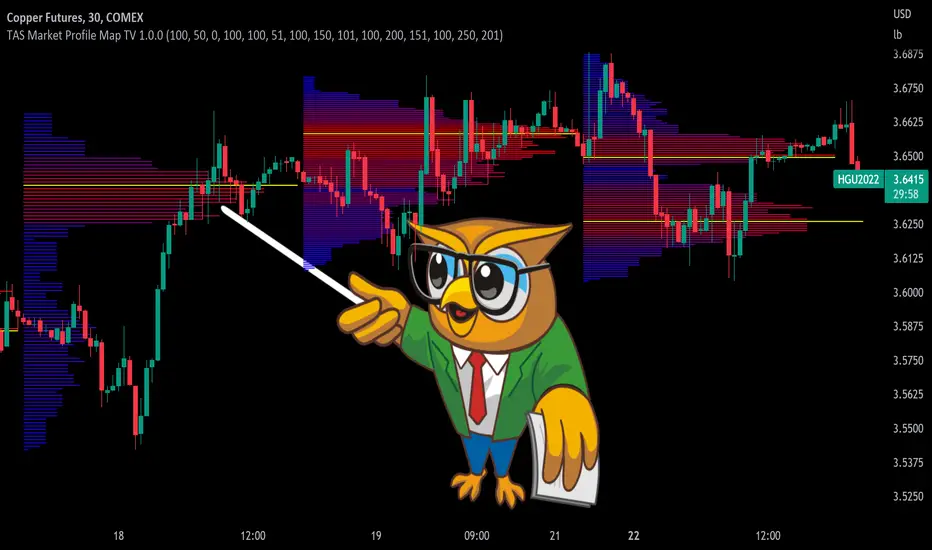
TAS Market Profile Map [TASMarketProfile]TAS Market Profile Map (aka “ TAS Market Map ”) displays volume accumulation at price using our attractive color-coded sideways histogram overlaid onto the price data pane. Hunt for high reward-to-risk opportunities with our favorite “Alligator Jaws” chart pattern setup that reveals significant volume gaps and actionable signals. TAS Market Map can paint up to 5 Maps simultaneously across time windows customized by the user.
TAS Market Map has 4 distinct colored lines:
RED ZONE – Designates an area where there are many market participants willing to transact. This zone of red lines grouped together is known as the “value area” and contains approximately 70% of the volume transacted in that particular section of the price map within the overall Market Map.
YELLOW LINE – Each TAS Market Map will contain at least one yellow horizontal line. This line is called the “Point of Control” (POC) and it represents the price where the most executions have occurred. In the case of multiple yellow POC lines, the one that extends closest to the price axis is considered the “Master Point of Control.”
PURPLE ZONE – Represents an area where there are less people willing to transact and is referred to as being “outside of value.”
BLUE ZONE – Designates areas where there is little interest on the part of commercial or institutional professionals to transact. When these areas occur on the perimeters of the TAS Market Map, they are referred to as “runaway gaps” or “rejection tails.”
∟ THE ALLIGATOR JAWS CHART PATTERN:
A popular chart pattern utilizing TAS Market Map is called the “Alligator Jaws” setup. Due to its unmistakable appearance similar to the side profile of an alligator with its mouth open, this chart pattern seeks to exploit when there are two significant Points of Control (yellow lines) with a large volume gap in between. Enter the trade as the market breaks outside of the value area (red zone) in the direction of the volume gap (inside the open jaws), place a stop loss on the other side of the Point of Control and preferably also across the value area (red zone). Seek to take profits at either 50% of the way through the volume gap or a more optimistic target just ahead of entering the opposing jawline (red zone value area). This trading technique can be applied to both long and short side entries.
Below you will find a couple examples of this chart pattern.
∟ INPUT SETTINGS:
By default, three TAS Market Maps will appear. You can activate the 4th and 5th Market Maps easily by checking the boxes in the Input settings. TAS Market Map updates automatically at the close of each bar after it has calculated all of the volume from the closed bar in addition to the completed OHLC data (Open, High, Low, Close). This happens in a matter of seconds at each bar close. The analysis is not static, but rather a rolling period of analysis at each bar close.
THERE ARE 3 SETTINGS FOR EACH MARKET MAP :
>>> # of Lines – This represents how many horizontal lines you want to comprise the Market Map so it generates a transparency customization. The default is 50 lines. If you increase the number to, for example 100, then the Market Map will appear more prominent and less transparent on the chart. Similarly, a lower input setting would remove lines and make it more transparent.
>>> BarStart – This setting dictates the starting point for that particular Market Map analysis based on the number of bars from the current bar. The default is 50 bars so this means the start of the 1st Market Map begins 50 bars from the present. At the close of each new bar, the analysis rolls to the most recent 50 bars automatically. Therefore a setting of 100 would start the analysis based on the most recent rolling 100 most recent bars.
>>> BarStop – This setting dictates the end point for the analysis of that particular Market Map. By default, the 1st Market Map will have a 0 which means it runs analysis through to the most recent bar.
OTHER NOTES ABOUT SETTINGS:
You’ll notice that by default the input settings for BarStart and BarStop for all 5 of the Market Maps are set to 50 bar increments and don’t overlap. For example the StopBar of Market Map #2 is 51, whereas the StartBar for Market Map #1 begins at 50. It is best practice to have consistency regarding the number of bars from the start and stop of the analysis.
Although not as popular, if you want to flip the orientation of the Market Map to paint from right to left instead of the default left to right, simply change the StartBar to 0 and StopBar to 50 and you’ll achieve this preference.
∟ INTERPRETATION AND RULES:
When the market is inside the red zone “value area” of the Market Map, it tends to move sideways within the range of the zone. Therefore you can look to enter trades near the top and bottom of the red zones with potential exits near the POC (yellow line) or opposing side of the red zone value area.
When price does break and close outside the value area zone, then the value area zone becomes new support or resistance and this can be leveraged for trailing stops. The most aggressive trailing stop would be after the market has penetrated into open space away from the value area, moving the stop to just back inside the value area. This would significantly reduce the trade risk.
The use of multiple Market Maps allows the trader to anticipate upcoming areas of support and resistance when the market moves beyond the scope of the current 1st Market Map. Historical Market Maps provide valuable information regarding where commercial interest existed in the past and likely to revisit in the future.
When multiple Market Maps form and the value areas align or overlap across their respective different time windows, these tend to be significant attraction zones for the market and a trader can expect sideway trading within the red value areas zones. Prudent trading is to observe the market conditions present and you the trader must adapt your trading mode to match, or not trade at all. In other words, you must trade the range during times when the market is in the value area zones and trade breakout when confirmed moves occur outside the value area zones.
In the case of a Market Map that develops “multiple distribution” areas (i.e. multiple developed value areas within Market Map), we anticipate a trending move
with price continuing in the direction the value areas are forming in relation to one another and in relation to the direction multiple Market Maps are forming.
Example of multiple Market Maps forming lower and revealing the bearish market trend:
Trade Well My Friends,
Volume with forceThis indicator shows the classic stock volume chart with a plottable 20 periods SMA line. Along with this, it shows to the top right of the pane a percent, showing the current "volume force".
This force is calculated as the SMA of the last 3 volume candles excluded the current candle (only counts finished candles) and then compare it with the standard 20 periods volume SMA.
Some examples for a better understanding:
A value of 200% means that the SMA of last 3 candles is equals to 2 times of the 20 periods volume SMA
A value of 100% means that the SMA of last 3 candles is equals to the 20 periods volume SMA
A value of 50% means that the SMA of last 3 candles is equals to 1/2 of the 20 periods volume SMA
A value of 25% means that the SMA of last 3 candles is equals to 1/4 of the 20 periods volume SMA
If the value is above 100%, the background will be green, red otherwise. A green value means that the symbol is having a nice volume income.
Customizable settings
Timeframe: the main TF to plot volume and calculate force
MA Length: the length of the standard volume SMA to plot (and to compare for the force calculation)
Diff force length: the length of the last candles (excluded the current candle) to compare with the standard volume SMA
Show moving average: if checked, plots the standard SMA
Show volume force: if checked, shows to the top right the volume force

Volume Histogram [SpiritualHealer117]This indicator is a histogram produced with Pinescript's boxes and is helpful for spotting support, resistance, and key levels. The indicator shows the volume executed at each source price over a customizable time period. The "Key Level" in this indicator is the price at which the most volume was executed, and the "Major Levels" are levels where volume was over a percentile threshold, which you can customize in settings. Feel free to give any feedback on the indicator or make a copy for yourself!

Daily Volume, RVol, RRVol, and RS/RW LabelsHeads-up display of essential Real Day Trading criteria
Daily Volume
Relative Strength/Weakness
ATR 14 and ATR 14 percent of price
Relative Volume (RVol)
Relative Volume to SPY RVol (RRVol)

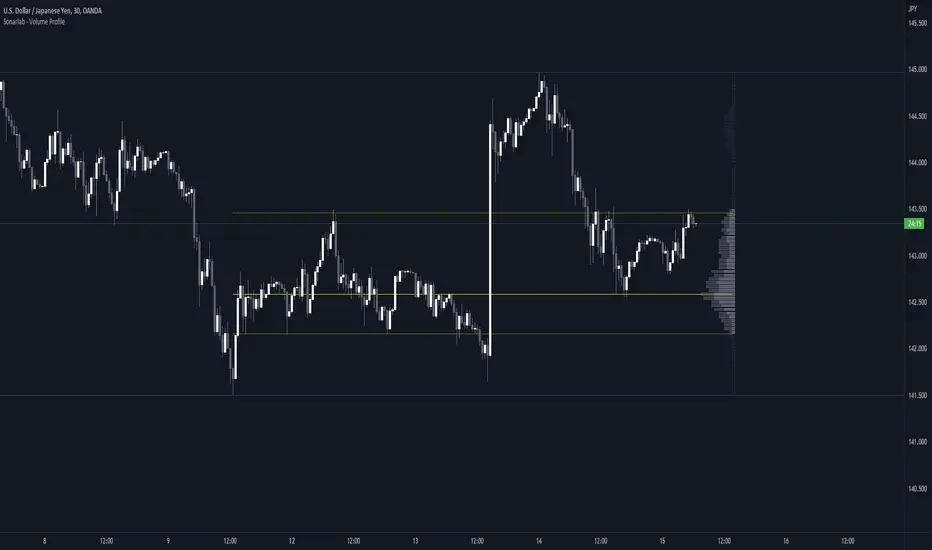
Sonarlab - Volume ProfileThis Volume Profile is a charting tool that traders use to show the traded volume amount over a given time period. The reason we build this volume profile indicator is to confirm S&D zones and show where the most volume is resting in a specific given time.
Settings
- Auto Placement: Option to have the Volume Profile automatically placed
- Manual Placement: Able to place and move the Volume Profile anywhere of your choosing
- Bull vs. Bear Candle Style
- Up/Down Candle Style
- Highlight Point of Control (PoC)
Usage:
Focused on combining with SMC:
When trading SMC, normal volume profiles can be confusing and hard to trade - since it will catch the volume on the overall chart you're on. When trading SMC, we are interested in catching specific parts in a range which defines supply or demand.
What makes this volume profile different?
The Sonarlab Volume Profile is focused on combining with SMC, integrated with Smart Money Concepts (SMC) levels, such as the Swing High and Low levels. The Indicator will automatically find the most applicable position using our custom Swing Levels to provide users with maximum utility with zero effort. Where other volume profiles are more focused on overall volume, this volume profile is focused on volume in a specific range on automation using swing points in the market.
As in this example, the high volume areas are matching with traditional supply and demand zones. The price level with the most volume is highlighted by the "point of control" (POC), displayed by the yellow line. We can consider price will react from those "high volume" areas and trade more easily through "low volume" areas.
CryptoCoelloESP----El indicador CryptoCoello es un indicador basado en scalping, se recomienda usar en tendencias de 1,3,5 minutos. Útil para todo tipo de activos y gráficas. El indicador dará una señal de compra cuando el precio haya tenido un desplome grande y llegue a puntos de sobreventa en RSI, RSI stochastic y Volumen diario. Dará señal de compra cuando las 3 sobreventas confluyan. Lo más probable es que el precio rebote en el corto plazo. La única que vez que no funciona es cuando hay un desplome en el activo y por lo tanto da señales falsas mientras sigue bajando, así que es recomendable que entres en la señal de compra solo una vez, si el precio sigue bajando y sigue dando señales no sigas abriendo compras, si se trata de un desplome posiblemente te llegue a dar de 1-4 señales falsas de compra. Los puntos de venta se recomiendan hacer cuando el RSI llegue a sobrecompra o cuando el precio llegue a la línea verde superior del indicador. Se puede usar el indicador solo o se puede usar el indicador como confluencia de tu propia estrategia. EL FUNDAMENTO DEL INDICADOR es ENCONTRAR CONFUELCIAS DE SOBREVENTA en los INDICADORES.
ENG----The CryptoCoello indicator is an indicator based on scalping, it is recommended to use in trends of 1,3,5 minutes. Useful for all types of assets and graphics. The indicator will give a buy signal when the price has had a big crash and reaches oversold points on RSI, Stochastic RSI and Daily Volume. It will give a buy signal when the 3 oversold come together. Most likely, the price will bounce in the short term. The only time it does not work is when there is a crash in the asset and therefore it gives false signals while it continues to fall, so it is recommended that you enter the buy signal only once, if the price continues to fall and continues to give signals do not continue to open purchases, if it is a crash it may give you 1-4 false purchase signals. Sell points are recommended to be done when the RSI becomes overbought or when the price reaches the upper green line of the indicator. You can use the indicator alone or you can use the indicator as a confluence of your own strategy. THE RATIONALE OF THE INDICATOR is TO FIND OVERSOLD CONFUELCIAS in the INDICATORS.
