XAU PRO [EN]XAU PRO is a macro-driven dashboard for Gold (XAUUSD) designed to provide a clear, structured, and actionable macro context without adding clutter to the chart. It is a table-only indicator: no lines, no oscillators, no background painting, and no buy/sell arrows. Its purpose is to support decision-making, not to replace price action or execution strategies.
The indicator analyzes Gold using a hybrid macro framework that combines interest rates (nominal and real), USD behavior, inflation expectations, liquidity conditions, volatility and market stress, and intermarket confirmation (Gold, Silver, and Miners). All of this information is consolidated into a single, easy-to-read panel.
A key feature of XAU PRO is its hybrid timeframe logic. Macro data from FRED (such as real yields, inflation breakevens, and liquidity) is only available on Daily or higher timeframes. Market instruments like XAUUSD, DXY, VIX, and ETFs can be intraday. When an intraday calculation timeframe is selected (for example 15m, 1h, or 4h), the indicator automatically forces FRED series to Daily while keeping other symbols on the chosen timeframe. This avoids unsupported-resolution errors and ensures stable, consistent behavior. The table explicitly displays the calculation timeframe so the user always knows what is being used.
The table is designed to answer practical trading questions. It shows the calculation timeframe, the current macro regime (such as Risk-Off, Inflation, Tightening, Liquidity-Up, or Neutral), and a clear permission state that tells whether trading conditions are favorable: LONG OK, SHORT OK, WAIT, AVOID, or BLOCKED. It also displays the macro bias direction, the adjusted macro score that reflects the strength of drivers, the confluence percentage that measures environment quality, a divergence filter between Gold and real yields, the relevance of correlation between Gold and 5-year real yields, and a filtered historical accuracy metric. Each row includes color-coded status, plain-English explanations, and directional arrows showing whether conditions are improving or deteriorating.
XAU PRO is intended to be used as a professional workflow tool. Traders use higher-timeframe macro information to define context and risk conditions, then execute trades using their own price-based setups. The indicator does not tell you when to enter or exit; it tells you when trading makes sense and when it does not.
The indicator is fully configurable. Users can choose whether calculations follow the chart timeframe or a custom timeframe, move the table to different screen positions, adjust fonts and colors, and enable or disable specific macro components such as VIX, MOVE, or GVZ.
This is not a signal indicator. It does not repaint, does not rely on curve-fitting, and is designed for clarity, stability, and macro awareness. It is best suited for Gold traders who separate market context from execution and want a clean, professional macro dashboard directly on their chart.
XAUUSD

DT Average Levels [Doclad Team]DT Average Levels
DT Average Levels is a price‑based indicator that plots three important reference levels derived from the structure of the previous candle. These levels highlight potential areas of support and resistance and help traders anticipate where price may react during pullbacks or intraday retracements.
The indicator calculates and displays:
Upper Wick Midpoint — the midpoint between the candle high and the top of the candle body
Lower Wick Midpoint — the midpoint between the bottom of the candle body and the candle low
Body Midpoint — the equilibrium level of the candle, calculated as the average of the open and close
Together, these levels provide a clear framework for identifying balance zones and rejection areas within recent price action.
Key Features
Multi‑Timeframe Capability
Option to plot levels from the previous daily candle while analyzing lower timeframes such as 1H or 15M.
Individual Level Control
Each level can be enabled or disabled independently to keep the chart clean and focused.
Price Labels
Optional price markers displayed on the scale for precise level identification.
Flexible Line Styling
Adjustable line length, width, and style (solid, dashed, or dotted).
Custom Colors
Fully customizable colors with transparency control for seamless chart integration.
How to Use
Apply the indicator to any market and timeframe
Enable “Show 1D Timeframe Values” to display levels from the previous daily candle on intraday charts
Monitor price interaction with these levels, as they often act as intraday support or resistance
Combine with your existing analysis tools to build higher‑confluence trade setups
Why These Levels Matter
Wick midpoints often represent the average price of rejection zones, while the body midpoint reflects market equilibrium between buyers and sellers. These reference levels are commonly observed by professional traders and algorithmic systems, making them useful areas to watch for potential price reactions.

DT Volume Profile OB [Doclad Team]DT Volume Profile OB is an advanced trading indicator designed to deliver deeper insight into market structure and price behavior. It enhances the traditional order block concept by embedding a detailed volume profile directly inside each order block, calculated using lower timeframe data.
Unlike conventional order block indicators, this tool distributes volume from lower timeframe candles across multiple segments within the order block zone. This reveals the internal volume structure of each block, allowing traders to identify where the most significant trading activity actually occurred rather than treating the zone as a single flat area.
A core feature of the indicator is its flexible order block detection logic, controlled by a single parameter called Tuning. This setting allows you to adjust the sensitivity of the algorithm:
Higher values generate fewer but more significant order blocks
Lower values produce more frequent order blocks with reduced significance
This makes the indicator adaptable to different trading styles, from short-term intraday trading to higher‑timeframe analysis.
Key Settings
Number of Segments
Defines how many segments the order block is divided into, allowing you to control the level of volume profile detail.
Tuning
Adjusts the sensitivity and frequency of order block detection to match your trading approach.
Color Settings
Fully customizable color options for all visual elements, ensuring seamless integration with any chart layout.
The example illustrates how price can react precisely to the highest-volume segment within an order block, highlighting the indicator’s ability to identify high‑impact price levels with greater accuracy.
While DT Volume Profile OB offers enhanced analytical depth, it is best used alongside other technical tools and market analysis methods. This indicator does not guarantee profitable trades; instead, it provides additional context to support more informed trading decisions.
Gain a clearer perspective on market activity with DT Volume Profile OB — a tool that goes beyond surface-level zones and reveals the volume dynamics driving price movement.

Anchored VWAP PercentageINDICATOR: ANCHORED VWAP PERCENTAGE (AVWAP)
1. Overview
The Anchored VWAP Percentage (AVWAP) is a quantitative momentum and mean-reversion tool. It measures the percentage distance between the current price and a Volume Weighted Average Price (VWAP) that resets automatically based on specific time cycles. It allows traders to identify overextended market conditions relative to institutional value.
---
2. Core Logic & Calculation
The script tracks the relationship between price and volume starting from a specific Anchor Point .
* Volume-Weighted Foundation: Unlike simple moving averages, this indicator uses the VWAP formula: sum(Volume * Price) / sum(Volume) .
* Automatic Anchoring: The starting point (Anchor) resets automatically depending on the chart timeframe (e.g., resets weekly on a 15m chart, or yearly on a Daily chart).
* Percentage Deviation: It calculates the precise gap between the price and the VWAP, plotted as an oscillator: ((Price - VWAP) / VWAP) * 100 .
---
3. Adaptive Intelligence (Multi-Asset & Multi-TF)
The AVWAP is built with an internal database of 85th Percentile (P85) volatility thresholds. It recognizes that different assets have different "stretching" limits:
1. Asset-Specific Calibration: It includes optimized data for Bitcoin, Ethereum, Altcoins, Forex, and Indices .
2. Dynamic Timeframe Mapping: The anchor period and the exhaustion thresholds adjust automatically. For example:
* Intraday (1m-5m): Anchors to an 8-hour (480 min) cycle.
* Mid-Term (15m-60m): Anchors to a Weekly (W) cycle.
* Swing (Daily): Anchors to a Yearly (12M) cycle.
---
4. Visual Anatomy
The indicator is designed for high-speed decision-making:
* The Histogram:
* Green: Price is trading above the VWAP (Bullish premium).
* Red: Price is trading below the VWAP (Bearish discount).
* P85 Threshold Lines:
* These lines represent the 85th percentile of historical deviations . Historically, the price stays within these boundaries 85% of the time.
* Background Highlighting: When the histogram crosses the P85 line, the background glows, signaling a Statistical Exhaustion Zone where a retracement to the mean is highly probable.
---
5. How to Trade with AVWAP
* Mean Reversion: When the histogram reaches the P85 Zone , the price is "statistically overextended." This is a prime area to look for reversals or to take profits on existing trends.
* Trend Strength: If the histogram stays near the Zero Line while the price moves, the trend is supported by healthy volume.
* Value Area: The Zero Line represents the Fair Value . Buying near the Zero Line during a bullish histogram (Green) offers a high-probability entry with low risk.
---
6. Technical Parameters
* Asset Selection: A dropdown to switch between Crypto, Forex, and Indices.
* Color Customization: User-defined colors for bullish and bearish sentiment.
* Precision Control: 4-decimal precision for accurate tracking of thin-margin assets like Forex.

Fourier Smoothed Volume Zone Oscillator Forecast [QuantAlgo]🟢 Overview
Volume tells the story that price alone cannot. When thousands of contracts change hands on an upward move versus a handful on a downward drift, the market communicates something meaningful about conviction and participation. The Fourier Smoothed Volume Zone Oscillator (FSVZO) captures this relationship by measuring directional volume flow, producing readings that reveal whether buyers or sellers control the tape with genuine commitment. Building on this foundation, this FSVZO Forecast indicator adds a forward-looking dimension through three distinct projection engines: a market structure model that interprets swing dynamics, a volume-weighted approach that examines accumulation and distribution flows, and a linear regression method that extrapolates recent directional behavior. What distinguishes this implementation is its dual forecasting architecture. Since FSVZO fundamentally depends on the interplay between price movement and volume activity, the indicator projects both elements independently before calculating future oscillator values, creating coherent framework for mean reversion trading across multiple asset classes and timeframes, from intraday scalping on liquid futures to swing trading equities and cryptocurrencies.
🟢 How It Works
The indicator begins by calculating a Volume Zone Oscillator using a directional volume approach: it multiplies volume by the sign of price change (positive when price rises, negative when price falls), applies a weighted moving average to this directional volume, then divides by a simple moving average of total volume. The result scales to a percentage, typically oscillating between -100 and +100, with readings beyond these levels indicating exceptional momentum conditions. Multiple smoothing passes, including a triple-smoothed SMA sequence and optional additional smoothing, reduce noise while preserving meaningful signals.
The forecasting mechanism operates through a two-stage process that distinguishes this indicator from simpler projection tools. First, the system estimates future price levels using the selected forecasting method. Second, it independently projects future volume using one of three volume models: average (baseline historical volume), momentum (volume adjusted for recent acceleration or deceleration), or mean reversion (volume gravitating toward longer-term norms). These dual projections then feed into a simulated FSVZO engine that replicates the actual oscillator's mathematics, calculating directional volume relationships and applying identical smoothing operations to produce projected values.
Since momentum oscillators rarely travel in straight lines, the projection system incorporates dynamic price oscillation. This mechanism draws from stored patterns of recent price changes, applies mathematical wave functions tied to current volatility conditions, and factors in momentum characteristics to create natural-looking forecast trajectories. The Price Volatility input allows traders to adjust the degree of fluctuation in projections. Higher settings produce more waviness, while lower settings generate smoother trend-like forecasts. The complete system generates up to 20 bars of projected FSVZO and MA values, rendered as dashed lines extending beyond current price action.
🟢 Key Features
1. Market Structure Model
This projection method analyzes price action through the lens of swing point dynamics and structural shifts. The algorithm identifies pivot highs and pivot lows within a configurable lookback range, then evaluates whether the market exhibits bullish characteristics (successive higher highs and higher lows) or bearish patterns (successive lower highs and lower lows). When price breaks previous swing levels, the model recognizes these as potential changes of character that inform projection direction.
Price forecasts under this model incorporate proximity analysis to key structural levels and aggregate trend strength, measured by counting trend-confirming swings across recent history. Bullish structure combined with price near support zones biases projections upward, generating forecasted FSVZO readings that reflect potential buying momentum. Bearish structure near resistance creates downward-biased projections. ATR scaling keeps projections proportional to current market volatility.
▶ Practical Implications:
Designed for traders who build strategies around support, resistance, and swing-based entries
Structure-based projections provide context around pivot zones where FSVZO direction changes may coincide with price reactions
Can help visualize potential divergence setups as structural shifts in price may precede FSVZO direction changes
Shows how FSVZO projections shift based on proximity to detected swing highs and lows
Works best when markets display clear directional swings rather than choppy consolidation
May produce less useful output during extended consolidation phases with overlapping swing points
Day traders can combine structural projections with session pivots for intraday momentum context
2. Volume-Weighted Model
This method synthesizes multiple volume indicators to construct informed price projections that subsequently drive FSVZO forecasts. The algorithm tracks On-Balance Volume to measure cumulative buying and selling pressure over time, monitors the Accumulation/Distribution Line to assess where price settles within each bar's range relative to volume, and computes volume-weighted returns that emphasize high-activity price movements. Directional slopes of these metrics reveal whether volume patterns confirm or contradict prevailing price direction.
Significant volume spikes receive heightened attention, with their directional bias incorporated into forecast calculations. When OBV slope, A/D line slope, and volume momentum align in the same direction, the model generates more assertive price projections, translating to stronger FSVZO movements. Conflicting volume signals produce dampened projections, suggesting FSVZO may consolidate rather than extend. The Volume Influence parameter allows traders to weight how heavily volume analysis affects the final projection versus pure price trend extrapolation.
▶ Practical Implications:
Designed for traders who incorporate volume confirmation into their analysis
Helps identify whether current price moves are accompanied by supportive volume patterns
Volume-based projections can provide additional context when evaluating divergences between price and momentum
Best suited for instruments with meaningful volume data
Swing traders can assess whether breakout moves show volume commitment
3. Linear Regression Model
The most mathematically direct of the three approaches, linear regression fits an optimal straight line through recent price data using least-squares methodology and extends that trajectory forward. These projected prices, combined with volume forecasts, generate corresponding FSVZO projections without conditional market interpretation or structural analysis. The forecast simply addresses one question: if price continues at its current rate of change with projected volume conditions, where would FSVZO readings be in upcoming bars?
▶ Practical Implications:
Functions well during sustained, orderly trends where price progression remains relatively linear
Responds more slowly to sudden directional shifts or volatility regime changes
Works effectively on higher timeframes where trends develop more gradually
Useful benchmark for comparing against structure or volume models to gauge projection differences
🟢 Universal Applications Across All Models
Regardless of which forecasting method you select, the FSVZO Forecast indicator projects future oscillator positions that may assist with:
▶ Mean Reversion Trading at Extreme Zones: FSVZO displays defined overbought and oversold territories that create potential mean reversion opportunities. When FSVZO enters these upper or lower extremes, traders can monitor for potential exhaustion and reversal setups as the oscillator moves back toward neutral. Projections add a timing dimension to this analysis by showing where FSVZO may travel in upcoming bars, allowing traders to anticipate when the oscillator might approach or exit extreme zones.
▶ Trend Following with the Colored Band: The filled band between FSVZO main line and offset line delivers immediate trend visualization across all forecast models. Green coloring indicates rising FSVZO (current value higher than previous = long/buy opportunity), while red coloring indicates falling FSVZO (current value lower than previous = short/sell opportunity). This visual system provides quick reference for current momentum direction. For trend following applications, traders can monitor band color for directional bias and watch for color transitions as potential warning signals. Projections extend this visualization into future bars, showing whether the forecast anticipates continued momentum or potential direction changes. Combining band direction with FSVZO's position relative to zero provides layered context: green band above zero suggests bullish momentum, red band below zero suggests bearish momentum, while mixed readings suggest transitional conditions.
▶ Divergence Detection: Built-in divergence scanning identifies regular (R label) and hidden (H label) divergences between price and FSVZO. Regular divergences occur when price makes a higher high while FSVZO makes a lower high (bearish) or price makes a lower low while FSVZO makes a higher low (bullish). Hidden divergences signal potential trend continuation. Projections can provide context for whether developing divergences might continue or resolve.
▶ Signal Line Crossovers: The indicator tracks crossovers between FSVZO and its moving average. Crossovers from below occur when FSVZO rises above the MA, while crossovers from above occur when FSVZO falls below the MA. Projections may help anticipate when these crossovers could occur.
▶ Zero Line Analysis: FSVZO crossing above zero indicates a shift to positive directional volume flow. Crossing below zero indicates a shift to negative directional volume flow. Projections can show whether the oscillator may approach or cross the zero line in upcoming bars.
▶ White Noise Filtering: The optional Ehlers White Noise overlay displays an additional oscillator that measures the degree of randomness in price movement. This can help identify periods when price movements lack clear directional commitment, providing context for when momentum signals may be less meaningful.
▶ Multi-Model Comparison: Running different projection methods and noting where they agree or disagree provides additional analytical context. When multiple methods project similar trajectories, this alignment may warrant special attention.
▶ Trade Management: Reference projected FSVZO levels when planning stops, position adjustments, or profit targets based on anticipated momentum conditions.
🟢 Important Considerations
▶ This indicator requires volume data to function correctly. Instruments that do not report volume or report unreliable volume data will produce meaningless or zero readings.
▶ These forecasts derive from mathematical analysis of recent price and volume behavior. Markets operate as dynamic systems influenced by countless factors that no technical indicator can fully anticipate. Projected FSVZO values represent potential momentum scenarios based on current conditions, and actual readings may follow different paths than those visualized. Historical tendencies and mathematical extrapolations provide no guarantee of future market behavior. Consider these projections as one component within a comprehensive trading methodology that includes disciplined risk management, appropriate position sizing, and multiple analytical perspectives. The primary value of this script lies not in expecting precise forecasts but in developing forward-looking awareness of possible market conditions and structuring your trades accordingly.

LBMA London Gold Fix Times [Auto DST]## Overview
This lightweight indicator automatically marks the **LBMA Gold Price Fixing** times on your chart using vertical lines. It is designed specifically for **XAUUSD (Gold)** traders who need to monitor institutional liquidity and volatility shifts during the London session.
The indicator tracks the two key daily fixing moments:
* **AM Fix:** 10:30 (London Time)
* **PM Fix:** 15:00 (London Time)
## Key Features
* **🌍 Auto Daylight Saving Time (DST):** Built with the `Europe/London` timezone parameter. It automatically adjusts to British Summer Time (BST) and GMT, so you never have to manually change the UTC offset settings.
* **⚡ Minimalist Design:** Draws clean vertical lines without cluttering your chart with text labels.
* **🎨 Fully Customizable:** You can adjust the line color, width, and style (Solid, Dashed, Dotted) for both AM and PM sessions independently.
## Why are these times important?
The London Gold Fix (LBMA Gold Price) is the global benchmark for physical gold settlement. Major institutions, central banks, and mining companies settle contracts at these times. Consequently, **10:30** and **15:00** (London time) often witness:
1. Significant spikes in volatility.
2. Trend reversals or accelerations.
3. Massive volume injection.
## Usage Tips
* **Timeframe:** This indicator works best on **Intraday Timeframes** (1-minute to 30-minute charts).
* *Note:* It may not be visible on H1 (1-hour) charts or higher because the fix times (e.g., 10:30) occur in the middle of an hourly candle.
* **Setup:** Simply add it to your chart. No timezone configuration is required; the script calculates London time internally.
## Settings
* **AM Fix Color:** Default is Blue (London Morning).
* **PM Fix Color:** Default is Red (London Afternoon/US Morning overlap).
* **Line Style:** Choose between Solid, Dashed, or Dotted lines.
概述 (Overview)
这是一个轻量级的辅助指标,通过垂直线在图表上自动标记 LBMA 伦敦金定盘价(LBMA Gold Price Fixing) 的时刻。它是专为 XAUUSD(黄金) 交易者设计的,旨在帮助大家捕捉伦敦时段内机构流动性和市场波动的关键节点。
该指标会自动锁定每天两个核心的定盘时间:
上午定盘 (AM Fix): 10:30 (伦敦时间)
下午定盘 (PM Fix): 15:00 (伦敦时间)
主要功能 (Key Features)
🌍 自动识别夏令时 (Auto DST): 代码内置 Europe/London 时区参数。无论英国处于夏令时 (BST) 还是冬令时 (GMT),指标都会自动精准对齐,无需用户手动调整时区设置。
⚡ 极简主义设计: 仅绘制干净的垂直线,不显示任何文字标签,避免遮挡K线或干扰视线。
🎨 高度可定制: 您可以独立调整上午和下午定盘线的颜色、粗细以及样式(实线、虚线或点线)。
为什么要关注这两个时间点?
LBMA 伦敦金定盘价是全球实物黄金结算的基准价格。大型金融机构、中央银行和金矿公司通常会在这个时间点集中进行合约结算。因此,在伦敦时间 10:30 和 15:00 前后,市场经常会出现:
波动率瞬间激增。
短期趋势的反转或加速。
巨量成交量的涌入。
使用建议 (Usage Tips)
适用周期: 建议在 日内分时图(1分钟、5分钟、15分钟或30分钟)上使用。
注意: 在 1小时 (H1) 或更大的周期上,线条可能无法显示,因为定盘时间(如 10:30)发生在整点K线的内部,无法被单独标记。
设置方法: 加载指标即可使用。无论您本地电脑的时间设置如何,脚本内部会自动计算正确的伦敦时间。
参数设置 (Settings)
AM Fix Color: 上午定盘线颜色(默认为蓝色)。
PM Fix Color: 下午定盘线颜色(默认为红色,此时往往也是美盘初期的波动高峰)。
Line Style: 线条样式选择(实线、虚线、点线)。

GOD SNIPER [The One] FINAL MOBILEGOD SNIPER - Ultimate Institutional Trading System (Mobile Ready)
This script is an all-in-one trading system designed for professional day traders, specifically optimized for Gold (XAUUSD) and Forex . It combines Institutional SMT Logic , SMC Structure , and Trend Analysis into a single, mobile-responsive dashboard.
🚀 Core Features
1. GOD Signal (Master Trigger)
The core of the system uses SMT Divergence (Smart Money Tool) logic. It compares price action with correlated assets (via `request.security`) combined with an RSI filter to identify high-probability reversals.
Non-Repainting: All signals are confirmed strictly on the BAR CLOSE . They will never disappear or repaint.
Auto Reversal: The system alerts you immediately when the trend shifts (e.g., from Buy to Sell), allowing for quick hedging or reversing positions.
2. SMC Trade Manager
Automatically maps market structure to guide your trade management.
BOS (Break of Structure): Identifies trend continuation for stacking positions.
Smart Exits: Alerts you on CHoCH (Change of Character) or structural breaks to protect profits.
Dynamic TP/SL: Automatically calculates Entry, Stop Loss, and Take Profit levels based on recent swing points.
3. Mobile Optimized Dashboard
A responsive UI designed for mobile traders. You can toggle "Mobile Mode" in the settings to shrink the dashboard, preventing it from obscuring the chart on small screens.
4. Session Kill Zones
Highlights high-volume trading sessions (London & New York) with subtle background colors, helping you focus on the most volatile times of the day.
-------------------------------------------------------------
🛡️ How to Trade
1. Check Trend: Look at the Dashboard. Trade in the direction of the H1 Trend.
2. Wait for Signal: Wait for a confirmed GOD BUY or GOD SELL label.
3. Entry: Enter the trade upon the alert/bar close.
4. Manage:
- Use BOS signals to add to your position (Stacking).
- Exit immediately upon an EXIT signal or an opposite GOD signal.
-------------------------------------------------------------
⚠️ Disclaimer
This script does not guarantee profits. Past performance is not indicative of future results. Always use proper risk management.
👉 For Access / Invitation: Please check the link in my Signature below.
=============================================================
🇹🇭 Thai Translation (คำอธิบายภาษาไทย)
GOD SNIPER คือระบบเทรดที่รวมเครื่องมือระดับกองทุนไว้ในที่เดียว เน้นความแม่นยำสูง ไม่รีเพนท์ (Non-Repaint 100%)
ฟีเจอร์เด่น:
1. GOD Signal: ใช้เทคนิค SMT Divergence หาจุดกลับตัวที่แม่นยำ สัญญาณไม่หาย
2. SMC Manager: บอกจุดเติมไม้ (BOS) และจุดหนี (Exit) ตามโครงสร้างราคา
3. Mobile Mode: ปรับขนาดตารางให้เล็ก เหมาะสำหรับดูในมือถือ
4. Kill Zones: ไฮไลท์ช่วงเวลา London/NY เพื่อให้โฟกัสเทรดเฉพาะช่วงวอลุ่มเข้า
วิธีใช้งาน: ดูเทรนด์ H1 เป็นหลัก > รอสัญญาณ GOD > เข้าออเดอร์เมื่อจบแท่ง > เก็บกำไรตามป้าย TP
(สำหรับการใช้งาน กรุณาดูลิงก์ที่ลายเซ็นด้านล่าง)

Volume-Weighted Price Z-Score [QuantAlgo]🟢 Overview
The Volume-Weighted Price Z-Score indicator quantifies price deviations from volume-weighted equilibrium using statistical standardization. It combines volume-weighted moving average analysis with logarithmic deviation measurement and volatility normalization to identify when prices have moved to statistically extreme levels relative to their volume-weighted baseline, helping traders and investors spot potential mean reversion opportunities across multiple timeframes and asset classes.
🟢 How It Works
The indicator's core methodology lies in its volume-weighted statistical approach, where price displacement is measured through normalized deviations from volume-weighted price levels:
volumeWeightedAverage = ta.vwma(priceSource, lookbackPeriod)
logDeviation = math.log(priceSource / volumeWeightedAverage)
volatilityMeasure = ta.stdev(logDeviation, lookbackPeriod)
The script uses logarithmic transformation to capture proportional price changes rather than absolute differences, ensuring equal treatment of percentage moves regardless of price level:
rawZScore = logDeviation / volatilityMeasure
zScore = ta.ema(rawZScore, smoothingPeriod)
First, it establishes the volume-weighted baseline which gives greater weight to price levels where significant trading occurred, creating a more representative equilibrium point than simple moving averages.
Then, the logarithmic deviation measurement converts the price-to-average ratio into a normalized scale:
logDeviation = math.log(priceSource / volumeWeightedAverage)
Next, statistical normalization is achieved by dividing the deviation by its own historical volatility, creating a standardized z-score that measures how many standard deviations the current price sits from the volume-weighted mean.
Finally, EMA smoothing filters noise while preserving the signal's responsiveness to genuine market extremes:
rawZScore = logDeviation / volatilityMeasure
zScore = ta.ema(rawZScore, smoothingPeriod)
This creates a volume-anchored statistical oscillator that combines price-volume relationship analysis with volatility-adjusted normalization, providing traders with probabilistic insights into market extremes and mean reversion potential based on standard deviation thresholds.
🟢 Signal Interpretation
▶ Positive Values (Above Zero): Price trading above volume-weighted average indicating potential overvaluation relative to volume-weighted equilibrium = Caution on longs, potential mean reversion downward = Short/sell opportunities
▶ Negative Values (Below Zero): Price trading below volume-weighted average indicating potential undervaluation relative to volume-weighted equilibrium = Caution on shorts, potential mean reversion upward = Long/buy opportunities
▶ Zero Line Crosses: Mean reversion transitions where price crosses back through volume-weighted equilibrium, indicating shift from overvalued to undervalued (or vice versa) territory
▶ Extreme Positive Zone (Above +2.5σ default): Statistically rare overvaluation representing 98.8%+ confidence level deviation, indicating extremely stretched bullish conditions with high mean reversion probability = Strong correction warning/short signal
▶ Extreme Negative Zone (Below -2.5σ default): Statistically rare undervaluation representing 98.8%+ confidence level deviation, indicating extremely stretched bearish conditions with high mean reversion probability = Strong buying opportunity signal
▶ ±1σ Reference Levels: Moderate deviation zones (±1 standard deviation) marking common price fluctuation boundaries where approximately 68% of price action occurs under normal distribution
▶ ±2σ Reference Levels: Significant deviation zones (±2 standard deviations) marking unusual price extremes where approximately 95% of price action should be contained under normal conditions
🟢 Features
▶ Preconfigured Presets: Three optimized parameter sets accommodate different analytical approaches, instruments and timeframes. "Default" provides balanced statistical measurement suitable for swing trading and daily/4-hour analysis, offering deviation detection with moderate responsiveness to price dislocations. "Fast Response" delivers heightened sensitivity optimized for intraday trading and scalping on 15-minute to 1-hour charts, using shorter statistical windows and minimal smoothing to capture rapid mean reversion opportunities as they develop. "Smooth Trend" offers conservative extreme identification ideal for position trading on daily to weekly charts, employing extended statistical periods and heavy noise filtering to isolate only the most significant market extremes.
▶ Built-in Alerts: Seven alert conditions enable comprehensive automated monitoring of statistical extremes and mean reversion events. Extreme Overbought triggers when z-score crosses above the extreme threshold (default +2.5σ) signaling rare overvaluation, Extreme Oversold activates when z-score crosses below the negative extreme threshold (default -2.5σ) signaling rare undervaluation. Exit Extreme Overbought and Exit Extreme Oversold alert when prices begin reverting from these statistical extremes back toward the mean. Bullish Mean Reversion notifies when z-score crosses above zero indicating shift to overvalued territory, while Bearish Mean Reversion triggers on crosses below zero indicating shift to undervalued territory. Any Extreme Level provides a combined alert for any extreme threshold breach regardless of direction. These notifications allow you to capitalize on statistically significant price dislocations without continuous chart monitoring.
▶ Color Customization: Six visual themes (Classic, Aqua, Cosmic, Ember, Neon, plus Custom) accommodate different chart backgrounds and visual preferences, ensuring optimal contrast for identifying positive versus negative deviations across trading environments. The adjustable fill transparency control (0-100%) allows fine-tuning of the gradient area prominence between the z-score line and zero baseline, with higher opacity values creating subtle background context while lower values produce bold deviation emphasis. Optional bar coloring extends the z-score gradient directly to the indicator pane bars, providing immediate visual reinforcement of current deviation magnitude and direction without requiring reference to the plotted line itself.
*Note: This indicator requires volume data to function correctly, as it calculates deviations from a volume-weighted price average. Tickers with no volume data or extremely limited volume will not produce meaningful results, i.e., the indicator may display flat lines, erratic values, or fail to calculate properly. Using this indicator on assets without volume data (certain forex pairs, synthetic indices, or instruments with unreported/unavailable volume) will produce unreliable or no results at all. Additionally, ensure your chart has sufficient historical data to cover the selected lookback period, e.g., using a 100-bar lookback on a chart with only 50 bars of history will yield incomplete or inaccurate calculations. Always verify your chosen ticker has consistent, accurate volume information and adequate price history before applying this indicator.

Golden Vector Trend Orchestrator (GVTO)Golden Vector Trend Orchestrator (GVTO) is a composite trend-following strategy specifically engineered for XAUUSD (Gold) and volatile assets on H4 (4-Hour) and Daily timeframes.
This script aims to solve a common problem in trend trading: "Whipsaws in Sideways Markets." Instead of relying on a single indicator, GVTO employs a Multi-Factor Confluence System that filters out low-probability trades by requiring alignment across Trend Structure, Momentum, and Volatility.
🛠 Methodology & Logic
The strategy executes trades only when four distinct technical conditions overlap (Confluence). If any single condition is not met, the trade is filtered out to preserve capital.
1. Market Structure Filter (200 EMA)
Indicator: Exponential Moving Average (Length 200).
Logic: The 200 EMA acts as the baseline for the long-term trend regime.
Bullish Regime: Price must close above the 200 EMA.
Bearish Regime: Price must close below the 200 EMA.
Purpose: Prevents counter-trend trading against the macro direction.
2. Signal Trigger & Trailing Stop (Supertrend)
Indicator: Supertrend (ATR Length 14, Factor 3.5).
Logic: Uses Average True Range (ATR) to detect trend reversals while accounting for volatility.
Purpose: Provides the specific entry signal and acts as a dynamic trailing stop-loss to let profits run while cutting losses when the trend invalidates.
3. Volatility Gatekeeper (ADX Filter)
Indicator: Average Directional Index (Length 14).
Threshold: > 25.
Logic: A high ADX value indicates a strong trend presence, regardless of direction.
Purpose: This is the most critical filter. It prevents the strategy from entering trades during "choppy" or ranging markets (consolidation zones) where trend-following systems typically fail.
4. Momentum Confirmation (DMI)
Indicator: Directional Movement Index (DI+ and DI-).
Logic: Checks if the buying pressure (DI+) is physically stronger than selling pressure (DI-), or vice versa.
Purpose: Ensures that the price movement is backed by genuine momentum, not just a momentary price spike.
📋 How to Use This Strategy
🟢 LONG (BUY) Setup
A Buy signal is generated only when ALL of the following occur simultaneously:
Price Action: Price closes ABOVE the 200 EMA (Orange Line).
Trigger: Supertrend flips to GREEN (Bullish).
Strength: ADX is greater than 25 (Strong Trend).
Momentum: DI+ (Plus Directional Indicator) is greater than DI- (Minus).
🔴 SHORT (SELL) Setup
A Sell signal is generated only when ALL of the following occur simultaneously:
Price Action: Price closes BELOW the 200 EMA (Orange Line).
Trigger: Supertrend flips to RED (Bearish).
Strength: ADX is greater than 25 (Strong Trend).
Momentum: DI- (Minus Directional Indicator) is greater than DI+ (Plus).
🛡 Exit Strategy
Stop Loss / Take Profit: The strategy utilizes the Supertrend Line as a dynamic Trailing Stop.
Exit Long: When Supertrend turns Red.
Exit Short: When Supertrend turns Green.
Note: Traders can also use the real-time P/L Dashboard included in the script to manually secure profits based on their personal Risk:Reward ratio.
📊 Included Features
Real-Time P/L Dashboard: A table in the top-right corner displays the current trend status, ADX strength, and the Unrealized Profit/Loss % of the current active position.
Smart Labeling: Buy/Sell labels are coded to appear only on the initial entry trigger. They do not repaint and do not spam the chart if the trend continues (no pyramiding visualization).
Visual Aids: Background color changes (Green/Red) to visually represent the active trend based on the Supertrend status.
⚠️ Risk Warning & Best Practices
Asset Class: Optimized for XAUUSD (Gold) due to its high volatility nature. It also works well on Crypto (BTC, ETH) and Major Forex Pairs.
Timeframe: Highly recommended for H4 (4 Hours) or D1 (Daily). Using this on lower timeframes (M5, M15) may result in false signals due to market noise.
News Events: Automated strategies cannot predict economic news (CPI, NFP). Exercise caution or pause trading during high-impact economic releases.

Ash_TheTrader: Institutional Truth / Volume ProfileSTOP GUESSING. See the Institutional Truth. (No Repaint)
Most retail traders are trading blind. You are looking at lagging moving averages and "magic" lines that disappear when the price moves against them.
The institutions? They are trading Liquidity.
For months, I have been developing a proprietary engine that strips away the noise and reveals the Statistical Truth of the market. This is not just another "buy/sell" indicator. This is an Institutional Liquidity Engine designed to show you exactly where the money is hiding.
Introducing: Ash_TheTrader: Institutional Truth
👁️ What is "The Truth"?
This script utilizes an Auto-Anchored Liquidity Engine that automatically detects the start of true market cycles. It builds a real-time profile of volume, delta, and imbalance to answer one simple question: Who is actually in control?
It features a "Black Box" Signal Engine that refuses to repaint. If it says BIAS ↑ , the institutional flow is bullish. Period.
🚀 Key Features
• 🚫 NO REPAINT Bias: Signals are mathematically locked. They never disappear. • 🏦 Institutional Logic: It filters out "Retail Traps." If price hasn't reclaimed the Value Level (POC), it won't signal a trade—saving you from buying the top. • ⚡ Dual-Core Engine: Switch between Swing Mode (Macro Trends) and Scalp Mode (M1/M5 Aggressive Algorithms). • 🧱 Liquidity Walls: Bright Neon blocks appear where 75%+ of volume is one-sided. This is where you place your limit orders.
📚 Step-by-Step: How to Trade "The Truth"
1. Choose Your Engine Go to Settings > Algorithm Mode. • Select "Normal (Swing)" for H1/H4 trend trading (Higher Winrate). • Select "Scalp (Aggressive)" for M1/M5/M15 (Faster Signals).
2. The "Green Light" Setup (Long) • Wait for the Dashboard: Look for the signal ✅ SWING BIAS ↑ or ⚡ SCALP BIAS ↑ . • Check the Trap: Ensure the text does NOT say "⚠️ TRAP." • Entry: Enter on the close of the candle. • Stop Loss: Place below the Yellow "Truth" Level (Point of Control) or the recent Swing Low.
3. The "Brick Wall" Scalp • If you see a bright NEON RED block appear on the profile, that is a Bearish Wall . • Price will often bounce off this level aggressively. • Strategy: Place a Sell Limit order at the Neon Red block for a quick reaction trade.
4. The Divergence Warning • Keep an eye on the bottom banner of the dashboard. • If you are Long, but you see a big RED "BEARISH DIV" warning, take profit immediately. The institutions are leaving the trade.
⚠️ A Warning This tool is powerful, but it reveals the reality of the market. Sometimes the Dashboard will say "⚠️ ACCUMULATING" or "⚠️ NEUTRAL." Do not force a trade. The secret to a high winrate is knowing when not to trade. Let the engine do the work.
Add it to your chart now. Stop guessing.
Cheers, @Ash_TheTrader

ThaiRiches Predictor [Free Version]ThaiRiches Predictor is a comprehensive trend-following system designed to help traders identify high-probability entries while managing risk effectively. This script combines Zero-Lag technology (ZLEMA) with volatility filters and an intelligent AI Dashboard to analyze market conditions in real-time.
Key Features:
Zero-Lag Trend Engine: Uses a custom Zero-Lag EMA (ZLEMA) logic combined with volatility bands to detect trend changes earlier than traditional Moving Averages.
AI Analysis Dashboard: A real-time monitor panel that evaluates Trend, Momentum (RSI), and Volatility to provide actionable advice (e.g., "Strong Uptrend", "Overbought - Wait for Pullback", or "Low Volatility - Caution").
Auto TP & SL System: Automatically calculates and displays Stop Loss (SL), Take Profit 1 (TP1), and Take Profit 2 (TP2) based on ATR, adapting to the current market volatility.
Improved Safety: SL is calculated from the High/Low of the signal candle to prevent premature stop-outs.
Visual Alerts: Clear BUY/SELL labels with price targets and color-coded candlesticks for easy visual confirmation.
How to Use:
BUY Signal: Look for the Green Label and Green Trend Line. Confirm with the Dashboard (Status: BULLISH).
SELL Signal: Look for the Red Label and Red Trend Line. Confirm with the Dashboard (Status: BEARISH).
Risk Management: Use the provided SL levels. It is recommended to take partial profit at TP1 and trail your stop to entry.
Caution: Avoid trading when the Dashboard shows "Low Volatility" or "Choppy" warnings.
Settings:
You can adjust the Trend Sensitivity and RSI Period.
TP/SL Multipliers are fully customizable to fit different assets (Gold, Forex, Crypto).

ThaiRiches Predictor [AI Premium]ThaiRiches Predictor is a comprehensive trend-following system designed to help traders identify high-probability entries while managing risk effectively. This script combines Zero-Lag technology (ZLEMA) with volatility filters and an intelligent AI Dashboard to analyze market conditions in real-time.
Key Features:
Zero-Lag Trend Engine: Uses a custom Zero-Lag EMA (ZLEMA) logic combined with volatility bands to detect trend changes earlier than traditional Moving Averages.
AI Analysis Dashboard: A real-time monitor panel that evaluates Trend, Momentum (RSI), and Volatility to provide actionable advice (e.g., "Strong Uptrend", "Overbought - Wait for Pullback", or "Low Volatility - Caution").
Auto TP & SL System: Automatically calculates and displays Stop Loss (SL), Take Profit 1 (TP1), and Take Profit 2 (TP2) based on ATR, adapting to the current market volatility.
Improved Safety: SL is calculated from the High/Low of the signal candle to prevent premature stop-outs.
Visual Alerts: Clear BUY/SELL labels with price targets and color-coded candlesticks for easy visual confirmation.
How to Use:
BUY Signal: Look for the Green Label and Green Trend Line. Confirm with the Dashboard (Status: BULLISH).
S ELL Signal: Look for the Red Label and Red Trend Line. Confirm with the Dashboard (Status: BEARISH).
Risk Management: Use the provided SL levels. It is recommended to take partial profit at TP1 and trail your stop to entry.
Caution: Avoid trading when the Dashboard shows "Low Volatility" or "Choppy" warnings.
Settings:
You can adjust the Trend Sensitivity and RSI Period.
TP/SL Multipliers are fully customizable to fit different assets (Gold, Forex, Crypto).

RSI Forecast [QuantAlgo]🟢 Overview
While standard RSI excels at measuring current momentum and identifying overbought or oversold conditions, it only reflects what has already happened in the market. The RSI Forecast indicator builds upon this foundation by projecting potential RSI trajectories into future bars, giving traders a framework to consider where momentum might head next. Three analytical models power these projections: a market structure approach that reads swing highs and lows, a volume analysis method that weighs accumulation and distribution patterns, and a linear regression model that extrapolates recent trend behavior. Each model processes market data differently, allowing traders to choose the approach that best fits their analytical style and the asset they're trading.
🟢 How It Works
At its foundation, the indicator calculates RSI using the standard methodology: comparing average upward price movements against average downward movements over a specified period, producing an oscillator that ranges from 0 to 100. Traders can apply an optional signal line using various moving average types (e.g., SMA, EMA, SMMA/RMA, WMA, or VWMA), and when SMA smoothing is selected, Bollinger Bands can be added to visualize RSI volatility ranges.
The forecasting mechanism operates by first estimating future price levels using the chosen projection method. These estimated prices then pass through a simulated RSI engine that mirrors the actual indicator's mathematics. The simulation updates the internal gain and loss averages bar by bar, applying the same RMA smoothing that powers real RSI calculations, to produce authentic projected values.
Since RSI characteristically moves in waves rather than straight lines, the projection system incorporates dynamic oscillation. This draws from stored patterns of recent RSI movements, factors in the tendency for RSI to pull back from extreme readings, and applies mathematical wave functions tied to current momentum conditions. The Oscillation Intensity control lets traders adjust how much waviness appears in projections. Signal line (RSI-based MA) projections follow the same logic, advancing the chosen moving average type forward using its proper mathematical formula. The complete system generates 15 bars of projected RSI and signal line values, displayed as dashed lines extending beyond current price action.
🟢 Key Features
1. Market Structure Model
This projection method reads price action through swing point analysis. It scans for pivot highs and pivot lows within a defined lookback range, then evaluates whether the market is building bullish patterns (successive higher highs and higher lows) or bearish patterns (successive lower highs and lower lows). The algorithm recognizes structural shifts when price violates previous swing levels in either direction.
Price projections under this model factor in proximity to key swing levels and overall trend strength, measured by tallying trend-confirming swings over recent history. When bullish structure prevails and price hovers near support, upward price bias enters the projection, pushing forecasted RSI higher. Bearish structure near resistance creates the opposite effect. The model scales its projections using ATR to keep them proportional to current volatility conditions.
▶ Practical Implications for Traders:
Aligns well with traders who focus on support, resistance, and swing-based entries
Provides context for where RSI might travel as price interacts with structural levels
Tends to perform better when markets display clear directional swings
May produce less useful output during consolidation phases with overlapping swings
Offers early visualization of potential divergence setups
Swing traders can use structure-based projections to time entries around key pivot zones
Position traders could benefit from the trend strength component when holding through larger moves
On lower timeframes, it helps scalpers identify micro-structure shifts for quick momentum plays
Useful for mapping out potential RSI behavior around breakout and breakdown levels
Day traders can combine structural projections with session highs and lows for intraday context
2. Volume-Weighted Model
This method blends multiple volume indicators to inform its price projections. It tracks On-Balance Volume to gauge cumulative buying and selling pressure, monitors the Accumulation/Distribution Line to assess where price closes relative to its range on each bar, and calculates volume-weighted returns to give heavier influence to high-volume price movements. The model examines the directional slope of these metrics to assess whether volume confirms or contradicts price direction.
Unusually high volume bars receive special attention, with their directional bias factored into projections. When all volume metrics point the same direction, the model produces more aggressive price forecasts and consequently stronger RSI movements. Conflicting volume signals lead to more muted projections, suggesting RSI may move sideways rather than trending.
▶ Practical Implications for Traders:
Suited for traders who incorporate volume confirmation into their analysis
Works best with instruments that report accurate, meaningful volume data
Useful for identifying situations where momentum lacks volume support
Less applicable to instruments with sparse or unreliable volume information
Scalpers on liquid markets can spot volume-backed momentum for quick entries and exits
Helps intraday traders distinguish between genuine moves and low-volume fakeouts
Position traders can assess whether institutional participation supports longer-term trends
Effective during news events or market opens when volume spikes often drive directional moves
Swing traders can use volume divergence in projections to anticipate potential reversals
3. Linear Regression Model
The simplest of the three methods, linear regression fits a straight line through recent price data using least-squares mathematics and extends that line forward. These projected prices then generate corresponding RSI forecasts. This creates a clean momentum projection without conditional logic or interpretation of market characteristics. The forecast simply asks: if the recent price trend continues at its current rate of change, where would RSI be in the coming bars?
▶ Practical Implications for Traders:
Delivers a clean, mathematically neutral projection baseline
Functions well during sustained, orderly trends
Involves fewer parameters and produces consistent, reproducible output
Responds more slowly when trend direction shifts
Works best in trending environments rather than ranging markets
Ideal for position traders who want to ride established trends
Useful for swing traders to gauge trend exhaustion when actual RSI deviates from linear projections
Scalpers can use the smooth output as a reference point to measure short-term momentum deviations
Effective baseline for comparing against structure or volume models to measure market complexity
Works particularly well on higher timeframes where trends develop more gradually
🟢 Universal Applications Across All Models
Regardless of which forecasting method you select, the indicator projects future RSI positions that may help with:
▶ Overbought/Oversold Planning: See whether RSI trajectories point toward extreme zones, giving you time to prepare responses before conditions develop
▶ Entry and Exit Timing: Factor projected RSI levels into your timing decisions for opening or closing positions
▶ Crossover Anticipation: Watch for projected crossings between RSI and its signal line (RSI-based MA) that might indicate upcoming momentum shifts
▶ Mean Reversion Context: When RSI sits at extremes, projections can illustrate potential paths back toward the midline
▶ Momentum Evaluation: Assess whether current directional strength appears likely to continue or fade based on projection direction
▶ Divergence Awareness: Use forecast trajectories alongside price action to spot potential divergence formations earlier
▶ Comparative Analysis: Run different projection methods and note where they agree or disagree, using alignment as an additional filter, for instance
▶ Multi-Timeframe Context: Compare RSI projections across different timeframes to identify alignment or conflict in momentum outlook
▶ Trade Management: Reference projected RSI levels when adjusting stops, scaling positions, or setting profit targets
▶ Rule-Based Systems: Incorporate projected RSI conditions into systematic trading approaches for more forward-looking signal generation
Note: It is essential to recognize that these forecasts derive from mathematical analysis of recent price behavior. Markets are dynamic environments shaped by innumerable factors that no technical tool can fully capture or foresee. The projected RSI values represent potential scenarios for how momentum might develop, and actual readings can take different paths than those visualized. Historical tendencies and past patterns offer no guarantee of future behavior. Consider these projections as one element within a comprehensive trading approach that encompasses disciplined risk management, appropriate position sizing, and diverse analytical methods. The true benefit lies not in expecting precise forecasts but in developing a forward-thinking perspective on possible market conditions and planning your responses accordingly.

ADX + DI Trend Gate PROADX + DI Trend Gate PRO is a trend filter and signal tool built around DMI (DI+ / DI-) and ADX. It helps you avoid choppy conditions by requiring real trend strength and DI separation before allowing signals.
Key features:
AUTO presets for 5m / 15m (optimized for fast intraday use)
Optional MTF confirmation (5m → 15m, 15m → 1H)
Adaptive DI Gap (volatility-based adjustment using ATR/Close)
Confirm on bar close option (no repaint mode)
Signal modes: DI Cross (classic) or Gate Flip (more responsive)
Optional filters: ATR volatility filter and Volume filter
Exit signals when trend weakens (ADX weakening / DI convergence / DI flip)
Info panel with active parameters, AUTO vs MANUAL, MTF diff, and adjustable panel font size
How to use (practical):
For cleaner signals, keep AUTO presets ON and enable Confirm on bar close.
For stricter filtering, enable MTF confirmation and/or Require ADX rising.
Volume filter is best on instruments with meaningful volume; on Forex (tick volume) it’s often better OFF.
Disclaimer : This indicator is a trend filter and timing tool, not financial advice. Always backtest and use proper risk management.

XAU Seasonality + Setup Quality + Month Strength | WarRoomXYZXAU Seasonality Engine is a technical analysis indicator developed for the study of recurring, calendar-based behavior on XAUUSD (Gold).
The tool blends month-of-year seasonality statistics with higher-timeframe context and a setup-quality gate to help users observe when market conditions historically lean strong, weak, or neutral — and how strict trade selection should be during each regime.
Indicator Concept
An indicator for XAUUSD that combines:
1. Seasonality Regime (Month-of-Year Bias)
► Classifies the current month as Strong / Weak / Neutral based on either:
• Preset months (user-defined)
or
• Auto mode (computed from historical monthly performance)
► Strong months suggest a bullish tailwind (not a signal).
► Weak months suggest headwind / caution and require stricter setup quality.
2. Monthly Performance Engine (Under the Hood)
► Uses the symbol’s monthly timeframe data to compute, per calendar month:
• Average monthly return (%)
• Win rate (%) — how often that month closes positive
• Month Strength Score (0–100) — a blended score derived from performance data
► The score is designed to provide a relative strength snapshot of seasonality by month.
3. Month Strength Histogram
► Plots a histogram (0–100) of the current month’s strength score.
• Higher bars = historically stronger month tendency
• Lower bars = historically weaker month tendency
► Optional horizontal reference lines mark “strong” and “weak” zones to make regimes obvious at a glance.
4. Setup Quality Meter (Confluence Filter)
► The indicator calculates a Setup Quality Score (0–100) using market structure and momentum components, such as:
• EMA trend alignment
• Momentum confirmation (EMA fast vs slow)
• Structure break confirmation (BOS)
• Liquidity sweep behavior
• Candle confirmation logic
► This score is intended as a trade-selectivity filter , not a trade executor.
5. Adaptive Rules for Weak Months (Strict Mode)
► When the indicator detects a weak seasonal regime, conditions automatically tighten:
• The A+ threshold increases (adaptive thresholding)
• Optional rule: Weak months require BOS + Sweep + FVG simultaneously before any A+ condition is considered valid
This forces the user into “higher-quality-only” behavior during historically weaker seasonal periods.
🔹1 Visual Components Included
• Seasonality regime label (Strong / Weak / Neutral)
• Optional background shading based on regime
• Month Strength Score histogram (0–100)
• Current month stats: Avg return + win rate
• Setup Quality Meter value (0–100)
• Adaptive A+ threshold display
• Weak-month confluence gate status (BOS / Sweep / FVG pass/fail)
• Optional alerts when strict criteria are met
➣What Means in the XAU Indicator
🔹 Definition (in THIS indicator)
Win Rate = the percentage of historical months that closed positive for the same calendar month.
It is NOT:
trade win rate ❌
signal accuracy ❌
It is a s tatistical seasonality metric .
How It’s Calculated
For each calendar month (January, February, etc.), the indicator:
1.Looks at historical monthly candles (Monthly timeframe).
2. Counts how many times that month:
•Closed higher than it opened (or higher than previous month close).
3. Divides:
Number of positive months
÷
Total number of observed months
× 100
Example: September
If over the last 20 years:
September closed green 14 times
September closed red 6 times
Then:
Win Rate = (14 / 20) × 100 = 70%
That’s what you see as in the dashboard.
What the Win Rate Is Used For
1️⃣ Part of the Month Strength Score
The indicator blends:
•Average Monthly Return (%) → measures magnitude
•Win Rate (%) → measures consistency
Combined into:
Month Strength Score (0–100)
This avoids a common trap:
•A month with 1 huge rally but many losses ≠ reliable
•A month with steady positive closes = higher quality environment
What Win Rate Tells You
High Win Rate (e.g. 65–75%)
•Gold more often closes higher in this month
•Continuation is statistically more likely
•Pullbacks are more likely to resolve in trend direction
Low Win Rate (e.g. 35–45%)
•Gold more often fails to close higher
•More chop, deeper retracements, false breakouts
•Continuation trades statistically struggle
What It Does NOT Tell You
🚫 It does NOT mean:
•“You will win 70% of your trades”
•“Every setup in this month works”
•“Direction is guaranteed”
Seasonality is context, not prediction.
Why This Is Powerful When Combined With Your System
On its own, win rate is just data.
But in your indicator, it’s used to:
•🔒 Raise the A+ threshold in weak months
•🧠 Force BOS + Sweep + FVG confluence
•❌ Block marginal setups automatically
So instead of guessing:
-“Why is gold so choppy this month?”
You know:
-“This month historically underperforms SO I must be stricter.”
➣What Means in the XAU Seasonality Indicator
🔹 Definition (in THIS indicator)
Avg Monthly Return = the average percentage gain or loss of XAUUSD for a specific calendar month, calculated across many years.
It measures magnitude , not frequency.
It is NOT:
•trade profit ❌
•expected return for the next month ❌
•guaranteed performance ❌
It is a historical seasonality tendency.
How It’s Calculated
For each calendar month (January, February, etc.), the indicator:
1.Takes every historical occurrence of that month.
2.Calculates the percentage change of the monthly candle:
(Monthly Close − Previous Monthly Close)
÷ Previous Monthly Close × 100
3. Adds all those percentage changes together.
4. Divides by the total number of observations.
Example: September
Assume over 20 years:
+2.4%, +1.1%, −0.6%, +3.0%, +1.8%, ...
If the sum of all September returns = +28% across 20 years:
Avg Monthly Return = +1.40%
That’s the number displayed in the indicator.
What Avg Monthly Return Is Used For
1️⃣ Measuring Strength of Movement
•Win Rate → “How often does it close green?”
•Avg Monthly Return → “How big are the moves when it works?”
Both are needed.
A month can:
•Win often but move very little
•Move a lot but only occasionally
The indicator combines both to avoid misleading conclusions.
How to Interpret Avg Monthly Return
Positive Avg Return (e.g. +0.8% to +2.0%)
•Gold tends to expand during this month
•Continuation phases are more likely
•Pullbacks are often absorbed
Near-Zero Avg Return (e.g. −0.2% to +0.2%)
•Market is statistically balanced
•Expect chop, rotations, false breaks
•Continuation is less reliable
Negative Avg Return (e.g. −0.5% or worse)
•Downward pressure or heavy mean reversion
•Rallies often fade
•Risk of aggressive stop hunts
What Avg Monthly Return Does NOT Mean
🚫 It does NOT mean:
•“Price will move +1.4% this month”
•“You should buy because the number is positive”
•“This is a guaranteed edge”
It describes historical behavior, not future certainty.
Why Avg Monthly Return Matters More Than People Think
Two months can have the same win rate but behave very differently:
Example:
Month Win Rate Avg Return Reality
Month A 65% +0.2% Small, choppy wins
Month B 55% +1.6% Fewer wins, but strong expansions
Your indicator would rank Month B as stronger, which is correct for continuation-based strategies.
How It Feeds the Month Strength Score
The indicator blends:
•60% Avg Monthly Return (normalized)
•40% Win Rate
This means:
•Big moves matter more than small consistency
•But consistency still matters enough to prevent distortion
Result:
Month Strength Score (0–100)
Which is then used to:
•tighten or relax A+ thresholds
•activate weak-month strict rules
•control trade frequency
🔹2. Intended Use
The indicator is designed as a discretionary analysis tool to support study of:
• seasonal bias and calendar tendencies
• relative strength/weakness across months
• how strict trade selection should be across different regimes
• confluence behavior when seasonal conditions are unfavorable
The tool does not generate forecasts, does not guarantee outcomes, and should not be relied upon as a stand-alone decision mechanism.
🔹3.How to Use XAU Seasonality Engine
Recommended charts: XAUUSD, intraday (5m–15m) with a HTF context (1H–4H).
1. Identify the Seasonal Regime
• Strong month → you can allow more continuation bias (still require structure).
• Neutral month → trade normally, standard criteria.
• Weak month → tighten selection, demand clean A+ conditions only.
2. Read the Month Strength Histogram
• If the score is high (e.g., 70+), the month has historically shown stronger tendency.
• If the score is low (e.g., 40 and below), expect slower conditions, deeper pullbacks, or more chop — and reduce marginal trades.
3. Use the Setup Quality Meter as the Gate
► In normal/strong months:
• A+ threshold is moderate (e.g., 70)
► In weak months:
• A+ threshold is higher (e.g., 80+)
• Optional strict mode: must also pass BOS + Sweep + FVG alignment
4. Example Trade Logic (Framework, Not Signals)
► Bullish framework in a Strong Month:
• Seasonal regime = Strong (tailwind)
• Structure supports bullish continuation (trend alignment)
• Sweep occurs into demand / liquidity grab
• Setup Quality reaches A+ threshold
• Entry: confirmation candle or retrace to key level
• SL: beyond sweep low / invalidation
• TP: nearest liquidity / prior highs / HTF level
► Weak Month rule-set (Strict Mode):
• Seasonal regime = Weak (headwind)
• Only consider trades if:
✅ BOS confirms direction
✅ Sweep occurs and rejects cleanly
✅ FVG exists recently (or is mitigated if you choose that model)
✅ Setup Quality exceeds the elevated adaptive threshold
If any one is missing → no trade
This is not meant to “predict” gold — it’s meant to enforce discipline when seasonality historically underperforms.
🔹4.Limitations and User Responsibility
► The indicator does not represent financial advice or imply performance expectations.
► Seasonality is statistical tendency, not certainty — macro conditions can override it.
► Results vary by broker feed, timeframe, and settings.
► Users should test thoroughly in simulation before applying to live markets.
► All trading decisions, risk management, and execution remain solely the responsibility of the user.
🔹5. Alerts
Optional alerts can notify when:
• a new month begins and the seasonal regime changes
• A+ criteria are met
• weak-month strict conditions pass (BOS + Sweep + FVG)
Alerts are informational only and do not constitute actionable recommendations.
Disclaimer
This script is provided for informational and educational purposes only . It does not provide financial, investment, or trading advice, and it does not guarantee profits or future performance. All decisions made based on this script are solely the responsibility of the user.
This script does not execute trades, manage risk, or replace the need for trader discretion. Market behavior can change quickly, and past behavior detected by the script does not ensure similar future outcomes.
Users should test the script on demo or simulation environments before applying it to live markets and must maintain full responsibility for their own risk management, position sizing, and trade execution.
Trading involves risk, and losses can exceed deposits. By using this script, you acknowledge that you understand and accept all associated risks.

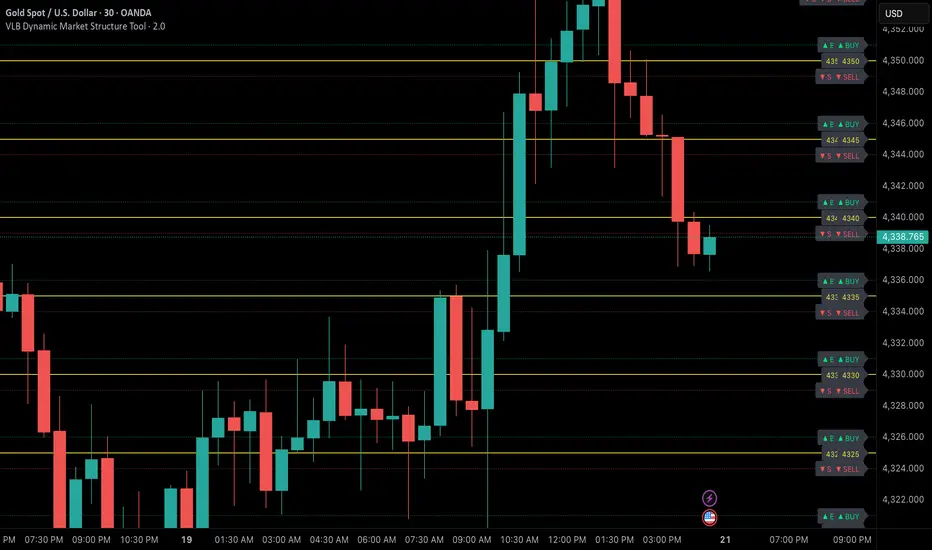
VLB Cycle Market ToolThe VLB Dynamic Levels Tool provides a visual framework for observing price structure on XAUUSD.
It displays automatically generated levels based on a rules-based approach, allowing traders to study how price interacts with important reference areas on the chart.
The tool updates dynamically as market structure evolves, reflecting changes in price movement without requiring manual redrawing.
Its purpose is to offer a clear, consistent layout of structural levels that users can incorporate into their own market analysis.
Features:
Automatically displayed structural reference levels
Dynamic recalculation as new highs and lows form
Neutral, non-predictive visual layout
A consistent framework for studying price behavior
This tool does not generate trading signals or provide predictive information.
It simply organizes price structure into visual reference points that may assist users in their independent chart analysis.
Traders remain fully responsible for their own interpretation, timing, and risk management.
The VLB Dynamic Levels Tool is intended for those who prefer a clean and adaptable way to observe XAUUSD structure throughout changing market conditions.

VLB Dynamic Market Structure ToolAdaptive Structural Continuation Framework for XAUUSD
The VLB Dynamic Market Structure Tool is a proprietary, rules-driven market structure framework designed specifically to analyze price continuation behavior in XAUUSD under live market conditions.
This tool does not plot static support and resistance.
Instead, it provides a continuously adapting structural model that reorganizes itself around current price, allowing traders to observe acceptance, rejection, and expansion behavior between key structural zones.
Core Conceptual Foundation
The framework is built on three integrated components that work together as a single methodology:
1. Dynamic Price-Anchored Structural Range
Unlike traditional indicators that rely on fixed historical levels, this tool anchors its entire structural range to live market price.
As price migrates:
Levels that are no longer relevant are automatically removed
New forward-relevant levels are introduced
The framework re-centers itself around active price action
This ensures that the trader is always viewing current, actionable structure, without manual redrawing or chart repositioning.
2. Evenly Spaced Structural Reference Levels
Within the dynamically anchored range, price is organized into consistent structural intervals that frequently act as transition points in XAUUSD price behavior.
These levels serve as objective reference boundaries, allowing traders to:
Compare reactions across identical structural distances
Observe recurring price behavior in a normalized framework
Maintain consistency across different sessions and market conditions
The levels are contextual, not predictive.
3. Post-Break Acceptance & Expansion Zones
The framework distinguishes between:
Initial structural breaks that fail or retrace
Confirmed acceptance beyond a defined offset from the level
Expansion phases as price transitions toward the next structural interval
By visualizing this sequence, the tool allows traders to study continuation behavior only after confirmation, rather than reacting to first-touch or initial breakouts.
Adaptive Behavior (Why This Is Not Static S&R)
A defining feature of the VLB Dynamic Levels Tool is its continuous recalculation and real-time adaptation:
The visible structure evolves with price
The framework moves up or down as market conditions change
Historical clutter is intentionally removed to preserve clarity
The trader’s focus remains on the active trading environment
This adaptive behavior is integral to the methodology and cannot be replicated through manual drawing or static indicators.
Intended Use
This tool is designed for discretionary traders who:
Study market structure, acceptance, and momentum
Prefer confirmation-based continuation frameworks
Value rule-based consistency over subjective interpretation
Combine structural context with their own execution, fundamentals, and risk management
The indicator does not generate automated buy or sell signals and does not execute trades.
Important Disclosures
No performance or outcome is guaranteed
No predictive claims are made
All trading decisions remain the responsibility of the user
Summary
The VLB Dynamic Levels Tool provides a self-adjusting, structurally consistent framework for observing how XAUUSD price transitions between key zones in real time.
Its proprietary value lies in the integration of dynamic price anchoring, structural normalization, and post-break acceptance visualization, offering a methodical way to study continuation behavior in changing market conditions.
Hybrid CCI Scalper ProHybrid CCI Scalper Pro is a sophisticated trading system designed to solve the biggest problem in scalping: False Signals in Choppy Markets.
Unlike standard CCI indicators that fire on every crossover, the HCS Pro uses a Hybrid Logic Engine that distinguishes between high-probability Trend Continuations and powerful Reversal Setups. It processes every potential entry through a 6-factor "Quality Filter" before generating a signal.
Core Features:
1. The Hybrid Signal Engine The script identifies two distinct market conditions:
TREND Mode: Triggers when price is aligned with the Daily/Local trend AND the CCI angle is steep.
REVERSAL Mode (REV): Triggers only on Extreme Momentum (steep angle) combined with a Zero-Line cross, allowing you to catch tops and bottoms without waiting for lagging trend indicators.
2. The Quality Scoring System (Q-Score) Every signal is rated from 0 to 6 stars based on confluence. The signal label shows Q: 4/6, Q: 5/6, etc.
Score 4+: High probability (Recommended).
Score 6: "The Perfect Storm" – All filters (Trend, Volume, RSI, ADX) align.
3. The "Ironclad" Filters To eliminate fake-outs, the script enforces strict rules:
Candle Color Guard: Never Buys on a Red candle or Sells on a Green one.
Angle validation: Flat CCI movement is ignored.
MTF Trend: Checks the Daily timeframe (D1 EMA) to ensure you aren't scalping against the major flow.
Noise Filter: Uses ATR and Volume to ignore low-volatility "dead" markets.
4. The Information Panel A clean dashboard on the top-right displays real-time metrics:
Current Daily Trend (Bull/Bear)
Momentum Strength (Weak/Strong/Extreme)
ADX Power (Trending vs Ranging)
Live Signal Score
How to Trade:
BUY Signal: Look for a Green Triangle. Ideally, the Label should say TREND or REV with a Quality Score of 4/6 or higher.
SELL Signal: Look for a Red Triangle with a high Quality Score.
No Signal? If the panel says "WAIT" or the score is low, the market is likely choppy. Stay out.
Recommended Settings:
Gold (XAUUSD): Works best on 15m.
Forex (EURUSD): Works well on 5m - 15m.
Default settings are optimized for a balance between frequency and accuracy.

Liquidity Sweep Sniper AP StyleAP Capital – Liquidity Sweep Sniper (Fab-Style)
📌 Overview
This indicator is a precision scalping tool inspired by professional liquidity-based trading concepts often demonstrated by elite intraday scalpers.
The script focuses on liquidity sweeps followed by strong displacement, aiming to capture short, high-probability momentum moves — particularly effective on lower timeframes (1–5 min) during active market sessions.
It is not a signal spam tool. Signals appear only when multiple objective conditions align.
🧠 Core Concept
Markets do not move randomly — they seek liquidity before expanding.
This indicator identifies:
Buy-side / Sell-side liquidity
Liquidity sweeps (stop-hunts)
Strong displacement candles reclaiming price
Optional higher-timeframe trend alignment
Only when all conditions are met does a signal print.
🔍 What the Indicator Detects
1️⃣ Liquidity Pools
Equal highs or equal lows detected within a configurable lookback
Minimum number of touches required
ATR-based tolerance to adapt to volatility
These levels represent areas where stop orders are likely resting.
2️⃣ Liquidity Sweep
A valid sweep requires:
Price to wick beyond the liquidity level
Candle to close back inside the range
This indicates failed breakout / stop-hunt behaviour.
3️⃣ Displacement Confirmation
After the sweep, the candle must show:
Strong body (default >60% of candle range)
Candle range large relative to ATR
Clear directional intent (momentum)
This filters out weak reactions and chop.
4️⃣ Optional Trend Filter
EMA-based higher-timeframe bias
Helps align scalps with dominant direction
Can be enabled or disabled
📈 Signals
BUY: Sell-side liquidity sweep → bullish displacement
SELL: Buy-side liquidity sweep → bearish displacement
Signals are plotted directly on the chart and can be used with alerts.
⚙️ Recommended Usage
Markets: XAUUSD, indices, liquid FX pairs
Timeframes: 1m–5m
Sessions: London & New York (best performance)
Risk Management: Always required — this tool does not place trades
Best used as a confirmation tool, not standalone.
⚠️ Important Notes
This indicator is inspired by liquidity-based scalping concepts, not an exact replication of any individual trader’s private strategy.
No indicator predicts the future — this tool highlights high-probability scenarios, not guarantees.
Past performance is not indicative of future results.

Scalping ~ Maniesh🔥 Fibonacci Scalping Indicator
This indicator is built for precision scalping using ACR (Average Candle Range) combined with Fibonacci-based premium & discount zones.
It helps traders identify high-probability reaction areas instead of chasing random moves.
🧠 Indicator Logic
Calculates ACR to understand current market volatility
Uses Fibonacci levels on the ACR range
Clearly marks Premium & Discount zones
Helps filter overextended price moves
Designed for reaction-based scalping, not blind entries
⏱ Best Timeframes
1m / 3m
Works best during London & New York sessions
📌 How to Use
Look for price reaching Fib
Wait for price reaction or confirmation
Enter scalps with tight stop-loss
Ideal for quick entries & partial exits
This indicator does not give buy/sell signals.
It is a framework tool to improve execution and timing.
⚠️ Disclaimer
Trading involves risk.
Always use proper risk management and backtest before live trading.

Adaptive Z-Score Oscillator [QuantAlgo]🟢 Overview
The Adaptive Z-Score Oscillator transforms price action into statistical significance measurements by calculating how many standard deviations the current price deviates from its moving average baseline, then dynamically adjusting threshold levels based on historical distribution patterns. Unlike traditional oscillators that rely on fixed overbought/oversold levels, this indicator employs percentile-based adaptive thresholds that automatically calibrate to changing market volatility regimes and statistical characteristics. By offering both adaptive and fixed threshold modes alongside multiple moving average types and customizable smoothing, the indicator provides traders and investors with a robust framework for identifying extreme price deviations, mean reversion opportunities, and underlying trend conditions through the visualization of price behavior within a statistical distribution context.
🟢 How It Works
The indicator begins by establishing a dynamic baseline using a user-selected moving average type applied to closing prices over the specified length period, then calculates the standard deviation to measure price dispersion:
basis = ma(close, length, maType)
stdev = ta.stdev(close, length)
The core Z-Score calculation quantifies how many standard deviations the current price sits above or below the moving average basis, creating a normalized oscillator that facilitates cross-asset and cross-timeframe comparisons:
zScore = stdev != 0 ? (close - basis) / stdev : 0
smoothedZ = ma(zScore, smooth, maType)
The adaptive threshold mechanism employs percentile calculations over a historical lookback period to determine statistically significant extreme zones. Rather than using fixed levels like ±2.0, the indicator identifies where a specified percentage of historical Z-Score readings have fallen, automatically adjusting to market regime changes:
upperThreshold = adaptive ? ta.percentile_linear_interpolation(smoothedZ, percentilePeriod, upperPercentile) : fixedUpper
lowerThreshold = adaptive ? ta.percentile_linear_interpolation(smoothedZ, percentilePeriod, lowerPercentile) : fixedLower
The visualization architecture creates a four-tier coloring system that distinguishes between extreme conditions (beyond the adaptive thresholds) and moderate conditions (between the midpoint and threshold levels), providing visual gradation of statistical significance through opacity variations and immediate recognition of distribution extremes.
🟢 How to Use This Indicator
▶ Overbought and Oversold Identification:
The indicator identifies potential overbought conditions when the smoothed Z-Score crosses above the upper threshold, indicating that price has deviated to a statistically extreme level above its mean. Conversely, oversold conditions emerge when the Z-Score crosses below the lower threshold, signaling statistically significant downward deviation. In adaptive mode (default), these thresholds automatically adjust to the asset's historical behavior, i.e., during high volatility periods, the thresholds expand to accommodate wider price swings, while during low volatility regimes, they contract to capture smaller deviations as significant. This dynamic calibration reduce false signals that plague fixed-level oscillators when market character shifts between volatile and ranging conditions.
▶ Mean Reversion Trading Applications:
The Z-Score framework excels at identifying mean reversion opportunities by highlighting when price has stretched too far from its statistical equilibrium. When the oscillator reaches extreme bearish levels (below the lower threshold with deep red coloring), it suggests price has become statistically oversold and may snap back toward the mean, presenting potential long entry opportunities for mean reversion traders. Symmetrically, extreme bullish readings (above the upper threshold with bright green coloring) indicate potential short opportunities or long exit points as price becomes statistically overbought. The moderate zones (lighter colors between midpoint and threshold) serve as early warning areas where traders can prepare for potential reversals, while exits from extreme zones (crossing back inside the thresholds) often provide confirmation that mean reversion is underway.
▶ Trend and Distribution Analysis:
Beyond discrete overbought/oversold signals, the histogram's color pattern and shape reveal the underlying trend structure and distribution characteristics. Sustained periods where the Z-Score oscillates primarily in positive territory (green bars) indicate a bullish trend where price consistently trades above its moving average baseline, even if not reaching extreme levels. Conversely, predominant negative readings (red bars) suggest bearish trend conditions. The distribution shape itself provides insight into market behavior, e.g., a narrow, centered distribution clustering near zero indicates tight ranging conditions with price respecting the mean, while a wide distribution with frequent extreme readings reveals volatile trending or choppy conditions. Asymmetric distributions skewed heavily toward one side demonstrate persistent directional bias, whereas balanced distributions suggest equilibrium between bulls and bears.
▶ Built-in Alerts:
Seven alert conditions enable automated monitoring of statistical extremes and trend transitions. Enter Overbought and Enter Oversold alerts trigger when the Z-Score crosses into extreme zones, providing early warnings of potential reversal setups. Exit Overbought and Exit Oversold alerts signal when price begins reverting from extremes, offering confirmation that mean reversion has initiated. Zero Cross Up and Zero Cross Down alerts identify transitions through the neutral line, indicating shifts between above-mean and below-mean price action that can signal trend changes. The Extreme Zone Entry alert fires on any extreme threshold penetration regardless of direction, allowing unified monitoring of both overbought and oversold opportunities.
▶ Color Customization:
Six visual themes (Classic, Aqua, Cosmic, Ember, Neon, plus Custom) accommodate different chart backgrounds and aesthetic preferences, ensuring optimal contrast and readability across trading platforms. The bar transparency control (0-90%) allows fine-tuning of visual prominence, with minimal transparency creating bold, attention-grabbing bars for primary analysis, while higher transparency values produce subtle background context when using the oscillator alongside other indicators. The extreme and moderate zone coloring system uses automatic opacity variation to create instant visual hierarchy, with darkest colors highlight the most statistically significant deviations demanding immediate attention, while lighter shades mark developing conditions that warrant monitoring but may not yet justify action. Optional candle coloring extends the Z-Score color scheme directly to the price candles on the main chart, enabling traders to instantly recognize statistical extremes and trend conditions without needing to reference the oscillator panel, creating a unified visual experience where both price action and statistical analysis share the same color language.

Sultan Weekly Level Manager XAUUSDThis script is a comprehensive "Level Management Utility" designed to help traders efficiently map, monitor, and react to their weekly Support and Resistance plans.
Instead of manually drawing rectangles and lines every week, this tool allows traders to input their specific price levels (Buy Zones, Sell Zones, and Invalidation Levels) into the settings. The script then automatically renders these zones, sets up alert conditions, and provides essential technical context (Trend and Momentum) in a single workspace.
Why this is a "Manager" (Use Case): Many traders execute "Level-to-Level" plans. This script streamlines that workflow by:
Visual Automation: Instantly drawing standardized zones based on user inputs.
Context Integration: Unlike simple drawing tools, this script integrates EMA Trend Filters (50/200 EMA) and RSI Momentum monitoring directly alongside the manual levels. This allows the trader to see if a price level is being approached with high momentum (RSI Overbought/Oversold) or against the major trend (EMA Cross), reducing the risk of blind limit orders.
Dashboard: A mini-dashboard tracks the current status (e.g., "Inside Buy Zone 1") so traders can assess the state of their plan at a glance.
How to Use:
Step 1: Open the settings and input your weekly Buy/Sell zone coordinates (High and Low prices). Note: The default values are placeholders; you must update them based on your analysis.
Step 2: Use the Trend Context (EMAs) to decide if you are trading with the flow or against it.
Step 3: Use the Momentum Context (RSI) to wait for overbought/oversold conditions before entering a zone.
Features:
Customizable Zones: 2 Buy Zones, 1 Sell Zone, 1 Invalidation Line.
Confluence Tools: Integrated 50/200 EMA and RSI readout.
Alerts: Built-in alert conditions trigger when price enters any of your defined zones.
Credits:
EMA and RSI logic are based on standard open-source library calculations.
Zone plotting logic utilizes standard Pine Script drawing functions.

Volume-Gated Trend Ribbon [QuantAlgo]🟢 Overview
The Volume-Gated Trend Ribbon employs a selective price-updating mechanism that filters market noise through volume validation, creating a trend-following system that responds exclusively to significant price movements. The indicator gates price updates to moving average calculations based on volume threshold crossovers, ensuring that only bars with significant participation influence the trend direction. By interpolating between fast and slow moving averages to create a multi-layered visual ribbon, the indicator provides traders and investors with an adaptive trend identification framework that distinguishes between volume-backed directional shifts and low-conviction price fluctuations across multiple timeframes and asset classes.
🟢 How It Works
The indicator first establishes a dynamic baseline by calculating the simple moving average of volume over a configurable lookback period, then applies a user-defined multiplier to determine the significance threshold:
avgVol = ta.sma(volume, volPeriod)
highVol = volume >= avgVol * volMult
The gated price mechanism employs conditional updating where the close price is only captured and stored when volume exceeds the threshold. During low-volume periods, the indicator maintains the last qualified price level rather than tracking every minor fluctuation:
var float gatedClose = close
if highVol
gatedClose := close
Dual moving averages are calculated using the gated price input, with the indicator supporting various MA types. The fast and slow periods create the outer boundaries of the trend ribbon:
fastMA = volMA(gatedClose, close, fastPeriod)
slowMA = volMA(gatedClose, close, slowPeriod)
Ribbon interpolation creates intermediate layers by blending the fast and slow moving averages using weighted combinations, establishing a gradient effect that visually represents trend strength and momentum distribution:
midFastMA = fastMA * 0.67 + slowMA * 0.33
midSlowMA = fastMA * 0.33 + slowMA * 0.67
Trend state determination compares the fast MA against the slow MA, establishing bullish regimes when the faster average trades above the slower average and bearish regimes during the inverse relationship. Signal generation triggers on state transitions, producing alerts when the directional bias shifts:
bullish = fastMA > slowMA
longSignal = trendState == 1 and trendState != 1
shortSignal = trendState == -1 and trendState != -1
The visualization architecture constructs a three-tiered opacity gradient where the ribbon's core (between mid-slow and slow MAs) displays the highest opacity, the inner layer (between mid-fast and mid-slow) shows medium opacity, and the outer layer (between fast and mid-fast) presents the lightest fill, creating depth perception that emphasizes the trend center while acknowledging edge uncertainty.
🟢 How to Use This Indicator
▶ Long and Short Signals: The indicator generates long/buy signals when the trend state transitions to bullish (fast MA crosses above slow MA) and short/sell signals when transitioning to bearish (fast MA crosses below slow MA). Because these crossovers only reflect volume-validated price movements, they represent significant level of participation rather than random noise, providing higher-conviction entry signals that filter out false breakouts occurring on thin volume.
▶ Ribbon Width Dynamics: The spacing between the fast and slow moving averages creates the ribbon width, which serves as a visual proxy for trend strength and volatility. Expanding ribbons indicate accelerating directional movement with increasing separation between short-term and long-term momentum, suggesting robust trend development. Conversely, contracting ribbons signal momentum deceleration, potential trend exhaustion, or impending consolidation as the fast MA converges toward the slow MA.
▶ Preconfigured Presets: Three optimized parameter sets accommodate different trading styles and market conditions. Default provides balanced trend identification suitable for swing trading on daily timeframes with moderate volume filtering and responsiveness. Fast Response delivers aggressive signal generation optimized for intraday scalping on 1-15 minute charts, using lower volume thresholds and shorter moving average periods to capture rapid momentum shifts. Smooth Trend offers conservative trend confirmation ideal for position trading on 4-hour to weekly charts, employing stricter volume requirements and extended periods to filter noise and identify only the most robust directional moves.
▶ Built-in Alerts: Three alert conditions enable automated monitoring: Bullish Trend Signal triggers when the fast MA crosses above the slow MA confirming uptrend initiation, Bearish Trend Signal activates when the fast MA crosses below the slow MA confirming downtrend initiation, and Trend Change alerts on any directional transition regardless of direction. These notifications allow you to respond to volume-validated regime shifts without continuous chart monitoring.
▶ Color Customization: Six visual themes (Classic, Aqua, Cosmic, Ember, Neon, plus Custom) accommodate different chart backgrounds and display preferences, ensuring optimal contrast and visual clarity across trading environments. The adjustable fill opacity control (0-100%) allows fine-tuning of ribbon prominence, with lower opacity values create subtle background context while higher values produce bold trend emphasis. Optional bar coloring extends the trend indication directly to the price bars, providing immediate directional reference without requiring visual cross-reference to the ribbon itself.
