ZigZag OrderBlock Retracement█ INTRODUCTION
What is an OrderBlock? It is simply Price where Banks (or Large Financial Entities) have Bought or Sold heavily (Support or Resistance Institutional Zone).
Our job as a trader is to monitor what the Banks and/or Large Investors are doing then patiently wait and have the opportunity to surf in their direction.
Large Financial Entities Buy during Price drops to get the best purchase Price. The Bank are acting a bit like us in our everyday life,
When we want Buying something, we always try to Buy it at the best price. And when we Sell, take the example of a used Car, we will systematically
try to Sell it at the highest possible Price. The Price of convertible Cars goes down during the Winter and goes up during the Summer.
So to make the best operation, if you Buy a second-hand convertible you will prefer to Buy it during the Winter and Sell it immediately in the Summer
and not Vice versa. So the way Large Institution act is exactly the same, it will expect the Price to Buy the fall and they will wait until
the Price rises in order to Sell. This is how the Profits will be made. The mistake that many Traders makes when they Trade emotionally is to act
in the opposite way of what they will do in everyday life. When we trade emotionally, we see the Price fall, instead of Buying while the Price drops we Sell.
In a similar emotional based act when the Price goes up we Buy, while when the Price goes up it's the best opportunity to Sell. So all the big moves
that you can watch on your different Instruments are the result of Banks or other Large Financial Entities. As Individuals, we do not have the necessary
“Strike Force” to create this type of movement. However, it is important to note that when Banks or Large Entities create this type of movement,
they do so despite theirs willing, they would love to be able to hide but luckily for us they can’t. When Billions of Dollars are Invested in Trades,
the effect can’t be concealed and as a result we will observe the impact on the market then as an Individual we’ll be able to see that on our Charts.
There are many ways to locate these areas of interest. But as they say, all roads lead to Rome. The purpose remains the Price Study
and in particular the movements of strong amplitude on the Chart. Large Financial Entities will keep acting in the same Price areas, Or at least we can say
that there's a high probability for them to intervene in these zones. Therefore, rather than chasing the Price moves and then to endure a counter move,
we will patiently wait until the Price returns to these areas on the basis that Banks and, or Large Entities will accumulate on their Positions
and are going to Sell and Buy in the same Price areas. Keep in mind that this logic works no matter what TimeFrame is used. However when the have Analysis
on Small TimeFrame (between M15 and H1) will make the movements observed between 20 and 50 Pips. Whereas if we look at H4 or Daily,
we can really see movements of 100 or even 200 Pips.
█ OVERVIEW
The ZigZag Indicator is used to illustrate Trend Lines without taking into account intermediate Retracements.
In a way, it allows you to get to the point by giving a simplified view of the evolution of Prices by eliminating "parasitic" movements, and thus to Position
and unwind Positions at the appropriate times. It is part of the category of Trend Indicators. We will simply define a Level of Price variation below which
they will not be taken into account by the indicator. This will eliminate all minor fluctuations, depending on the desired sensitivity.
The Indicator can only have 2 directions, Up or Down. For example, setting the Indicator to 5% (ZigZag Length ) will eliminate all variations below 5%.
If the Trend is Bullish and the Indicator therefore oriented in the same direction, Prices will have to fall by at least 5% for the direction
of the ZigZag to reverse Downward. Why using ZigZag to search for our OrderBlock? ZigZag makes it possible to clearly identify the current Trend as well
as significant Reversals and therefore have a much clearer vision of the actions carried out by Banks / Large Entities. However, it is drawn up
a posteriori and therefore does not make it possible to predict the evolution of Prices. The turning points are Indicated with a delay proportional
to the chosen sensitivity. The indicator calculates the Lowest Price over the given Period and eliminates Prices that are below the minimum requested
Array Size. Then, it calculates the Highest Price over the given Period and eliminates the Prices that are below the minimum requested Array Size.
Finally, it draws the Trend Line that connects the High and Low points determined previously and use the sum of the two to determinate the Range area.
█ HOW TO INTERPRET?
• The Indicator creates Lines that demonstrate past Retracements and current Pivots Levels to get a clearer view of the next Retracement area
using the Lines from the Last High and Low Pivots to determine which Take-Profit or Stop-Loss set.
• The "OrderBlocks" are detected based on the Pivots founds. You can display the Prices and use theses to help you set your Take-Profit during Retracement.
• Possibility to display the Levels of detected Pivots point. This can permit to dispense with the use of Elliot Waves or the use of a Fibonacci.
• Donchian ZigZag Channels to be sure to always have seen the extremities of the Top, Bottom and Range area.
• The ZigZag Length is set to 5 by default. You will have to adjust it according to selected TimeFrame or Financial Instrument used.
• The ZigZag has 3 adjustable colors:
-Green = Bullish Trend
-Red = Bearish Trend
-Orange = Range Zone
It is not advisable to enter Position when the ZigZag color indicates a Range Zone.
- OrderBlocks
- ZigZag + Pivots Point
- Donchian ZigZag Channel
█ ALERTS
Following the request of many users on our other script concerning the late arrival of Alerts for detected OrderBlocks (on Institutional OrderBlock Pressure), we fixed this problem here with the arrival INSTAN and CONFIRM ALERTS .
█ NOTES
- This script is not beginner's Level and is intended for Traders with advanced knowledge of ZigZag and the work of Michael j. Huddleston on the OrderBlocks.
Good Trade everyone and remember, risk management remains the most important!
Zigzag


TradeChartist Actuator™TradeChartist Actuator is an extremely functional indicator that converts the price action volatility and momentum into a meaningful trading system (based on user defined Standard Deviation Factor), that consists of expanding/contracting Volatility Range Bands, Dynamic Trend Support/Resistance Bands and 2 types of Breakout Signals in a visually stunning design. The script also neatly packs in ZigZag & manual/automatic Fibonacci Retracement tools, option to filter the signals using an external filter and other useful extras like ™TradeChartist Dollar Candles and much more.
===================================================================================================================
™TradeChartist Actuator User Manual
█ Actuator Range Bands
Actuator Range Bands consists of a Mean line, an Upper Band and a Lower Band which are based on user defined Standard Deviation Factor (Default - 1.618, Min - 0.5, Max - 2). The 1.618 factor works extremely well as the unnecessary volatility data of the bands are eliminated by Actuator's logic. In my personal tests, 1.618 works consistently better than any other value in visually showcasing the true volatility range. By eliminating the unnecessary volatility data from the original non-stabilized bands, Actuator helps detect price momentum by detecting two types of breakouts.
Bands Breakout - Filtered
When the price breaks out of the upper or lower band after a trend, there is a strong possibility of a reversal especially when the volatility expansion/contraction takes place. This is detected using a built in filter with the Filtered Bands Breakout and the user can choose to use the closing price or High/Low price as the trigger for breakouts. This trade setup is very useful especially at zones where the Actuator Range Bands contract or squeeze after an expansion as shown in the OANDA:XAUUSD 1hr chart below.
Also, after a consistent expansion of the bands with price trending in the upper channel or the lower channel, users can spot good profit taking or Short trade opportunities with confirmation of overbought price and if possible a strong bear divergence as show in the BINANCE:LUNAUSDTPERP 1hr chart below.
It can be seen from the chart above that even though Actuator is designed to detect Extreme Bands Breakout using High/Low price, it is done with a little bit of filtering by the script logic and hence didn't generate a Bear signal at the lower band support zone.
Mean Breakout - Filtered
In most Mean Reversion models, mostly oscillators, the mean plays an important role in helping traders predict the price dynamic, but it also presents a challenge whether that mean will act as support or resistance so the trader can take a position that will have a high probability of success. Filtered Mean Breakout helps exactly to identify the price dynamic at the mean zone and helps reduce the dilemma. Actuator uses Volatility Trend and Momentum of the price action at mean to determine Bull/Bear breakouts. Following NASDAQ:AAPL 1hr chart shows an example of 2 instances of Filtered Mean Breakout detection, one bull and one bear and further area where no Breakout was detected in spite of price crossing the mean.
This Breakout type is really helpful in spotting early moves and also reduces the high volatility risk of Extreme Bands Breakout in some cases.
===================================================================================================================
█ External Filter
Actuator breakout signals can be further filtered using the feature of connecting an external signal as a trade filter.
External filter like RSI , MACD etc. can be used to filter breakouts by connecting to ™TradeChartist Actuator under ╔═══ 𝗣𝗹𝘂𝗴 𝗙𝗶𝗹𝘁𝗲𝗿 𝗵𝗲𝗿𝗲 ═══ 🔌 dropdown by enabling 𝐔𝐬𝐞 𝐄𝐱𝐭𝐞𝐫𝐧𝐚𝐥 𝐅𝐢𝐥𝐭𝐞𝐫.
To get the external filter to work, 𝐒𝐢𝐠𝐧𝐚𝐥 𝐓𝐲𝐩𝐞 must be set right. For plots that are non oscillatory like Moving Averages, Super Trend etc., choose type as Non Oscillatory and for Oscillators like RSI , CCI , MACD etc., choose type as Oscillatory .
For Oscillators, levels must be specified for 𝐎𝐬𝐜𝐢𝐥𝐥𝐚𝐭𝐨𝐫 𝐁𝐮𝐥𝐥 𝐅𝐢𝐥𝐭𝐞𝐫 𝐯𝐚𝐥𝐮𝐞 and 𝐎𝐬𝐜𝐢𝐥𝐥𝐚𝐭𝐨𝐫 𝐁𝐞𝐚𝐫 𝐅𝐢𝐥𝐭𝐞𝐫 𝐯𝐚𝐥𝐮𝐞, especially if the Oscillator doesnt have 0 as midline, like RSI . Even for 0 mid oscillators like CCI , filter levels like 100/-100 work effectively to filter noise.
Use 𝐁𝐮𝐥𝐥/𝐁𝐞𝐚𝐫 𝐁𝐚𝐜𝐤𝐠𝐫𝐨𝐮𝐧𝐝 𝐅𝐢𝐥𝐥 under Actuator Visuals section to paint the trade zones background. It helps visually see the effect of filters on the breakout entries and also the trade performance.
The following chart shows the Filter settings with ™TradeChartist Momentum Drift Oscillator connected to Actuator as Oscillatory signal with filter values 0.
The two example charts of 1hr BINANCE:BTCUSDT below shows the difference in Actuator signals based on Oscillatory signal from ™TradeChartist Momentum Drift Oscillator and the difference can be seen from the highlighted Bull/Bear Background Fill.
Without External Filter
With External Filter
===================================================================================================================
█ Dynamic Trend Support/Resistance Bands
In addition to Volatility Range Bands, Actuator also plots Dynamic Trend Support and Resistance bands that are more sensitive to price action and helps the user determine growing support/resistance which is indicated by coloured dots. These dots normally appear when the Support or Resistance stays at the same level for a few bars and change between Bull and Bear colours based on how the price interacts with them as shown below.
===================================================================================================================
█ Useful Trade Tools
™TradeChartist Dollar Candles
Dollar Candles help detect the volatility exhaustion prices and plots $ signs to help the trader take profits or move stop loss levels to secure gains. The $ signs do not appear for every trade zone, but whenever price hits a critical level, it shows up above price bar (for Bull trend) or below price bar (for Bear trend) in real time. Users can also set alerts for Dollar Candles with Once Per Bar setting. The Daily NASDAQ:TSLA chart below shows the Dollar Candles on both Bull and Bear trends.
It is important to note that taking pockets of profits on a leveraged trade position or moving up stop loss to maximize trend gains at $ candles will help increase Average Profitability Per Trade (APPT) .
Bull/Bear Background Fill
Bull/Bear Background Fill paints the trade zones in Bull and Bear colours. This helps visualize the difference in trade zones when testing various settings and also helps analyze past performance of Actuator Signals with or without the use of External Filter.
Entry Stop Loss Reference
Reference zone for stop loss has always been a tricky one for traders. Using a fixed percentage stop at entry may not be best during high volatility moves. Over the extensive period of Actuator testing, a simple solution to this problem was found. The previous trend's Range Bands Mean Line served as a perfect reference point for Entry Stop. Also while analysing this Mean line, it was found to be a perfect horizontal support/resistance line and also helped detect unproductive trades. The example 15m chart of NASDAQ:AMD shows how the Entry Stop Loss Reference performed.
Stop Line Touch Points plot orange touch points on the Stop Line whenever the price hits it during the trade.
Actuator Colour Bars
Actuator Colour Bars paints the Momentum Strength on the price bars. This helps visually see the price bars venturing into the Overbought or the Oversold zones. Also, this feature also helps spot divergences as higher highs or lower lows with less intense Bull/Bear colour than the previous high/low shows diminishing momentum as shown in the 1h chart of OANDA:GBPJPY below.
===================================================================================================================
█ ZigZag & Fibonacci Toolkit
Actuator plots developing and completed ZigZags based on Bull and Bear trend depending on the Breakout Type and Breakout Price from the settings.
Option to enable or disable 𝐙𝐢𝐠𝐙𝐚𝐠 𝐂𝐨𝐧𝐧𝐞𝐜𝐭𝐨𝐫 which can be helpful for Harmonic traders.
Option to display 𝐙𝐢𝐠𝐙𝐚𝐠 𝐇𝐢𝐠𝐡𝐬/𝐋𝐨𝐰𝐬 and 𝐑𝐒𝐈 𝐚𝐭 𝐇𝐢𝐠𝐡𝐬/𝐋𝐨𝐰𝐬 in one of two styles.
Two types of Fibonacci to choose from - 𝐀𝐮𝐭𝐨-𝐅𝐢𝐛𝐬 and 𝐅𝐢𝐛𝐬 𝐛𝐚𝐬𝐞𝐝 𝐨𝐧 𝐋𝐨𝐨𝐤𝐛𝐚𝐜𝐤.
𝐀𝐮𝐭𝐨-𝐅𝐢𝐛𝐬 option plots Auto Fibonacci levels based on Bull/Bear trend depending on user specified Breakout Type and Breakout Price.
𝐅𝐢𝐛𝐬 𝐛𝐚𝐬𝐞𝐝 𝐨𝐧 𝐋𝐨𝐨𝐤𝐛𝐚𝐜𝐤 plots Fibonacci levels based on the highest high and lowest low of the lookback period (𝐃𝐚𝐲𝐬 or 𝐂𝐚𝐧𝐝𝐥𝐞𝐬).
Fibonacci levels can be reversed by enabling 𝐑𝐞𝐯𝐞𝐫𝐬𝐞 from settings.
Enabling 𝐂𝐮𝐫𝐫𝐞𝐧𝐭 𝐏𝐫𝐢𝐜𝐞 𝐅𝐢𝐛 𝐋𝐚𝐛𝐞𝐥 displays the current Fib level of the developing price bar.
Option to customize Fib levels and colours.
4hr chart of BINANCE:BTCUSDT showing Auto Fibonacci levels, Zig-Zag with Trend High/Lows, Zig-Zag connectors with Fib Ratios and RSI at Trend High/Low prices.
Note:
If momentum doesn't slow down, the fibs can extend beyond 1 and may continue way beyond 4.618 fib level. These are quite rare depending on how distant the near high/low is based.
ZigZag and Fibonacci are good reference indicators and should always be used as confirmations rather than standalone indicators.
===================================================================================================================
█ Actuator Colour Scheme
Actuator employs 3 built in colour schemes namely Chilli , Flame and Sublime Grayscale and a versatile colour scheme Custom which enables the user to customise the colour combinations of the components of the Actuator script.
===================================================================================================================
█ Alerts
Alerts can be created for the following.
Actuator Bull Breakout Signal - Once Per Bar Close
Actuator Bear Breakout Signal - Once Per Bar Close
Actuator Long Dollar - Take Profit - Once Per Bar
Actuator Short Dollar - Take Profit - Once Per Bar
Actuator Stop Line Hit - Once Per Bar
Note: The script doesn't repaint, so the alerts can be used with confidence. To check this, users can do bar replays to check if the plots and markers stay in the same place.
===================================================================================================================
Best Practice: Test with different settings first using Paper Trades before trading with real money
===================================================================================================================

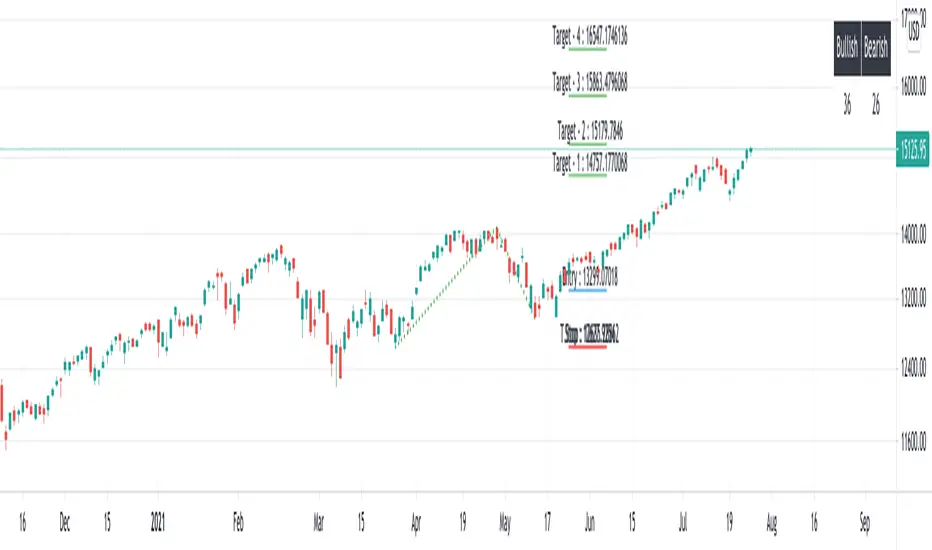
Jeges JigsThis is a combination of all my old indicators, with an added feature for trend lines (inspiration for this came from Wedge Maker script thanks to veryfid, I hope he doesn't mind).
This script looks for a period with increased volatility , as measured by ATR ( Average True Range ), then it looks for a high or a low in that area.
When price is above EMA (400 is default, can be changed), it looks for the highs and adds multiples of ATR to the high. Default values for multipliers are 3,9 and 27, meaning that the script will show 3xATR level above the high, 9xATR above the high and 27xATR above the high.
When price is below EMA it looks for the lows and subtracts multiples of ATR from the low.The script will show 3xATR level below the low, 9xATR below the low and 27xATR below the low.
Multipliers values can be changed as well, making it a versatile tool that shows potential levels of suppport/resistance based on the volatility .
Possible use cases:
Breakout trading, when price crosses a certain level, it may show potential profit targets for trades opened at a breakout.
Stoploss helper. Many traders use ATR for their stoplosses, 1 ATR below the swing low for long trades and 1 ATR above the swing high for short trades are common values used by many traders. In this case, the Lookback value comes handy, if we want to look maybe at a more recent value for swing high/low point.
It highlights ATR peaks, it also displays Bollinger bands of SMA400 (or Ema), breakouts for upper/lower bands.
Another thing you get is Parabolic SAR and Zigzag based on SAR.
ZigZag reSampledthis indicator looks like the default ZigZag indicator but it uses the price action instead of the deviation%
ZigZag Chart with SupertrendHello All,
This script creates Zigzag Chart by using Zigzag waves, so it's timeless chart meaning that no time dependency on X-axis. Optionally it can calculate & show Zigzag Supertrend or Simple Moving Average. Also it can change bar colors of the main chart by trend direction of Zigzag Supertrend.
As seen below, each zigzag wave is a candle on Zigzag chart:
You have a few options and using these options you can find best settings for the securities/timeframes.
You can change Zigzag period, if you change Zigzag Period then all zigzag and the chart is recalculated/reconstructed.
You have option to show Zigzag Supertrend or Zigzag Moving Average, the options you have;
- You can change ATR Length and ATR multiplier for supertrend
- You can change Length for Simple Moving Average
You can change Zigzag candle & wick colors using options. Also you have option to change bar colors according to Zigzag Supertrend direction.
As it's timeless chart, below you can see how/when bar colors and Zigzag Supertrend change:
You can see Simple Moving Average of the Zigzag Candles:
You can play with ATR length and multiplier to find best supertrend:
You can play with the candle & wick colors:
Enjoy!

Multi-ZigZag Multi-Oscillator Trend DetectorThis table is intended to give you snapshot of how price and oscillators are moving along with zigzag pivots.
This is done in the same lines of Zigzag-Trend-Divergence-Detector
But, here are the differences
Table shows multiple oscillator movements at a same time instead of one selected oscillator
Divergence is not calculated and also supertrend based trend. Trend can be calculated based on zigzag movements. However, lets keep this for future enhancements.
This system also uses multiple zigzags instead of just one.
⬜ Process
▶ Derive multiple zigzags - Code is taken from Multi-ZigZag
▶ Along with zigzags - also calculate different oscillators and attach it to zigzag pivot.
▶ Calculate directions of zigzag pivots and corresponding oscillators.
▶ Plot everything in the table on last bar.
⬜ Table components
Table contains following data:
Directional legends are:
⇈ - Higher High (Green)
⇊ - Lower Low (Red)
⭡- Lower High (Orange)
⭣ - Higher Low (Lime)
⬜ Input Parameters
▶ Source : Default is close. If Unchecked - uses high/low data for calculating pivots. Can also use external input such as OBV
▶ Stats : Gives option to select the depth of output (History) and also lets you chose text size and table position.
▶ Oscillators : Oscillator length is derived by multiplying multiplier to zigzag length. For example, for zigzag 5, with 4 as multiplier, all oscillators are calculated with length 20. But, same for zigzag 8 will be 32 and so on.
▶ Available oscillators :
CCI - Commodity Channel Index
CMO - Chande Momentum Oscillator
COG - Center Of Gravity
MFI - Money Flow Index (Shows only if volume is present)
MOM - Momentum oscillator
ROC - Rate Of Change
RSI - Relative Strength Index
TSI - Total Strength Index
WPR - William Percent R
BB - Bollinger Percent B
KC - Keltner Channel Percent K
DC - Donchian Channel Percent D
ADC - Adoptive Donchian Channel Percent D ( Adoptive-Donchian-Channel )
⬜ Challenges
There are 12 oscillators and each zigzag has different length. Which means, there are 48 combinations of the ocillators.
First challenge was generating these values without creating lots of static initialization. Also, note, if the functions are not called on each bar, then they will not yield correct result. This is achieved through initializer function which runs on every bar and stores the oscillator values in an array which emulates multi dimensional array oscillator X zigzag length.
Next challenge was getting these values within function when we need it. While doing so I realized that values stored in array also have historical series and calling array.get will actully get you the entire series and not just the value. This is an important takeaway for me and this can be used for further complex implementations.
Thanks to @LonesomeTheBlue and @LucF for some timely suggestions and interesting technical discussions :)

Momentum-based ZigZag (incl. QQE) NON-REPAINTINGI spent a lot of time searching for the best ZigZag indicator. Difficulty with all of them is that they are always betting on some pre-defined rules which identify or confirm pivot points. Usually it is time factor - pivot point gets confirmed after a particular number of candles. This methodology is probably the best when market is moving relatively slow, but when price starts chopping up and down, there is no way the ZigZag follows accurately. On the other hand if you set it too tight (for example pivot confirmation after only 2 or even 1 candle), you will get hundreds of zigzag lines and they will tell you nothing.
My point of view is to follow the market. If it has reversed, then it has reversed, and there is no need to wait pre-defined number of candles for the confirmation. Such reversals will always be visible on momentum indicators, such as the most popular MACD. But a single-line moving average can be also good enough to notice reversals. Or my favourite one - QQE, which I borrowed (and improved) from JustUncleL, who borrowed it from Glaz, who borrowed it from... I don't even know where Quantitative Qualitative Estimation originates from. Thanks to all these guys for their input and code.
So whichever momentum indicator you choose - yes, there is a pick-your-poison-type selector as in in-famous Moving Average indicators - once it reverses, a highest (or lowest) point from the impulse is caught and ZigZag gets printed.
One thing I need to emphasize. This indicator DOES NOT REPAINT. It might look like the lines are a bit delayed, especially when compared to all the other ZigZag indicators on TradingView, but they are actually TRUE. There is a value in this - my indicator prints pivot points and Zigzag exactly on the moment they have been noticed, not earlier faking to be faster than they could be.
As a bonus, the indicator marks which impulse had strength in it. It is very nice to see a progressing impulse, but without force - a very likely that reversal on a bigger move is happening.
I'm about to publish some more scripts based on this ZigZag algo, so follow me on TradingView to get notified.
Enjoy!

Trading ABCHello Traders,
For a few months I have been getting requests from my followers about ABC pattern and finally I decided to make this indicator.
How it works?
- It creates Trend Cloud using Simple and Exponential moving averages with the lenghts 50, 100, 150, 200, 20, 40 by default and checks the trend. you can change the lengths as you wish
- It also creates ZigZag using the ZigZag Period in the options.
- Using last 2 zigzag waves it checks if there is suitable ABC pattern according the Trend, the Min/Max Fibonacci levels and Error Rate
- Then it check if the price bounces after this ABC pattern
- And if all these conditions met then it plot triangle
- If there are multiple bouncing then you can see multiple triangles
You can change/set;
- Zigzag Period
- Fibonacci Max level
- Fibonacci Min Level
- Error Rate
- The Lengths that are used for Moving Averages
- Keeping old ABC lines/labels
- Show Zigzag and min/max Fibonacci levels
- Show Trend Cloud
- and colors
if you don't want to see old ABC lines/labels you can disable it:
if you don't want to see Trend Cloud you can disable it:
Zigzag and Fibonacci levels:
P.S. if you have new ideas to improve this indicator then let me know please. We together can do this life easier!
Enjoy!

TradeChartist ZigZag & Auto Fibonacci Retracement™TradeChartist ZigZag & Auto Fibonacci Retracement is a visually engaging script that generates ZigZag and Auto-Fibonacci lines/labels based on user defined sensitivity factor.
===================================================================================================================
█ ™TradeChartist ZigZag & Auto Fibonacci Retracement Features
=========================================
Plots completed and developing ZigZag based on 𝐙𝐢𝐠𝐙𝐚𝐠/𝐀𝐮𝐭𝐨-𝐅𝐢𝐛𝐬 𝐅𝐚𝐜𝐭𝐨𝐫 (Minimum - 1, Maximum - 10, Default - 5) that adjusts the sensitivity of the ZigZag with 1 being High Sensitivity and 10 being Low Sensitivity.
Option to enable or disable 𝐙𝐢𝐠𝐙𝐚𝐠 𝐂𝐨𝐧𝐧𝐞𝐜𝐭𝐨𝐫 which can be helpful for Harmonic traders.
Option to display 𝐙𝐢𝐠𝐙𝐚𝐠 𝐇𝐢𝐠𝐡𝐬/𝐋𝐨𝐰𝐬 and 𝐑𝐒𝐈 𝐚𝐭 𝐇𝐢𝐠𝐡𝐬/𝐋𝐨𝐰𝐬 in one of two styles.
Two types of Fibonacci to choose from - 𝐀𝐮𝐭𝐨-𝐅𝐢𝐛𝐬 and 𝐅𝐢𝐛𝐬 𝐛𝐚𝐬𝐞𝐝 𝐨𝐧 𝐋𝐨𝐨𝐤𝐛𝐚𝐜𝐤.
𝐀𝐮𝐭𝐨-𝐅𝐢𝐛𝐬 option plots Auto Fibonacci levels based on 𝐙𝐢𝐠𝐙𝐚𝐠/𝐀𝐮𝐭𝐨-𝐅𝐢𝐛𝐬 𝐅𝐚𝐜𝐭𝐨𝐫.
𝐅𝐢𝐛𝐬 𝐛𝐚𝐬𝐞𝐝 𝐨𝐧 𝐋𝐨𝐨𝐤𝐛𝐚𝐜𝐤 plots Fibonacci levels based on the highest high and lowest low of the lookback period (𝐃𝐚𝐲𝐬 or 𝐂𝐚𝐧𝐝𝐥𝐞𝐬).
Fibonacci levels can be reversed by enabling 𝐑𝐞𝐯𝐞𝐫𝐬𝐞 from settings.
Enabling 𝐂𝐮𝐫𝐫𝐞𝐧𝐭 𝐏𝐫𝐢𝐜𝐞 𝐅𝐢𝐛 𝐋𝐚𝐛𝐞𝐥 displays the current Fib level of the developing price bar.
Option to customize Fib levels and colours.
4 Colour themes and option to enable/disable bar colouring.
===================================================================================================================
█ Example charts
1. ZigZag/AutoFibs Factor can make a big difference to ZigZag and AutoFibs plot as shown in the OANDA:XAUUSD Daily chart below.
2. RSI can be quite useful in analysing the Highs and Lows as shown in the BINANCE:BTCUSDT 1hr chart below.
3. Developing or Current Trend means the Low/High is unconfirmed and can move as shown in the OANDA:EURUSD 1hr chart below with bar colouring.
4. Current Price Fib Level label showing PTC means Potential Trend Change. Confirmation at candle close will reverse the Auto-Fibs as shown in BINANCE:ETHUSDT 15m chart below
5. Fibonaci Levels and colours can be customised using 𝐔𝐬𝐞 𝐂𝐮𝐬𝐭𝐨𝐦 𝐅𝐢𝐛 𝐋𝐞𝐯𝐞𝐥𝐬 from the settings as shown in the AMEX:SPY 15m chart below
█ Note:
Rarely, a steep high/low wick doesn't get accounted in the ZigZag High/Low detection as they are filtered using momentum.
If momentum doesn't slow down, the fibs can extend beyond 1 and may continue way beyond 4.618 fib level. These are quite rare depending on how distant the near high/low is based.
ZigZag and Fibonacci are good reference indicators and should always be used as confirmations rather than standalone indicators.
===================================================================================================================
Best Practice: Test with different settings first using Paper Trades before trading with real money
===================================================================================================================

Average Zigzag Range (AZR)Here is an attempt calculate Average Zigzag Range (AZR). This can be used similar to ATR. Using AZR instead of ATR for trailing stop calculation may yield better outcome in trend trading.
Logic is simple.
Calculate zigzag based on ZigzagLength
Calculate distance between each zigzag pivots
Calculate simple moving average of last MALength pivots
Use DoubleMA option to further smooth AZR using a Secondary Moving Average

Zigzag CloudThis is Bollinger Band built on top of Zigzags instead of regular price + something more.
Indicator presents 7 lines and cloud around it. This can be used to visualize how low or high price is with respect to its past movement.
Middle line is moving average of last N zigzag pivots
Lines adjacent to moving average are also moving averages. But, they are made of only pivot highs and pivot lows. Means, line above moving average is pivot high moving average and line below moving average is pivot low moving average.
Lines after pivot high/low moving averages are upper and lower bolllinger bands based on Moving Average Line with 2 standard deviation difference.
Outermost lines are bollinger band top of Moving average pivot high and bollinger band bottom of moving average pivot low.

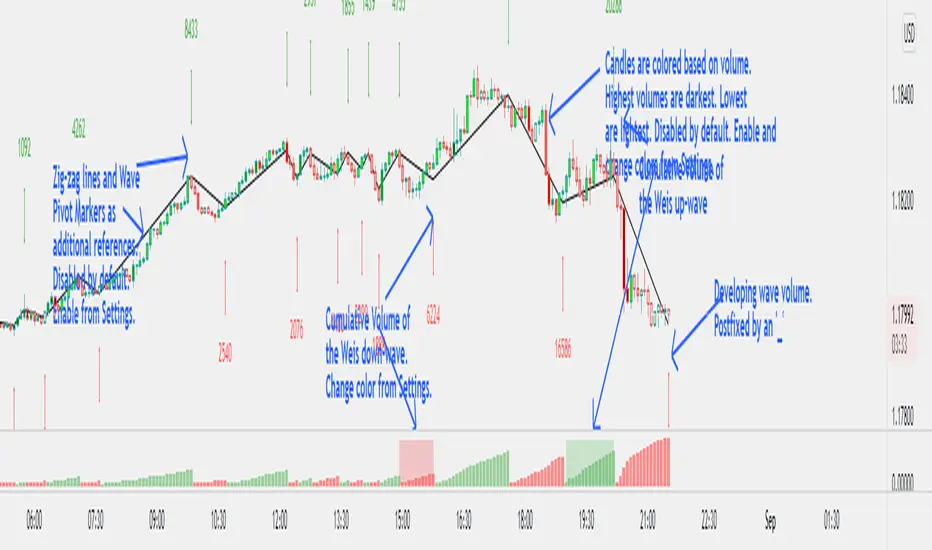
Weis Wave Volume NumbersWhat is it?
This is an indicator to complement @modhelius' Weis Wave Volume Indicator.
Original code has been modified to display wave volume (cumulative) numbers above or below the latest candle of the corresponding wave on the main pane. Since we are concerned only with relative volume, VOLUME NUMBERS HAVE BEEN SCALED DOWN. (If you need actual volume numbers, uncheck "Scale Down Volume" option in Settings). Rising wave volume is denoted in green. Falling wave volume is denoted in red. Developing wave volume is postfixed with a '_'. Confirmed wave volumes won't have this.
Who is it for?
This indicator is useful if you already use Weis Waves in your analysis and could do with an additional numerical representation of the wave volume on the main pane. Can be used in conjunciton with @modhelius' Weis Wave Volume (WWV) indicator (need to be added separately) to complement the visual representation of the waves. Can be used independently as well.
Pelase note that if you use any other Weis Wave indicator (other than @modhelius'), the numbers and the waveforms might not match.
Elliot Wave - ImpulseLets dabble a bit into Elliot Waves.
This is a simple script which tries to identify Wave 1 and 2 of Elliot Impulese Wave and then projects for Wave 3.
Ratios are taken from below link: elliottwave-forecast.com - Section 3.1 Impulse
Wave 2 is 50%, 61.8%, 76.4%, or 85.4% of wave 1 - used for identifying the pattern.
Wave 3 is 161.8%, 200%, 261.8%, or 323.6% of wave 1-2 - used for setting the targets
Important input parameters
Length : Zigzag Length. Keep the numbers low if you are looking for smaller and shorter trades. Keep the numbers high if you are looking for longer and bigger trades.
Error Percent : Adjustments for ratios as it is not always possible to find exactly equal retracement ratio.
Entry Percent : Once Wave 2 is formed, entry is set after reversing 30% of wave 2. This number can be increased or decreased. Caution: Keeping the number too low may result in false signals.
Ignore Trend Direction : If unchecked, it will only look for pattern if Wave 1 has made a higher high. If not, it will ignore Wave 1 condition and only look at wave 1 to 2 ratio.
Handle Duplicates : Since, the labels are generated upon crossover of entry price, this crossover may happen multiple times. Or sometimes wave 2 can further extend and generate new signal with same wave 1. This parameter says how to handle such cases. Keep Last is set to default and is most preferred option.
ShowRatios and ShowWaves lets you display wave line and retracement ratios for each pivots
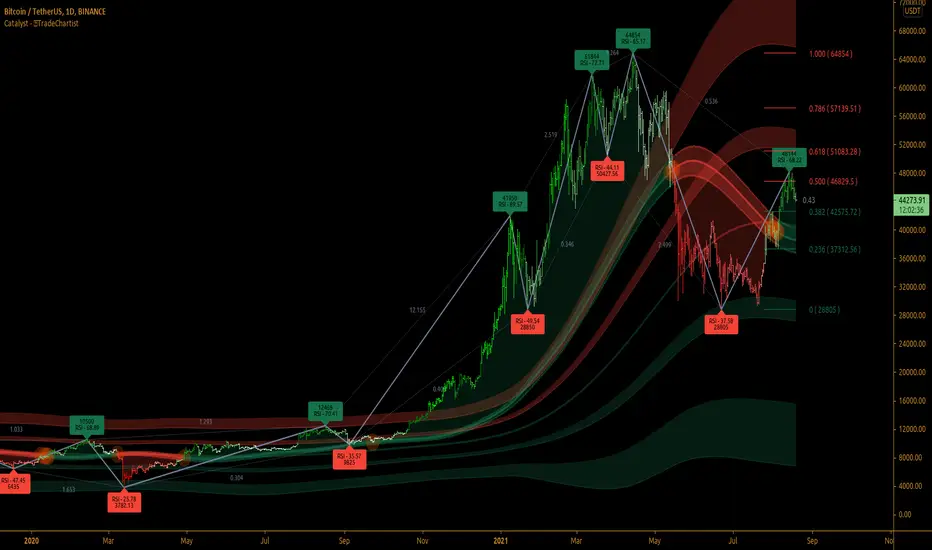
TradeChartist Catalyst™TradeChartist Catalyst is an elegant script that combines Catalyst Trade Bands and automatic ZigZag/Fibonacci plots using an original logic to help users interact in a visually engaging and meaningful way with the charts.
===================================================================================================================
™TradeChartist Catalyst features
=============================
1. Catalyst Trade Bands
Catalyst Trade Bands comprises Equilibrium or Mean Bands, Inner Bands, Outer Bands and a Overall Mean Line. Catalyst Trade Bands help visualize the price action in relation to the Equilibrium Bands and clearly show how far away from the mean the current price is. The Trade Bands are of two types - Normal and Weighted. Weighted Bands are very sensitive to price action and a higher Bands length is recommended.
Simple 144 vs Weighted 144 Trade Bands
2. Equilibrium Touch Points
Every time the price touches the Equilibrium, an orange touch point appears on the chart. Normally, the Equilibrium line, for an optimal sample, acts as support or resistance. Price breaching or failing this line usually signals a Pull Back, a Throw Back or a Trend Change based on how the price interacts with it. This can be used with a secondary confirmation like RSI, Stochastic etc. For example, if the price falls back significantly only to touch the Equilibrium Line and fails to test the Overall Mean Line when Stochastic is below 30, this could mean a strong Pull Back rather than a Trend Change as shown in the example chart below.
When price fails the Equilibrium Bands, the fill colour of the Equilibrium bands changes to Bearish colour. If the Overall Mean line is below the Equilibrium bands and is in a reasonable distance, Mean will act as support as shown in the example below. Price failing the mean will test Inner Bands and strong bear momentum could take price to Outer Bands and beyond.
All the components of the Catalyst Trade Bands including the Touch Points can be enabled or disabled from the settings.
3. ZigZag & Fibonacci
Catalyst automatically plots ZigZag and Auto Fibonacci Retracement based on an intelligent logic and can be tweaked by changing the Zigzag & Auto-Fibs Factor from the settings. It also plots Fib ratios and connectors along with price highs and lows of ZigZag. The ratios can be especially useful to visually detect harmonic patterns and also serves as a useful feature for Fibonacci traders.
4. Fibonacci Customisation
Catalyst users can customise Fibonacci type and levels, including levels colour from Catalyst settings. In addition to Auto-Fibs, users can also plot Fibonacci levels based on Days or Candles lookback. This is a very useful feature if the user wants to override Auto-Fibs to suit his/her needs. Users can also reverse the Fibonacci Levels by enabling Reverse from settings.
In the following example chart of OANDA:USDCAD , Fibonacci levels based on 10 days lookback is plotted.
===================================================================================================================
Best Practice: Test with different settings first using Paper Trades before trading with real money
===================================================================================================================
Linear Regression & RSI Multi-Function Screener with Table-LabelHi fellow traders..
Happy to share a Linear Regression & RSI Multi-Function Custom Screener with Table-Labels...
The Screener scans for Linear Regression 2-SD Breakouts and RSI OB/OS levels for the coded tickers and gives Summary alerts
Uses Tables (dynamica resizing) for the scanner output instead of standard labels!
This Screener cum indicator collection has two distinct objectives..
1. Attempt re-entry into trending trades.
2. Attempt Counter trend trades using linear regression , RSI and Zigzag.
Briefly about the Screener functions..
a. It uses TABLES as Labels a FIRST for any Screener on TV.
b. Tables dynamically resize based on criteria..
c. Alerts for breakouts of the UPPER and the LOWER regression channels.(2 SD)
d. In addition to LinReg it also Screens RSI for OB/OS levels so a multifunction Screener.
e. Of course has the standard summary Alerts and programmable format for Custom functions.
f. Uses only the inbuilt Auto Fib and Lin Reg code for the screener.(No proprietary stuff)
g. The auto Zigzag code is derived(Auto fib).
Question what are all these doing in a single screener ??
ZigZag is very useful in determining Trend Up or Down from one Pivot to another.
So Once you have a firm view of the Current Trend for your chosen timeframe and ticker…
We can consider few possible trading scenarios..
a. Re-entry in an Up Trend - Combination of OS Rsi And a Lower Channel breach followed by a re-entry back into the regression channel CAN be used as an effective re-entry.
b. Similarily one can join a Down Trend on OB Rsi and Upper Channel line breach followed by re-entry into the regression channel.
If ZigZag signals a range-bound market, bound within channel lines then the Upper breakout can be used to Sell and vice-versa!
In short many possibilities for using these functions together with Scanner and Alerts.
This facilitates timely PROFITABLE Trending and Counter trend opportunities across multiple tickers.
You must give a thorough READ to the various available tutorials on ZigZag / Regression and Fib retracements before attempting counter trend trades using these tools!!
A small TIP – Markets are sideways or consolidating 70% of the time!!
Acknowledgements: - Thanks a lot DGTRD for the Auto ZigZag code and also for the eagerness to help wherever possible..Respect!!
Disclaimer: The Alerts and Screener are just few tools among many and not any kind of Buy/Sell recommendations. Unless you have sufficient trading experience please consult a Financial advisor before investing real money.
*The alerts are set for crossovers however for viewing tickers trading above or below the channel use code in line 343 and 344 after setting up the Alerts!
** RSI alerts are disabled by default to avoid clutter, but if needed one can activate code lines 441,442,444 and 445
Wish you all, Happy Profitable Trading!

Auto Fib Time Zones and Trend-Based Fib Time by DGTFibonacci time zones, based on the Fibonacci number sequence, are vertical lines that represent potential areas where a swing high, low, or reversal could occur.
Trend-Based Fib Time shows probable price corrections in an existing trend. A useful tool to use in addition to Elliot Wave counting, Fib Time helps to identify how far the wave is likely to travel
Please note, Time zones aren't concerned with price, only time
Disclaimer :
Trading success is all about following your trading strategy and the indicators should fit within your trading strategy, and not to be traded upon solely
The script is for informational and educational purposes only. Use of the script does not constitute professional and/or financial advice. You alone have the sole responsibility of evaluating the script output and risks associated with the use of the script. In exchange for using the script, you agree not to hold dgtrd TradingView user liable for any possible claim for damages arising from any decision you make based on use of the script

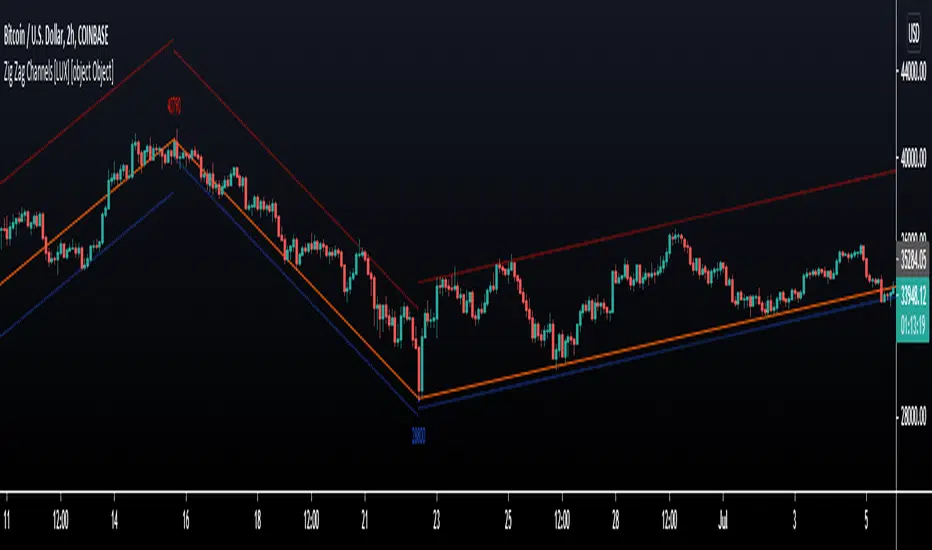
Zig Zag Channels [LuxAlgo]The Zig Zag indicator is a useful indicator when it comes to visualizing past underlying trends in the price and can make the process of using drawing tools easier. The indicator consists of a series of lines connecting points where the price deviates more than a specific percentage from a maximum/minimum point ultimately connecting local peaks and troughs.
This indicator by its very nature backpaints by default, meaning that the displayed components are offset in the past.
🔶 USAGE
The Zig Zag indicator is commonly used to returns points of references for the usage of specific drawing tools, such as Fibonacci retracements, fans, squares...etc.
The proposed indicator estimates peaks and troughs by using rolling maximums/minimums with a window size determining their significance. This window size approach allows us to have an indicator that works with a certain regularity no matter the scale of the price, something the percentage-based approach struggles with. Additionally, one upper and lower extremity are displayed, highlighting the price point that deviates the most from the Zig Zag lines.
A common usage also includes the easy determination of Elliot wave patterns in the price.
The Zig Zag indicator above highlights a downtrending motive wave.
🔹 Extremities
The novel approach taken by this Zig Zag indicator is the addition of two extremities derived from the distance between the price and the Zig Zag line, thus returning channels. It is uncommon seeing extremities in Zig Zag indicators since the line connecting peaks and troughs has rarely any other utility than seeing trend variations with more clarity and is not meant to provide an accurate estimate of underlying local trends in the price.
This channel can be useful to study the potential relationship between underlying trends and the Zig Zag line. A low width between the Zig Zag and the upper extremity indicates price variations mostly located below the Zig Zag while equal width indicates more linear trends.
When the indicator is extended to the last line, the extremities provide potential support and resistances, thus making this indicator able to forecast price variations.
🔶 SETTINGS
Length: Determines the significance of the detected peaks and troughs.
Extend To Last Bar: Extend the most recent line to the most recent closing price value.
Show Extremities: Displays the extremities.
Show Labels: Display labels highlighting the high/low prices located at peaks and troughs.
🔹 Style
Upper Extremity Color: Color of the upper extremity displayed by the indicator.
Zig Zag Color: Color of the ZigZag lines.
Lower Extremity Color: Color of the lower extremity displayed by the indicator.
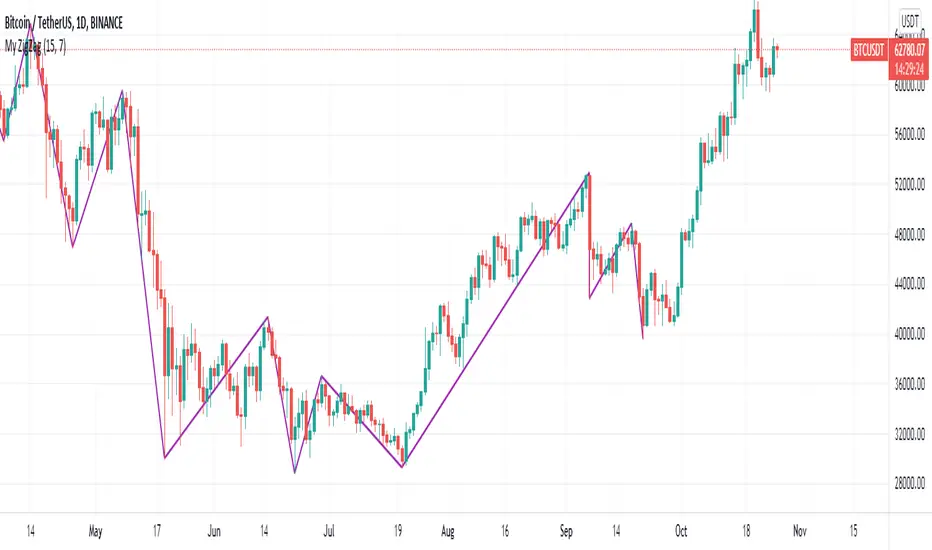
ZigZag (Using Line Array)This is standard zigzag indicator. I just coded them using lines array feature of pine - so that it can be done in least number of lines of code.
Few possible improvements:
Use label array to mark HH, HL, LH and LL
Add standard deviation check

Detrended Rhythm Oscillator (DRO)How to detect the current "market beat" or market cycle?
A common way to capture the current dominant cycle length is to detrend the price and look for common rhythms in the detrended series. A common approach is to use a Detrended Price Oscillator (DPO). This is done in order to identify and isolate short-term cycles.
A basic DPO description can be found here:
www.tradingview.com
Improvements to the standard DPO
The main purpose of the standard DPO is to analyze historical data in order to observe cycle's in a market's movement. DPO can give the technical analyst a better sense of a cycle's typical high/low range as well as its duration. However, you need to manually try to "see" tops and bottoms on the detrended price and measure manually the distance from low-low or high-high in order to derive a possible cycle length.
Therefore, I added the following improvements:
1) Using a DPO to detrend the price
2) Indicate the turns of the detrended price with a ZigZag lines to better see the tops/bottoms
3) Detrend the ZigZag to remove price amplitude between turns to even better see the cyclic turns ("rhythm")
4) Measure the distance from last detrended zigzag pivot (high-high / low-low) and plot the distance in bars above/below the turn
Now, you can clearly see the rhythm of the dataset indicated by the Detrended Rhythm Oscillator including the exact length between the turns. This makes the procedure to "spot" turns and "measure" distance more simple for the trader.
How to use this information
The purpose is to check if there is a common rhythm or beat in the underlying dataset. To check that, look for recurring pattern in the numbers. E.g. if you often see the same measured distance, you can conclude that there is a major dominant cycle in this market. Also watch for harmonic relations between the numbers. So in the example above you see the highlighted cluster of detected length of around 40,80 and 120. There three numbers all have a harmonic relation to 40.
Once you have this cyclic information, you can use this number to optimize or tune technical indicators based on the current dominant cycle length. E.g. set the length parameter of a technical indicator to the detected harmonic length with the DRO indicator.
Example Use-Case
You can use this information to set the input for the following free public open-source script:
Disclaimer
This is not meant to be a technical indicator on its own and the derived cyclic length should not be used to forecast the next turn per se. The indicator should give you an indication of the current market beat or dominant beats which can be use to further optimize other oscillator or trading related settings.
Options & settings
The indicator allows to plot different versions. It allows to plot the original DPO, the DRO with ZigZag lines, the DRO with detrended ZigZag lines and length labels on/off. You can turn on or off these version in the indicator settings. So you can tweak it visually to your own needs.

Zig Lines with Percent & ValueOverview, Features, and Usage:
The Zig Lines with Percent & Value is an indicator that highlights the highest and lowest points of the market from pivot points and zigzag lines based on the ZigZag Period setting. By a default value of 13 for the ZigZag Period this works well on Bitcoin or other alt coins on the 1 hour or higher timeframe charts.
What makes this indicator unique is that it draws a green line to signify an uptrend or a red line to signify a down trend. It will also show the percent difference between the previous point/line, for example: If you see a -negative percentage point with a red line drawn to it, then you are looking at a low pivot point and then as the green line is drawn to a +positive percentage value the percentage you see is the difference between the two points. This is great to see a trend reversal as you can look at previous pivot points and notice about how far the price moves before it changes direction (trend reversal).
There is an invisible EMA line that is used to assist with coloring the negative vs positive values. The value above or below the percentage is the lowest or highest price at that pivot point . The display of the price at the pivot point depends on your ZigZag Period setting and the timeframe of your chart.
Added Bollinger Bands as it fits perfectly with the visuals of the Zig Lines & Pivots.
Usage of Bollinger Bands:
~As the price or candle gets close to the top or bottom of the Bollinger band it can give you a better confirmation that the pivot location is at it's final place, and the trend is more likely to switch directions.
It’s important to know this indicator should not be used for alerts of any type it does repaint as the green or red line is drawing based on live chart data and it can change depending on the direction of the market. This is a great visual tool for trend analysis or to be used with other indicators as a confirmation for a possible good entry or exit position.
Credits ( and consent to use ):
Credits go to user LonesomeTheBlue for creation of this 'Double Zig Zag with HHLL' script.
The addition of the Value above/below the Percentages is from user Noldo and that script is found here:
The Bollinger Bands setup was suggested by user countseven12 and his script that uses the same BB setup is found here:
References:
1. Chen, James. (2021 March 15). Zig Zag Indicator . Received from http: www.investopedia.com
2. Mitchell, Cory. (2021 April 30). Pivot Points . Received from http: www.investopedia.com

Pivot Detective Indicator v1.0Overview of Features
The Pivot Detective is an indicator that simply highlights the waves of the market by identifying the pivot highs and pivot lows by using shapes and zigzag lines.
What makes this indicator unique is that you do not have to specify the number of bars to the left or right side of the pivots (aka pivot strength), nor do you need to specify percent deviation for filtering the zigzag (1)lines. Thus, the indicator will monitor price action and keep track of pivot high and low prices and implements a common trend analysis algorithm to determine when the trend has reversed to confirm the pivot price and begin tracking the next pivot price. The tolerance of the trend reversal can be configured to be strict or loose depending on your preference.
Be aware that this indicator does not determine key levels of price like support (S1, S2, etc.) and resistance (R1, R2, etc.) levels that are found in the traditional Pivot Points indicators (2).
Usage Information
The indicator can be applied to any chart at any time frame. It is very customizable where you can add or change various chart elements to help you enhance your interpretation of the price action trend reversals at the pivots. You can specify the pivot shapes, colors, and visibility as well as zigzag line thickness, color, and visibility. You can adorn the pivot shapes with any combination of price, rate of change percentage, and pivot trend using HH/LH/LL/HL text as well as control the coloring schemes for the in-progress pivot. The size of the text can also be customized.
Be aware that this indicator makes use of lines and labels which are limited to 500 lines and 500 labels, so if traverse far into the history, they will not appear because they have reached these limits and were removed by the chart's rendering engine.
Lastly, you can define "any alert() function call" messages on the "New Pivot High Point" and "New Point Low Point" events. These alerts provide custom placeholders that can be used in the messages, which are: {{exchange}}, {{ticker}}, {{currency}}, {{new_pivot_point_price}}, and {{new_pivot_point_roc}}
References
1. Chen, James. (2021 March 15). Zig Zag Indicator. Received from http: www.investopedia.com
2. Mitchell, Cory. (2021 April 30). Pivot Points. Received from http: www.investopedia.com

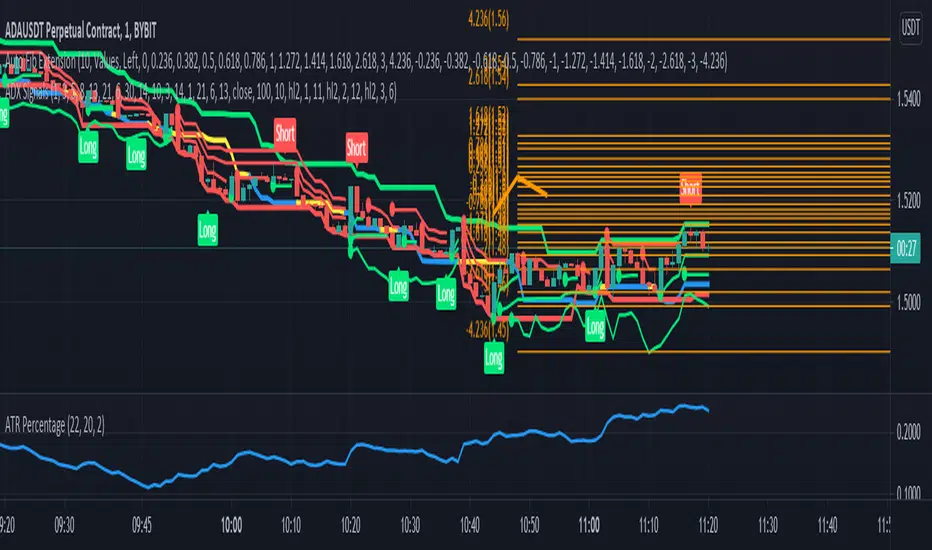
ADX SignalsThis script uses the Average Direction Index, On Balance Volume, and Exponential Moving Average, Moving Average Cross, MACD, Donchian Channels and two Parabolic SARs for stop loss, a normal one and a line one.
I tried to make the script as straightforward as possible, Buy when there is a buy signal and sell when there is a sell signal. I like using it on the smaller time-frames because I'm a scalper and I like going in and out quickly, but this indicator can be used on any timeframe and works on any instrument. The buy signal is triggered when the DI+ goes above the 30 level, the ADX is not increasing, on balance volume is at it's lowest, the price is above the lower Donchian Channel and last MACD hist bar is lower than the previous one. The sell signal is triggered when the DI- goes above the 30 level, the ADX is not increasing, on balance volume is at it's highest, the price is below the upper Donchian Channel and last MACD hist bar is upper than the previous one.
If you have any suggestions feel free to leave them in the comments below or Message me directly.