gZScoreMETA currently has a strong bullish trend and is the distance from its yearly average too.
But, how much META is distant from the mean?
With this indicator, you can see an absolute value useful to determine support and resistance when the price is so far.
In this example, applied to the daily chart, currently, META is distant 3 standard deviations that could be seen as interesting resistance looking the past
This indicator could be applied as a filter for all your mean reversion strategies.
Zscore

VolatilityIndicatorsLibrary "VolatilityIndicators"
This is a library of Volatility Indicators .
It aims to facilitate the grouping of this category of indicators, and also offer the customized supply of
the parameters and sources, not being restricted to just the closing price.
@Thanks and credits:
1. Dynamic Zones: Leo Zamansky, Ph.D., and David Stendahl
2. Deviation: Karl Pearson (code by TradingView)
3. Variance: Ronald Fisher (code by TradingView)
4. Z-score: Veronique Valcu (code by HPotter)
5. Standard deviation: Ronald Fisher (code by TradingView)
6. ATR (Average True Range): J. Welles Wilder (code by TradingView)
7. ATRP (Average True Range Percent): millerrh
8. Historical Volatility: HPotter
9. Min-Max Scale Normalization: gorx1
10. Mean Normalization: gorx1
11. Standardization: gorx1
12. Scaling to unit length: gorx1
13. LS Volatility Index: Alexandre Wolwacz (Stormer), Fabrício Lorenz, Fábio Figueiredo (Vlad) (code by me)
14. Bollinger Bands: John Bollinger (code by TradingView)
15. Bollinger Bands %: John Bollinger (code by TradingView)
16. Bollinger Bands Width: John Bollinger (code by TradingView)
dev(source, length, anotherSource)
Deviation. Measure the difference between a source in relation to another source
Parameters:
source (float)
length (simple int) : (int) Sequential period to calculate the deviation
anotherSource (float) : (float) Source to compare
Returns: (float) Bollinger Bands Width
variance(src, mean, length, biased, degreesOfFreedom)
Variance. A statistical measurement of the spread between numbers in a data set. More specifically,
variance measures how far each number in the set is from the mean (average), and thus from every other number in the set.
Variance is often depicted by this symbol: σ2. It is used by both analysts and traders to determine volatility and market security.
Parameters:
src (float) : (float) Source to calculate variance
mean (float) : (float) Mean (Moving average)
length (simple int) : (int) The sequential period to calcule the variance (number of values in data set)
biased (simple bool) : (bool) Defines the type of standard deviation. If true, uses biased sample variance (n),
degreesOfFreedom (simple int) : (int) Degrees of freedom. The number of values in the final calculation of a statistic that are free to vary.
Default value is n-1, where n here is length. Only applies when biased parameter is defined as true.
Returns: (float) Standard deviation
stDev(src, length, mean, biased, degreesOfFreedom)
Measure the Standard deviation from a source in relation to it's moving average.
In this implementation, you pass the average as a parameter, allowing a more personalized calculation.
Parameters:
src (float) : (float) Source to calculate standard deviation
length (simple int) : (int) The sequential period to calcule the standard deviation
mean (float) : (float) Moving average.
biased (simple bool) : (bool) Defines the type of standard deviation. If true, uses biased sample variance (n),
else uses unbiased sample variance (n-1 or another value, as long as it is in the range between 1 and n-1), where n=length.
degreesOfFreedom (simple int) : (int) Degrees of freedom. The number of values in the final calculation of a statistic that are free to vary.
Default value is n-1, where n here is length.
Returns: (float) Standard deviation
zscore(src, mean, length, biased, degreesOfFreedom)
Z-Score. A z-score is a statistical measurement that indicates how many standard deviations a data point is from
the mean of a data set. It is also known as a standard score. The formula for calculating a z-score is (x - μ) / σ,
where x is the individual data point, μ is the mean of the data set, and σ is the standard deviation of the data set.
Z-scores are useful in identifying outliers or extreme values in a data set. A positive z-score indicates that the
data point is above the mean, while a negative z-score indicates that the data point is below the mean. A z-score of
0 indicates that the data point is equal to the mean.
Z-scores are often used in hypothesis testing and determining confidence intervals. They can also be used to compare
data sets with different units or scales, as the z-score standardizes the data. Overall, z-scores provide a way to
measure the relative position of a data point in a data
Parameters:
src (float) : (float) Source to calculate z-score
mean (float) : (float) Moving average.
length (simple int) : (int) The sequential period to calcule the standard deviation
biased (simple bool) : (bool) Defines the type of standard deviation. If true, uses biased sample variance (n),
else uses unbiased sample variance (n-1 or another value, as long as it is in the range between 1 and n-1), where n=length.
degreesOfFreedom (simple int) : (int) Degrees of freedom. The number of values in the final calculation of a statistic that are free to vary.
Default value is n-1, where n here is length.
Returns: (float) Z-score
atr(source, length)
ATR: Average True Range. Customized version with source parameter.
Parameters:
source (float) : (float) Source
length (simple int) : (int) Length (number of bars back)
Returns: (float) ATR
atrp(length, sourceP)
ATRP (Average True Range Percent)
Parameters:
length (simple int) : (int) Length (number of bars back) for ATR
sourceP (float) : (float) Source for calculating percentage relativity
Returns: (float) ATRP
atrp(source, length, sourceP)
ATRP (Average True Range Percent). Customized version with source parameter.
Parameters:
source (float) : (float) Source for ATR
length (simple int) : (int) Length (number of bars back) for ATR
sourceP (float) : (float) Source for calculating percentage relativity
Returns: (float) ATRP
historicalVolatility(lengthATR, lengthHist)
Historical Volatility
Parameters:
lengthATR (simple int) : (int) Length (number of bars back) for ATR
lengthHist (simple int) : (int) Length (number of bars back) for Historical Volatility
Returns: (float) Historical Volatility
historicalVolatility(source, lengthATR, lengthHist)
Historical Volatility
Parameters:
source (float) : (float) Source for ATR
lengthATR (simple int) : (int) Length (number of bars back) for ATR
lengthHist (simple int) : (int) Length (number of bars back) for Historical Volatility
Returns: (float) Historical Volatility
minMaxNormalization(src, numbars)
Min-Max Scale Normalization. Maximum and minimum values are taken from the sequential range of
numbars bars back, where numbars is a number defined by the user.
Parameters:
src (float) : (float) Source to normalize
numbars (simple int) : (int) Numbers of sequential bars back to seek for lowest and hightest values.
Returns: (float) Normalized value
minMaxNormalization(src, numbars, minimumLimit, maximumLimit)
Min-Max Scale Normalization. Maximum and minimum values are taken from the sequential range of
numbars bars back, where numbars is a number defined by the user.
In this implementation, the user explicitly provides the desired minimum (min) and maximum (max) values for the scale,
rather than using the minimum and maximum values from the data.
Parameters:
src (float) : (float) Source to normalize
numbars (simple int) : (int) Numbers of sequential bars back to seek for lowest and hightest values.
minimumLimit (simple float) : (float) Minimum value to scale
maximumLimit (simple float) : (float) Maximum value to scale
Returns: (float) Normalized value
meanNormalization(src, numbars, mean)
Mean Normalization
Parameters:
src (float) : (float) Source to normalize
numbars (simple int) : (int) Numbers of sequential bars back to seek for lowest and hightest values.
mean (float) : (float) Mean of source
Returns: (float) Normalized value
standardization(src, mean, stDev)
Standardization (Z-score Normalization). How "outside the mean" values relate to the standard deviation (ratio between first and second)
Parameters:
src (float) : (float) Source to normalize
mean (float) : (float) Mean of source
stDev (float) : (float) Standard Deviation
Returns: (float) Normalized value
scalingToUnitLength(src, numbars)
Scaling to unit length
Parameters:
src (float) : (float) Source to normalize
numbars (simple int) : (int) Numbers of sequential bars back to seek for lowest and hightest values.
Returns: (float) Normalized value
lsVolatilityIndex(movingAverage, sourceHvol, lengthATR, lengthHist, lenNormal, lowerLimit, upperLimit)
LS Volatility Index. Measures the volatility of price in relation to an average.
Parameters:
movingAverage (float) : (float) A moving average
sourceHvol (float) : (float) Source for calculating the historical volatility
lengthATR (simple int) : (float) Length for calculating the ATR (Average True Range)
lengthHist (simple int) : (float) Length for calculating the historical volatility
lenNormal (simple int) : (float) Length for normalization
lowerLimit (simple int)
upperLimit (simple int)
Returns: (float) LS Volatility Index
lsVolatilityIndex(sourcePrice, movingAverage, sourceHvol, lengthATR, lengthHist, lenNormal, lowerLimit, upperLimit)
LS Volatility Index. Measures the volatility of price in relation to an average.
Parameters:
sourcePrice (float) : (float) Source for measure the distance
movingAverage (float) : (float) A moving average
sourceHvol (float) : (float) Source for calculating the historical volatility
lengthATR (simple int) : (float) Length for calculating the ATR (Average True Range)
lengthHist (simple int) : (float) Length for calculating the historical volatility
lenNormal (simple int)
lowerLimit (simple int)
upperLimit (simple int)
Returns: (float) LS Volatility Index
bollingerBands(src, length, mult, basis)
Bollinger Bands. A Bollinger Band is a technical analysis tool defined by a set of lines plotted
two standard deviations (positively and negatively) away from a simple moving average (SMA) of the security's price,
but can be adjusted to user preferences. In this version you can pass a customized basis (moving average), not only SMA.
Parameters:
src (float) : (float) Source to calculate standard deviation used in Bollinger Bands
length (simple int) : (int) The time period to be used in calculating the standard deviation
mult (simple float) : (float) Multiplier used in standard deviation. Basically, the upper/lower bands are standard deviation multiplied by this.
basis (float) : (float) Basis of Bollinger Bands (a moving average)
Returns: (float) A tuple of Bollinger Bands, where index 1=basis; 2=basis+dev; 3=basis-dev; and dev=multiplier*stdev
bollingerBands(src, length, aMult, basis)
Bollinger Bands. A Bollinger Band is a technical analysis tool defined by a set of lines plotted
two standard deviations (positively and negatively) away from a simple moving average (SMA) of the security's price,
but can be adjusted to user preferences. In this version you can pass a customized basis (moving average), not only SMA.
Also, various multipliers can be passed, thus getting more bands (instead of just 2).
Parameters:
src (float) : (float) Source to calculate standard deviation used in Bollinger Bands
length (simple int) : (int) The time period to be used in calculating the standard deviation
aMult (float ) : (float ) An array of multiplies used in standard deviation. Basically, the upper/lower bands are standard deviation multiplied by this.
This array of multipliers permit the use of various bands, not only 2.
basis (float) : (float) Basis of Bollinger Bands (a moving average)
Returns: (float ) An array of Bollinger Bands, where:
index 1=basis; 2=basis+dev1; 3=basis-dev1; 4=basis+dev2, 5=basis-dev2, 6=basis+dev2, 7=basis-dev2, Nup=basis+devN, Nlow=basis-devN
and dev1, dev2, devN are ```multiplier N * stdev```
bollingerBandsB(src, length, mult, basis)
Bollinger Bands %B - or Percent Bandwidth (%B).
Quantify or display where price (or another source) is in relation to the bands.
%B can be useful in identifying trends and trading signals.
Calculation:
%B = (Current Price - Lower Band) / (Upper Band - Lower Band)
Parameters:
src (float) : (float) Source to calculate standard deviation used in Bollinger Bands
length (simple int) : (int) The time period to be used in calculating the standard deviation
mult (simple float) : (float) Multiplier used in standard deviation
basis (float) : (float) Basis of Bollinger Bands (a moving average)
Returns: (float) Bollinger Bands %B
bollingerBandsB(src, length, aMult, basis)
Bollinger Bands %B - or Percent Bandwidth (%B).
Quantify or display where price (or another source) is in relation to the bands.
%B can be useful in identifying trends and trading signals.
Calculation
%B = (Current Price - Lower Band) / (Upper Band - Lower Band)
Parameters:
src (float) : (float) Source to calculate standard deviation used in Bollinger Bands
length (simple int) : (int) The time period to be used in calculating the standard deviation
aMult (float ) : (float ) Array of multiplier used in standard deviation. Basically, the upper/lower bands are standard deviation multiplied by this.
This array of multipliers permit the use of various bands, not only 2.
basis (float) : (float) Basis of Bollinger Bands (a moving average)
Returns: (float ) An array of Bollinger Bands %B. The number of results in this array is equal the numbers of multipliers passed via parameter.
bollingerBandsW(src, length, mult, basis)
Bollinger Bands Width. Serve as a way to quantitatively measure the width between the Upper and Lower Bands
Calculation:
Bollinger Bands Width = (Upper Band - Lower Band) / Middle Band
Parameters:
src (float) : (float) Source to calculate standard deviation used in Bollinger Bands
length (simple int) : (int) Sequential period to calculate the standard deviation
mult (simple float) : (float) Multiplier used in standard deviation
basis (float) : (float) Basis of Bollinger Bands (a moving average)
Returns: (float) Bollinger Bands Width
bollingerBandsW(src, length, aMult, basis)
Bollinger Bands Width. Serve as a way to quantitatively measure the width between the Upper and Lower Bands
Calculation
Bollinger Bands Width = (Upper Band - Lower Band) / Middle Band
Parameters:
src (float) : (float) Source to calculate standard deviation used in Bollinger Bands
length (simple int) : (int) Sequential period to calculate the standard deviation
aMult (float ) : (float ) Array of multiplier used in standard deviation. Basically, the upper/lower bands are standard deviation multiplied by this.
This array of multipliers permit the use of various bands, not only 2.
basis (float) : (float) Basis of Bollinger Bands (a moving average)
Returns: (float ) An array of Bollinger Bands Width. The number of results in this array is equal the numbers of multipliers passed via parameter.
dinamicZone(source, sampleLength, pcntAbove, pcntBelow)
Get Dynamic Zones
Parameters:
source (float) : (float) Source
sampleLength (simple int) : (int) Sample Length
pcntAbove (simple float) : (float) Calculates the top of the dynamic zone, considering that the maximum values are above x% of the sample
pcntBelow (simple float) : (float) Calculates the bottom of the dynamic zone, considering that the minimum values are below x% of the sample
Returns: A tuple with 3 series of values: (1) Upper Line of Dynamic Zone;
(2) Lower Line of Dynamic Zone; (3) Center of Dynamic Zone (x = 50%)
Examples:

Regularized-Moving-Average Oscillator SuiteThe Regularized-MA Oscillator Suite is a versatile indicator that transforms any moving average into an oscillator. It comprises up to 13 different moving average types, including KAMA, T3, and ALMA. This indicator serves as a valuable tool for both trend following and mean reversion strategies, providing traders and investors with enhanced insights into market dynamics.
Methodology:
The Regularized MA Oscillator Suite calculates the moving average (MA) based on user-defined parameters such as length, moving average type, and custom smoothing factors. It then derives the mean and standard deviation of the MA using a normalized period. Finally, it computes the Z-Score by subtracting the mean from the MA and dividing it by the standard deviation.
KAMA (Kaufman's Adaptive Moving Average):
KAMA is a unique moving average type that dynamically adjusts its smoothing period based on market volatility. It adapts to changing market conditions, providing a smoother response during periods of low volatility and a quicker response during periods of high volatility. This allows traders to capture trends effectively while reducing noise.
T3 (Tillson's Exponential Moving Average):
T3 is an exponential moving average that incorporates additional smoothing techniques to reduce lag and provide a more responsive indicator. It aims to maintain a balance between responsiveness and smoothness, allowing traders to identify trend reversals with greater accuracy.
ALMA (Arnaud Legoux Moving Average):
ALMA is a moving average type that utilizes a combination of linear regression and exponential moving average techniques. It offers a unique way of calculating the moving average by providing a smoother and more accurate representation of price trends. ALMA reduces lag and noise, enabling traders to identify trend changes and potential entry or exit points more effectively.
Z-Score:
The Z-Score calculation in the Regularized-MA Oscillator Suite standardizes the values of the moving average. It measures the deviation of each data point from the mean in terms of standard deviations. By normalizing the moving average through the Z-Score, the indicator enables traders to assess the relative position of price in relation to its mean and volatility. This information can be valuable for identifying overbought and oversold conditions, as well as potential trend reversals.
Utility:
The Regularized-MA Oscillator Suite with its unique moving average types and Z-Score calculation offers traders and investors powerful analytical tools. It can be used for trend following strategies by analyzing the oscillator's position relative to the midline. Traders can also employ it as a mean reversion tool by identifying peak values above user-defined deviations. These features assist in identifying potential entry and exit points, enhancing trading decisions and market analysis.
Key Features:
Variety of 13 MA types.
Potential reversal point bubbles.
Bar coloring methods - Trend (Midline cross), Extremities, Reversions, Slope
Example Charts:

Z-Score(Slope(OBV(LBC)))Summary : Market price is simply a dance of liquidity to the specific market.
tl;dr: "Cash come-in, market moon; Cash go-out, market doom"
In Simple Language : Large changes in the money flow to an asset often mark local price extremia.
Academic paper:
Title: Z-Score(Slope(OBV)): An Efficient Indicator for Identifying Local Extremes in Asset Prices
Abstract: This paper presents a novel trading indicator, Z-Score(Slope(OBV)), that aims to predict local extremes in asset prices by analyzing the patterns of money flow. The indicator is constructed using the Z-score of the slope of the On Balance Volume (OBV).
Hypothesis: The price levels at which the money flows into and out of an asset often mark local extremes. This notion underpins our exploration of the Z-Score(Slope(OBV)) indicator's potential in identifying these critical points.
1. On Balance Volume (OBV): The OBV is a momentum indicator that leverages the volume flow to forecast potential changes in asset prices. It operates on the premise that changes in volume often presage shifts in price. The OBV algorithm adds a period's volume to the cumulative total when the closing price is up and subtracts it when the closing price is down. Therefore, an ascending OBV suggests positive volume pressure, potentially heralding higher prices, while a declining OBV signifies negative volume pressure, possibly indicating lower prices.
2. Slope: In this context, the slope represents the rate of change of the OBV. It is a measure of the rise-over-run for a linear regression line through the OBV data points. By evaluating the slope of the OBV, we can extract valuable insights into the momentum of the volume. A positive slope indicates increasing volume momentum, suggesting growing interest in the asset, while a negative slope implies declining volume momentum, potentially reflecting dwindling interest.
3. Z-Score: The Z-score is a statistical measure that delineates a data point's relationship to the mean of a group of values, expressed in terms of standard deviations from the mean. For instance, a Z-score of 0 reveals that the data point's score aligns with the mean score. Positive Z-scores indicate values higher than the mean, and negative Z-scores represent values lower than the mean. Applying the Z-score to the slope of the OBV allows us to comprehend the degree of deviation of the current OBV slope from its historical mean.
A Z-score of 1 suggests that the OBV's slope is one standard deviation from the mean, which implies that the slope is within the range of values where approximately 68% (not 67%) of all values lie.
A Z-score of 2 implies that the slope is two standard deviations from the mean, thus within the range where roughly 95% of all values lie.
A Z-score of 3 indicates that the slope is three standard deviations from the mean, putting it within the range where about 99.7% of all values lie.
Z-scores of 4 and 5 and beyond are increasingly rare and represent extreme values.
4. The Z-Score(Slope(OBV)) Indicator and Line Break Chart Synergy: The Z-Score(Slope(OBV)) indicator's efficiency is further amplified when visualized using a Line Break chart. This chart type disregards time, concentrating solely on price changes, thus providing a clear visualization of market trends. When combined with the Line Break chart, the Z-Score(Slope(OBV(LBC))) indicator can help traders identify trend shifts more accurately and promptly, reinforcing the hypothesis that price levels where money flows into and out of an asset often mark local extremes.
In summary, the Z-Score(Slope(OBV)) indicator, combining volume, momentum, and statistical analysis, provides a robust tool for traders to predict local extremes in asset prices.
Regarding Implementation:
- This is implemented using Pinescript V5
- Uses inbuilt ta module
- Very effective and simple and efficient computation in 30 lines of code

MVRV Z Score and MVRV Free Float Z-ScoreIMPORTANT: This script needs as much historic data as possible. Please run it on INDEX:BTCUSD , BNC:BLX or another chart of sufficient length.
MVRV
The MVRV (Market Value to Realised Value Ratio) simply divides bitcoins market cap by bitcoins realized market cap. This was previously impossible on Tradingview but has now been made possible thanks to Coinmetrics providing us with the realized market cap data.
In the free float version, the free float market cap is used instead of the regular market cap.
Z-Score
The MVRV Z-score divides the difference between Market cap and realized market cap by the historic standard deviation of the market cap.
Historically, this has been insanely accurate at detecting bitcoin tops and bottoms:
A Z-Score above 7 means bitcoin is vastly overpriced and at a local top.
A Z-Score below 0.1 means bitcoin is underpriced and at a local bottom.
In the free float version, the free float market cap is used instead of the regular market cap.
The Z-Score, also known as the standard score is hugely popular in a wide range of mathematical and statistical fields and is usually used to measure the number of standard deviations by which the value of a raw score is above or below the mean value of what is being observed or measured.
Credits
MVRV Z Score initially created by aweandwonder
MVRV initially created by Murad Mahmudov and David Puell

Z Score BandThis is a band based on Z Score. What is Z Score? In layman's terms it's a method of finding outliers within a sequence of numbers. It's highly effective to quantify pump and dumps in the crypto market.
The middle line is a simple Exponential Moving Average, you can configure this with whatever period you prefer. It comes default with a period of 247 to which I find suitable for my style of trading. The upper and lower bound are determined by the standard deviation you choose in the settings, it comes with a default of 1.69 although I've heard people saying 2.5 is a better number to really pinpoint outliers.
Trading with this indicator is like trading with any band based indicator. The main difference is that this indicator's sole purpose when I wrote it is to help me find shorting positions in the futures market. On the contrary though, longs are also achievable although I rarely long the futures market.
If prices hit the upper bound and get rejected, it's probably because the move was an outlier, it doesn't happen often and when it does usually it reveals crypto's nature of buying spot and hedging short in the futures market. When prices stay above the upper bound, switch to a higher timeframe until we can see that it's still have some ways upwards.
What's true about using this as a shorting tool is also true with longs. However, it might not be as effective, I'd like to be proven wrong.

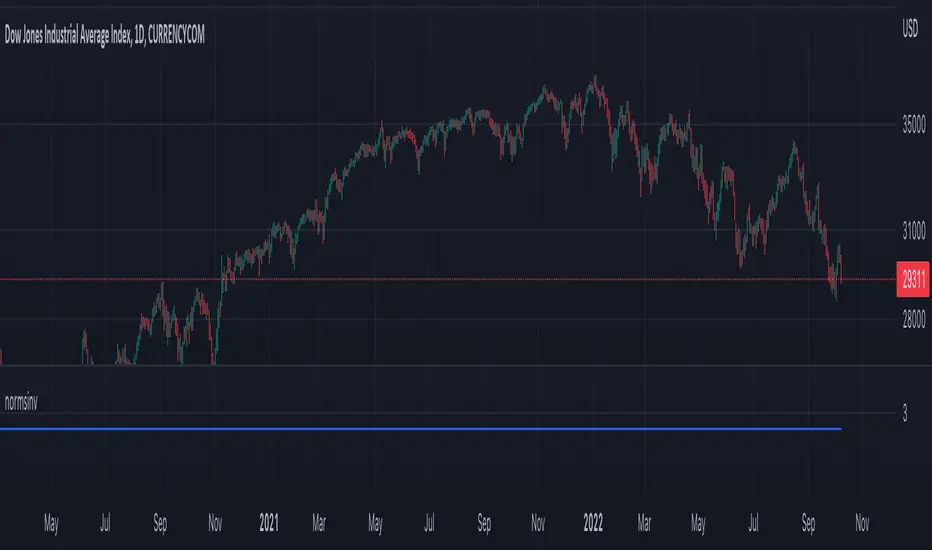
normsinvLibrary "normsinv"
Description:
Returns the inverse of the standard normal cumulative distribution.
The distribution has a mean of zero and a standard deviation of one; i.e.,
normsinv seeks that value z such that a normal distribtuion of mean of zero
and standard deviation one is equal to the input probability.
Reference:
github.com
normsinv(y0)
Returns the inverse of the standard normal cumulative distribution. The distribution has a mean of zero and a standard deviation of one.
Parameters:
y0 : float, probability corresponding to the normal distribution.
Returns: float, z-score
two_leg_spread_returns_zscoreThis script helps assess the relative returns of each leg in a two-legged spread. It shows the z-score of each period's returns, along with a moving average of the difference between the two returns. A negative moving average implies that the second leg is strengthening, on a relative return basis, against the first leg, and vice versa. The inputs are:
- timeframe: the timeframe for the calculations. the default is five minutes.
- leg1_sym: the symbol for the first leg
- leg2_sym: the symbol for the second leg
- ma_length: the length of the moving average. by default it is 48, or the previous four hours, given the default timeframe.
The default symbols are RB and HO, simply as an example of an intercommodity spread.

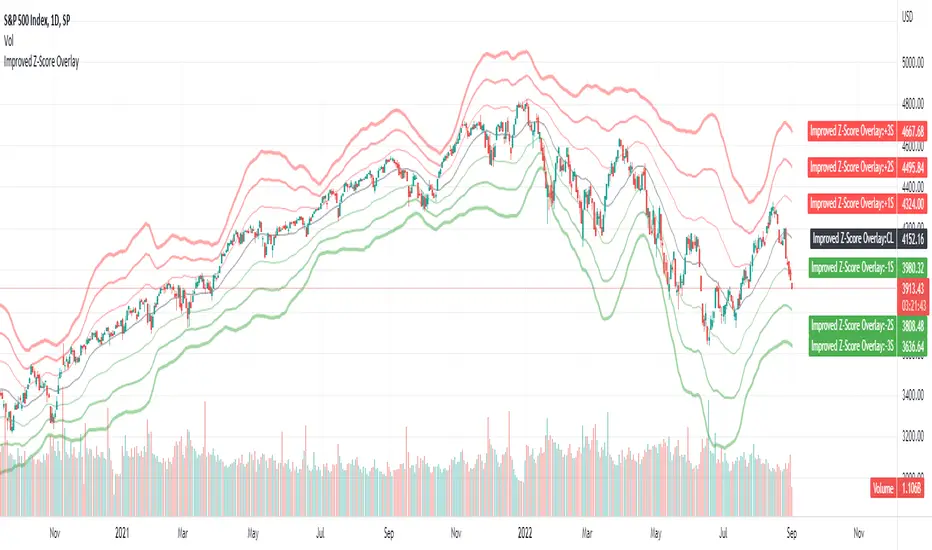
Improved Z-Score OverlayLast month I published an improved z-score script that goes underneath your chart, which helps to highlight overbought or oversold regimes. It is customizable, and allows changing the periods, whether smoothing capability is desired, whether to use simple or exponential moving averages, and which data source to use (open, high, low, close, ohlc4).
Some individuals may find that it is most useful not only to have the z-score visible underneath their price chart, but have the sigma values clearly visible on the chart itself to determine overbought or oversold levels.
Therefore, this improved z-score overlay script will place the centerline of price on the chart, and +3/+2/+1/0/-1/-2/-3 sigma.
These can be disabled if some values do not want to be shown, and the colors / opacity can be changed.
Additionally, you could also put this into a new pane below your chart and disable all of the +3 to -3 sigma values, and enable the "Z-Score" button. This will allow you to replicate the original Improved Z-Score Script.
If anyone has questions or would like to have any improvements made, let me know :)
- Jim Bosse
[Sidders]Std. Deviation from Mean/MA (Z-score)This indicator visualizes in a straight forward way the distance price is away from the mean in absolute standard deviations (Z-score) over a certain lookback period (can be configured). Additionally I've included a moving average of the distance, the MA type can be configured in the settings.
Personally using this indicator for some of my algo mean reversion strategies. Price reaching the extreme treshold (can be configured in settings, standard is 3) could be seen as a point where price will revert to the mean.
I've included alerts for when price crosses into extreme areas, as well as alerts for when crosses back into 'normal' territory again. Both are also plotted on the indicator through background coloring/shapes.
Since I've learned so much from other developers I've decided to open source the code. Let me know if you have any ideas on how to improve, I'll see if I can implement them.
Enjoy!

Candle Colored by Volume Z-score [Morty]This indicator colors the candles according to the z-score of the trading volume. You can easily see the imbalance on the chart. You can use it at any timeframe.
In statistics, the standard score (Z-score) is the number of standard deviations by which the value of a raw score (i.e., an observed value or data point) is above or below the mean value of what is being observed or measured. Raw scores above the mean have positive standard scores, while those below the mean have negative standard scores.
This script uses trading volume as source of z-score by default.
Due to the lack of volume data for some index tickers, you can also choose candle body size as source of z-score.
features:
- custom source of z-score
- volume
- candle body size
- any of above two
- all of above two
- custom threshold of z-score
- custom color chemes
- custom chart type
- alerts
default color schemes:
- green -> excheme bullish imbalance
- blue -> large bullish imbalance
- red -> excheme bearish imbalance
- purple -> large bearish imbalance
- yellow -> low volume bars, indicates "balance", after which volatility usually increases and tends to continue the previous trend
Examples:
* Personally, I use dark theme and changed the candle colors to black/white for down/up.
Volume as Z-score source
Any as Z-score source, more imbalances are showed

Z Score (Close + High and Low bands)Basic z score with High and Low bands.
If z is positive = uptrend.
If z is negative = downtrend.
If z > +3 or z < -3 = reverse is possible.
H lines can act as a support/resistance.
Disclaimer:
Trading success is all about following your trading strategy and the indicators should fit within your trading strategy, and not to be traded upon solely
The script is for informational and educational purposes only. Use of the script does not constitute professional and/or financial advice. You alone have the sole responsibility of evaluating the script output and risks associated with the use of the script. In exchange for using the script, you agree not to hold dgtrd TradingView user liable for any possible claim for damages arising from any decision you make based on use of the script

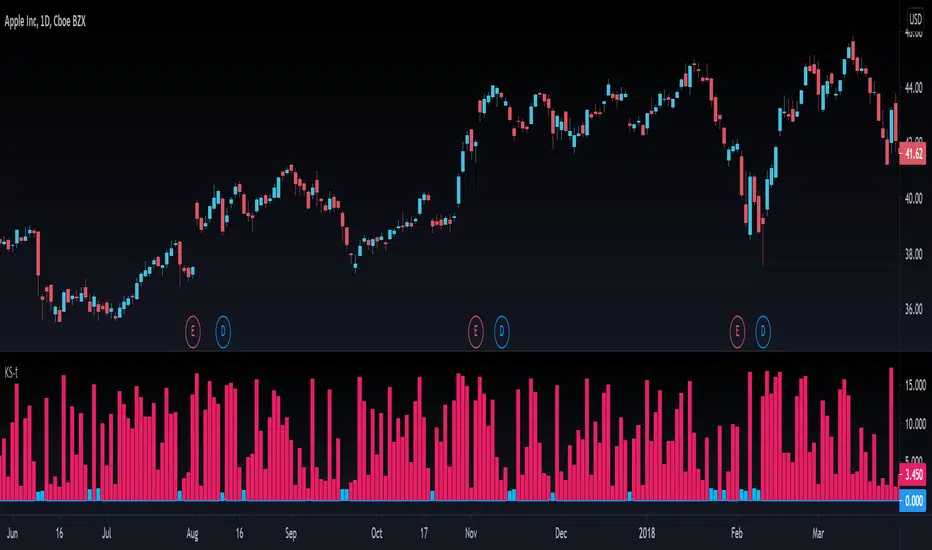
Kolmogorov-Smirnov TestThe Kolmogorov–Smirnov test aims to tell you if the distribution of prices (or log returns) tends to follow a normal distribution or not. You can read about this test on Wikipedia . It seems to be a basic but trusted measure in the quantitative trading world.
When KS-t columns are blue, then it's safe to assume normal distribution. When they are red, the normal distribution assumption is proven wrong by the magnitude of the KS-t value.
In the plotting tab of the script, you can activate another option that displays the probability of the distribution being actually normal. It's values are bounded between 0 and 1, like all probabilities.
This test can be useful when using statistical concepts for trading markets, like standard deviations, z-scores, etc because they all depend on the assumption of prices (or log returns) being normaly distributed.
If you see something wrong, don't hesitate to message me.
Happy trading to all.
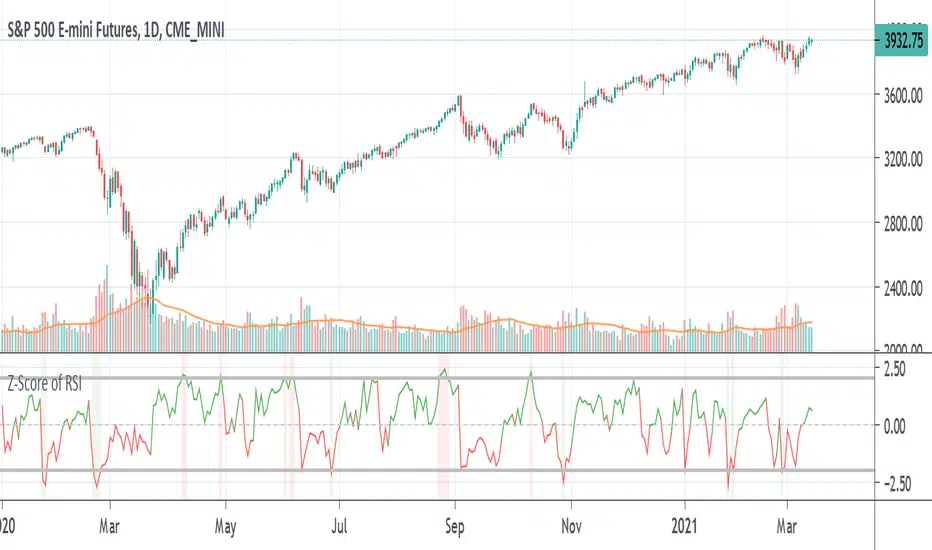
Z-Score of RSIA way to see whether RSI is overbought or oversold inside its Bollinger Bands in the form of an oscillator. Z-score tells you how far the data is from the mean in terms of standard deviations. The numbers shown in the indicator are the number of standard deviations away from the average or mean. Like Bollinger Bands, if it is above the standard deviation border lines then it is considered to be outside the distribution or Bollinger Band. If it is above the upper border line then is it is overbought, if it is below the lower border line then is is oversold.
Example of how standard deviation works: 1 standard deviation contains 68% of the data, 2 SD (the default for BB) contains 95% of data, 3 SD for 99%, etc. If the data goes past that, it is considered to be outside the distribution. In statistics, data that is within the distribution is considered to be "significant".
The z-score line is colored green if it is above zero and red if it is below zero. Above zero means that the RSI is above the average line or the middle line of the Bollinger Bands, and vice-versa if it is below. A red vertical bar is shown when the the z-score is above the upper border line to show that it is overbought and a green vertical bar is shown when the z-score is below the lower border line to show that it is oversold. This is the equivalent of when the RSI is above and below its Bollinger Bands.
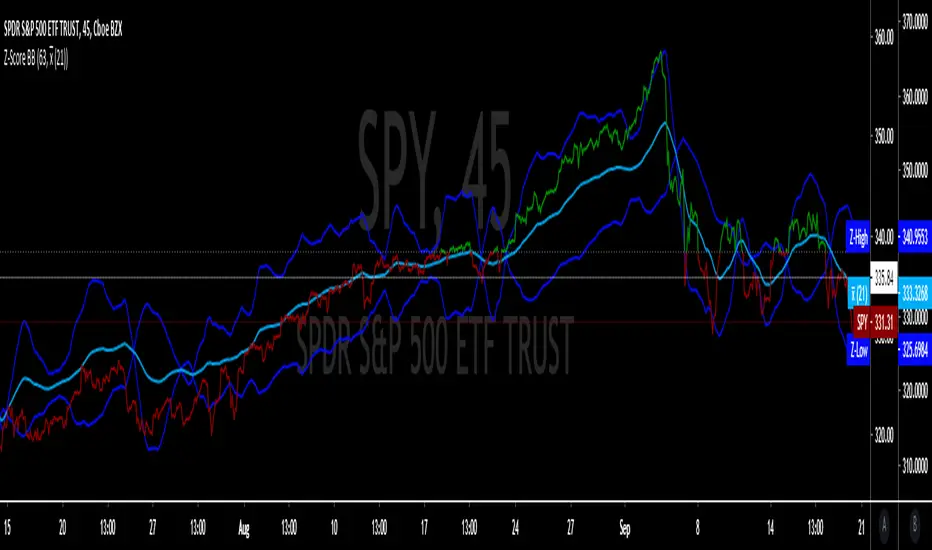
Z-Score 'Bollinger Bands'The following script is an application of the Z-Score (previous script).
Z-Scores can be used in place of standard deviation (sigma) in 'Bollinger Bands'.
The average of the sample (x-bar) over 21 days (N)
21 average trading days per month, fixed value
The average of the population (mu) over 63 days (n)
63 days per quarter, default is set to 63
Z-Score is calculated by formula in previous script, and the absolute value is taken of "Z".
Z-High = absolute value of Z + (x-bar).
Z-Low = absolute value of Z - (x-bar).
Will update with Z from mu and Z from avg (working on UX and visualization details).
Z-Score The z-score is a way of counting the number of standard deviations between a given data value and the mean of the data set.
Z-score = (x̄ - μ) / (σ / √ n)
x̄ = sample mean (using the array.avg function = array(a,close ), where i = 1 to 21)
μ = population mean ( = avg(close, n))
σ = standard deviation of the population ( = stdev(close,n))
n = number of 'close' or trading day closes
n = input
... Note: The previous indicator is part of a larger series of indicators

Cumulative distribution function - Probability Cumulative distribution function (tScore and zScore)
This script provides the calculation of the cumulative distribution function (i.e., probability). The measure allows you to calculate the chances of a value of interest being above or below a hypothesized value over the measurement period—nothing fancy here, just good old statistics and mathematics. The closer you are to 0 or 1, the more significant your measurement. We’ve included a significance level highlighting feature. The ability to turn price and/or volume off.
We have included both the Z and T statistics. Where the ‘Z’ is looking at the difference of the current value, minus the mean, and divided by the standard deviation. This is usually pretty noisy on a single value, so a smoother is included. Nice shoutout to the Pinecoders Github Page with this function also. The t-statistic is measuring the difference between a short measurement, an extended measurement, and divided by the standard error (sigma/sqrt(n)). Both of these are neatly wrapped into a function, so please feel free to use them in your code. Add a bit of science to your guessing game. For the purists out there, we have chosen to use sigma in the t-statistic because we know the population's behavior (as opposed to the s-measure). We’ve also included two levels of the t-statistic cumulative distribution function if you are using a short sample period below 6.
Finally, because everyone loves choices, we’ve included the ability to measure the probability of:
the current value (Price and volume)
change
percent change
momentum (change over a period of time)
Acceleration (change of the change)
contribution (amount of the current bar over the sum)
volatility (natural log ratio of today and the previous bar)
Here is a chart example explaining some of the data for the function.
Here are the various options you have the print the different measurements
A comparison of the t-statistic and z-statistic (t-score and z-score)
And the coloring options

Statistical Histogram with configurable bins and Data WindowCreates a Histogram for Statistical Analysis of any source.
Input Parameters:
Sample Source: Select your source here, can be any numerical source.
Sample Period: Sample size for Mean and Standard Deviation Calculations.
Enable Cumulative Mode: Will attempt to calculate the bin for every sample in the entire dataset.
Window Period: Used only in Window Mode (Enable Cumulative Mode unchecked), Calculates the bin for the past Window Period sample size.
Bin Label Spacing: Adjust horizontal spacing of Bin Labels below the histogram for easier viewing.
Center Bin: Selects the center Bin, usually set to (0 - Bin Width) < Sample <= 0 standard deviations or (z_score)
Bin Width: Selects the Bin Width in standard deviations.
How you can use it:
View characteristics of dataset such as unimodal/bimodal and skewness to determine preferred statistical analysis.
Additional Reference:
en.wikipedia.org
en.wikipedia.org
Credits:
Thanks goes out to www.tradingview.com , for cleaning up some of the code and www.tradingview.com for the original idea.
Usage Tips:
When adjusting the bin parameters, center bin and bin width, verify that the total sum of the bins (Sum Frequency in the Data Window) is close to the Total Samples. If your Sum Frequency is drastically lower it means you need to adjust your center bin and/or bin width to capture more of the data available.

Z Score Enhanced Time Segmented Volume (Multi MA)**THIS VERSION HAS BEEN STANDARDIZED WITH A Z SCORE CALCULATION AND ALLOWS THE USER TO SELECT WHICH MOVING AVERAGE THEY WOULD LIKE TO UTILIZE FOR THE SIGNAL LINE**
Chart shows the Non-Standardized Enhanced Time Segmented Volume (Multi MA) with default settings on top and the Standardized version with default settings on the bottom.
Time Segmented Volume was developed by Worden Brothers, Inc to be a leading indicator by comparing various time segments of both price and volume . Essentialy it is designed to measure the amount of money flowing in and out of an instrument.
Time Segmented Volume was originally ported to TradingView by user @liw0 and later corrected by user @vitelot. I never quite understood how to read Time Segmented Volume until I ran across a version by user @storma where they indicated when price would be long or short, but that code also utilized the incorrect calculation from user @liw0.
In an effort to make Time Segmented Volume more accessible and easier to read, I have re-coded it here. The calculations are based on the code from @vitelot and I have added direction indicators below the chart.
If the histogram (TSV) is greater than zero and greater than the moving average, price should be moving long and there will be a green box below the chart.
If TSV falls below the moving average while still being greater than zero, the trend may be exhausting and has been coded to read Price Action Long - FAILURE with a black x below the chart.
If the histogram (TSV) is less than zero and less than the moving average, price should be moving short and there will be a red box below the chart.
If TSV rises above the moving average while still being less than zero, the trend may be exhausting and has been coded to read Price Action Short - FAILURE with a black x below the chart.
At times, the moving average may be above zero while TSV is below zero or vice versa. In these situations the chart will indicate long or short based on whether or not TSV is greater or less than zero. It is possible a new trend may be forming as the moving average obviously lags, but also possible price is consolidating with little volume and causing TSV to oscillate close to zero.
**Z Score // Standardized Option **
Thist Standardized code implements all of the above but also allows the user to select a threshold level that should not need to be adjusted for each instrument (since the output is standardized).
If the TSV value meets the long and short signal requirements above and TSV is greater than the threshold values a green or red box will print ABOVE the oscillator. The histogram will also change color based on which threshold TSV has met.
This calculation allows us to compare current volatility to the mean (moving average) of the population (Z-Length). The closer the TSV Z-Score is to the mean, the closer it will be to the Zero Line and therefore price is likely consolidating and choppy. The farther TSV Z-Score is from the mean, the more likely price is trending.
The MA Mode determines the Moving Average used to calculate TSV itself. The Z-Score is ALWAYS calculated with a simple moving average (as that is the standard calculation for Z-Score).
The Threshold Levels are the levels at which TSV Z-Score will change from gray to yellow, orange, green ( bullish ), or red ( bearish ).
Statistically speaking, confidence levels in relation to Z-Score are noted below. The built in Threshold Levels are the positive and negative values for 90%, 95%, and 99%. This would indicate when volatility is greater than these values they are out of the ordinary from the standard range. You may wish to adjust these levels for TSV Z-Score to be more responsive to your trading needs
80% :: 1.28
85% :: 1.44
90% :: 1.64
95% :: 1.96
99% :: 2.58
The Z Length is the period for which the Z Score is calculated
More information regarding Time Segmented Volume can be found here: www.worden.com
Original code ported by @liw0
Corrected by @vitelot
Updated/Enhancements by @eylwithsteph with inspiration from @storma
Multiple MA Options Credits to @Fractured and @lejmer
Bits and Pieces from @AlexGrover, @Montyjus, and @Jiehonglim
As always, trade at your own risk.

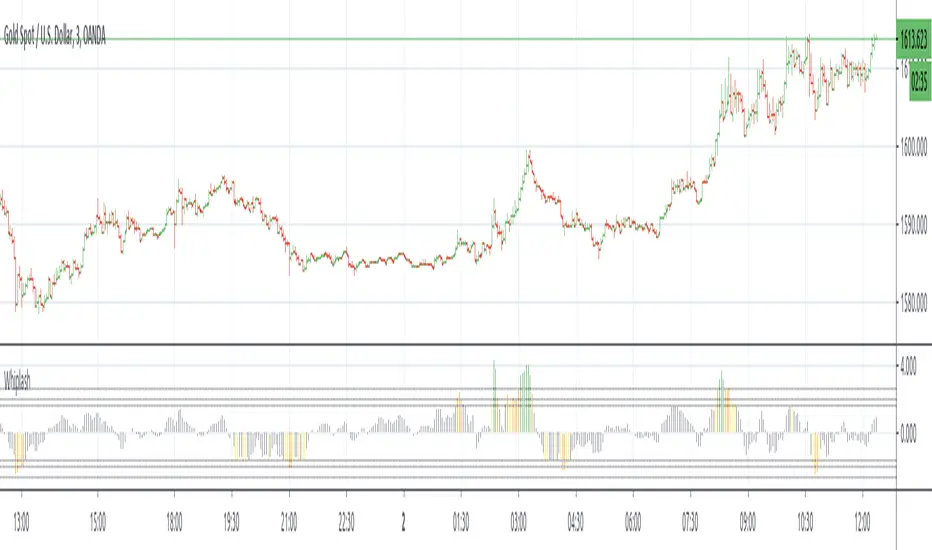
WhipLashThis is a study to determine if small candle bodies (little difference between open and close), regardless of overall candle length (high/low), can be used to filter choppy markets.
The indicator will calculate the selected average "MA Mode" of (close-open). To standardize this result and ensure any filters/thresholds do not need to be recalculated for each instrument the result will be used to calculate the Z Score.
The idea is that when candle bodies are small there is very little actual price movement, and therefore price is choppy. When considering the Z Score of that result, any outliers ie larger candle bodies, could show a potential trend forming. This indicator is similar to QStick but allows more customization by the user.
MA Mode determines which MA is used to smooth the results of (close-open)
Price Smoothing is the number of running periods the MA Mode is calculated for.
The three Thresholds are preset to the 90%, 95%, and 99% levels for Z Score. If these thresholds are altered you may wish to also alter the horizontal lines programmed for each level on the positive and negative sides.
The Z Length is the period for which the Z Score is calculated
Multiple MA Options Credits to @Fractured
Bits and Pieces from @AlexGrover, @Montyjus, and @Jiehonglim
As always, trade at your own risk.
Quantile BandsMiddle quantile/band color is set by confluence of the outer quantiles and not by it's own slope. Optional MTF.

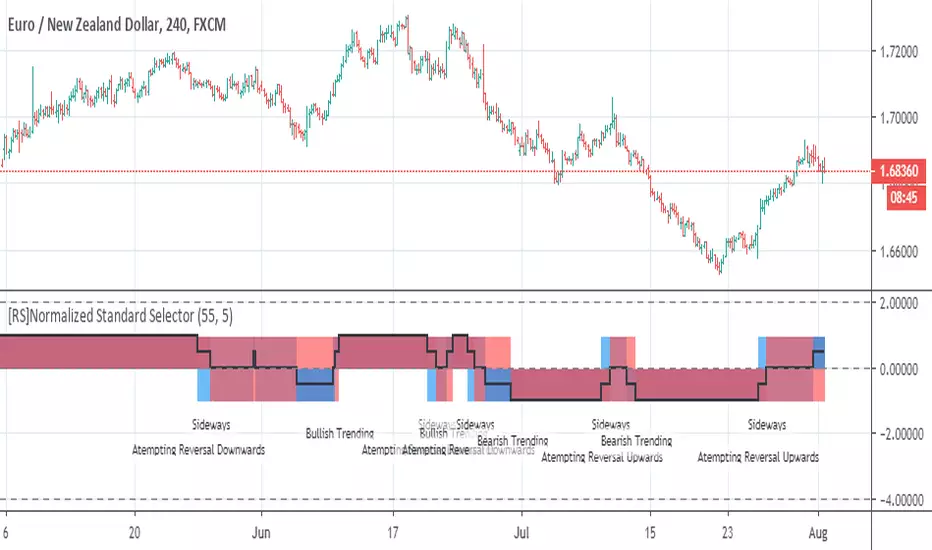
[RS]Normalized Standard SelectorEXPERIMENTAL:
market state, text says it all most of the time at least.
OBV Z-ScoresThis study calculates the On-Balance Volume (OBV) and displays it in terms of its Z-Score.
OBV is a great momentum indicator . As the name suggests, OBV predicts changes in price based on the security's volume flow.
Formula:
if (Current Price > Previous Price)
then Current OBV = Previous OBV + Current Volume
if (Current Price < Previous Price)
then Current OBV = Previous OBV - Current Volume
if (Current Price == Previous Price)
then Current OBV = Previous OBV
As the formula shows, the OBV goes a step beyond just looking at the pure volume of a security. Instead, it factors in relative price action from period to period to reflect investor sentiment. As a result, we often look to the OBV to spot bullish or bearish trends while they are in the early stages of development or simply predict impending uptrends or downtrends.
To make the OBV easier to visualize, we converted the value to a Z-Score. The Z-Score is a simple statistical measurement and represents the current OBV value's distance from the mean OBV value in terms of # of standard deviations.
Users can adjust the values for the 2 upper bounds for Z Scores and 2 lower bounds. Additionally, the n value for z score calculation can be adjusted in the input menu. A higher n value means the z score will be based on a longer lookback period. A lower value will result in more sensitive readings.
Overall, I think this is an interesting way to represent OBV values and will be a valuable leading indicator.
~Happy Trading~
