Apakah carta garis tangga
Carta garis tangga (step line chart) adalah sejenis carta garis, tetapi berlainan dengan carta garis asal, ia mempunyai bentuk seperti anak tangga. Di sini, titil data dipautkan dengan garisan mendatar dan menegak yang mencipta tangga yang mewakili harga untuk selang masa tertentu.
KANDUNGAN:
Apakah carta garis tangga
Carta garis tangga boleh menjadi pilihan yang bagus apabila anda perlu memaparkan perubahan harga mendadak, di mana, sebagai contoh, terjadi dalam harga sama selepas laporan perolehan atau perubahan polisi.
Garisan mendatar menunjukkan tempoh kestabilan dan jenis carta ini membantu untuk memudahkan mencari perubahan mendadak.

Carta garis tangga vs carta garis
Walaupun kedua-dua jenis carta ini boleh kelihatan sama semasa memaparkan data yang serupa, mereka mempunyai aplikasi dan manfaat yang unik.
Garis tangga
- Membantu mencari harga dengan lebih mudah yang mana harga mengalami perubahan ketara
- Lebih berguna untuk menentukan perubahan dilakukan oleh peristiwa (cth. pemisahan saham, laporan perolehan dll.)
- Lebih sesuai untuk memaparkan data kewangan
Garisan standard
- Tidak menunjukkan titik sebenar di mana perubahan terjadi
- Lebih mudah dibaca untuk trend biasa
- Lebih sesuai untuk pengecaman corak
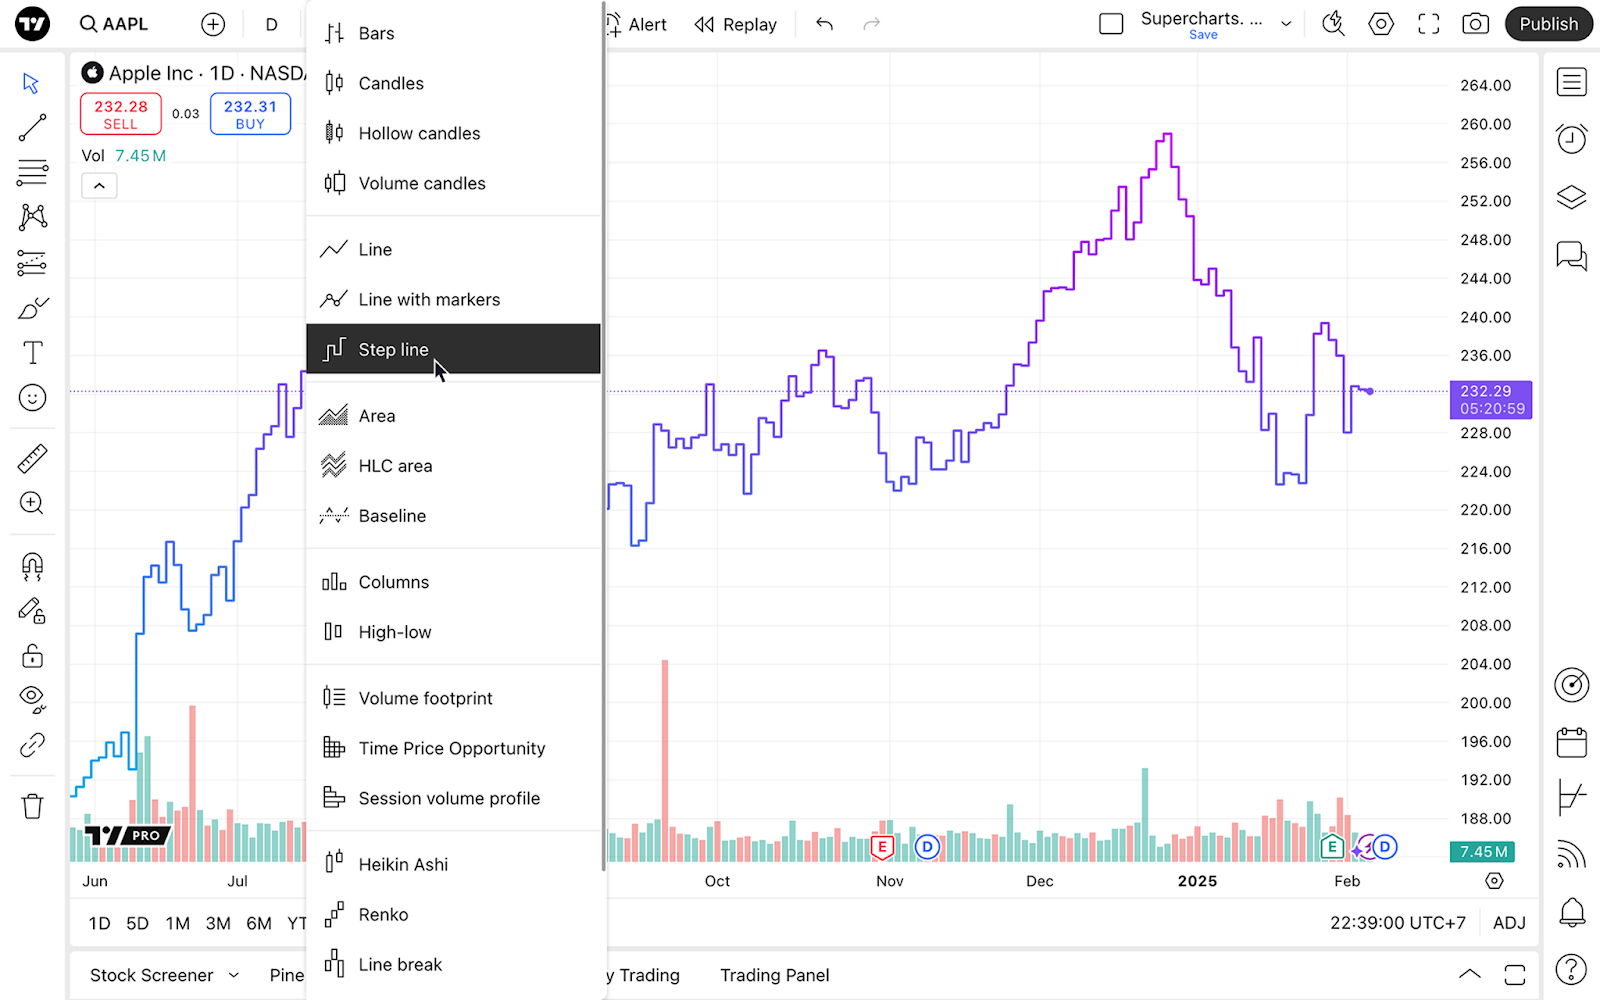
Mengaktifkan jenis carta
Sebaik sahaja anda berada pada Carta Super, buka menu jenis carta pada alat bar atas dan pilih "Garis tangga"
Tetapan
Untuk menggunakan sepenuhnya carta garis, anda boleh mensesuaikannya mengikut kegemaran dan keperluan anda.
Untuk melakukannya, cari butang berbentuk gear "Tetapan" pada bar alat atas dan pergi ke tab "Simbol".
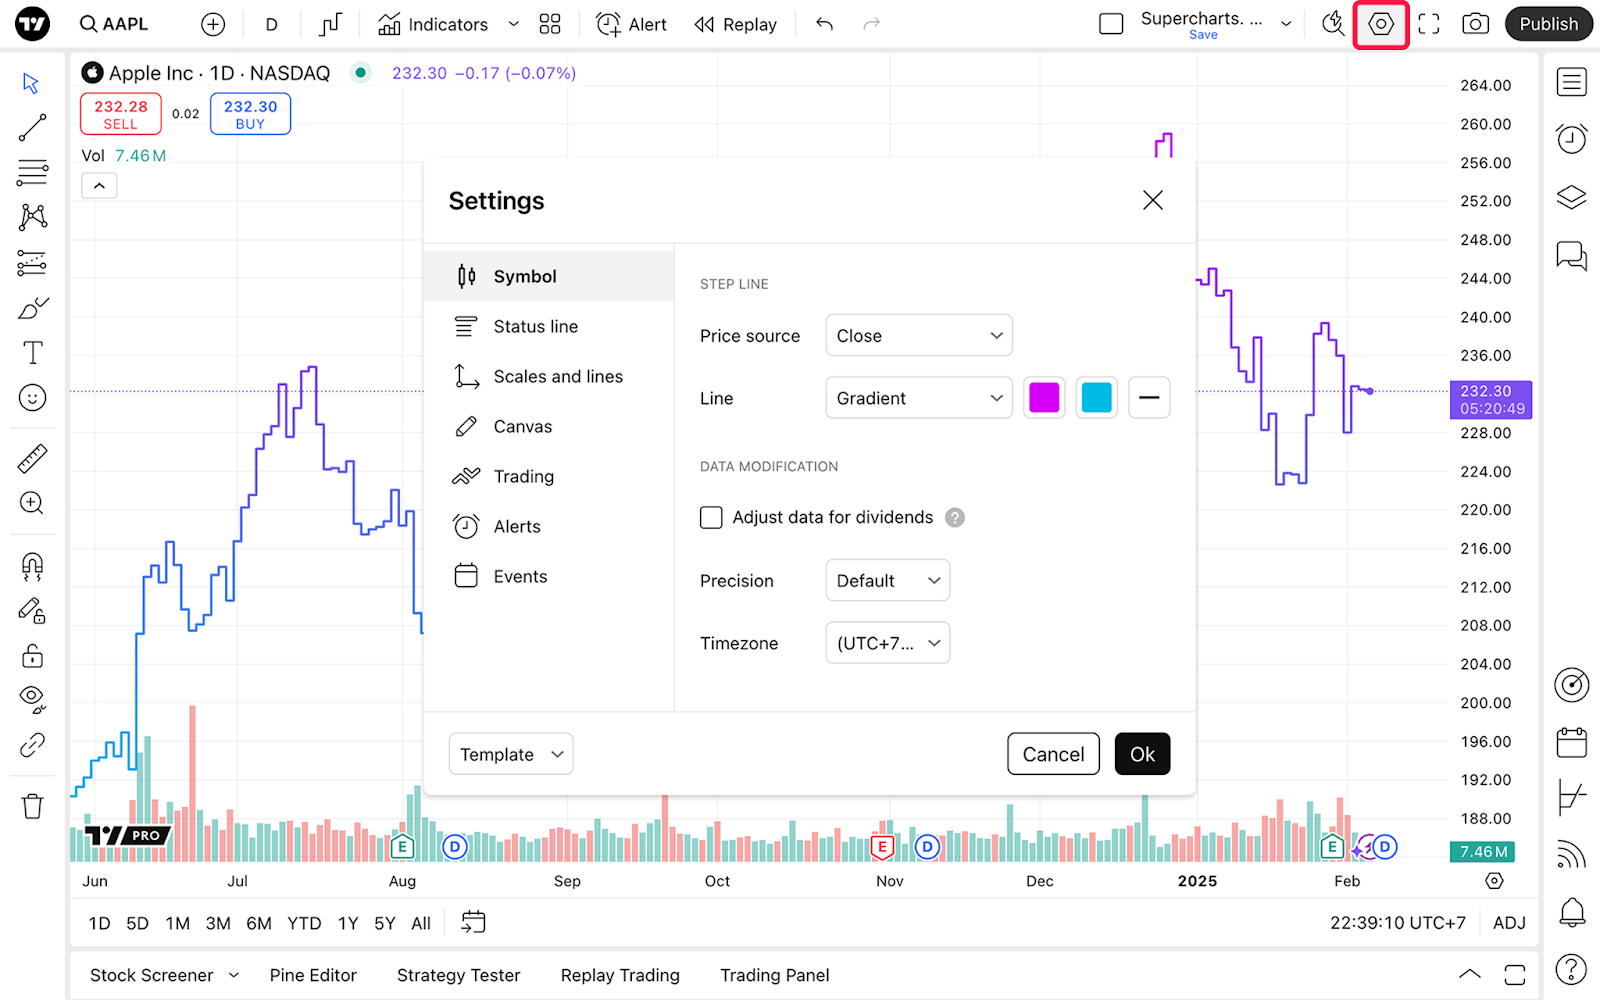
Bahagian "Garis tangga" menyenaraikan tetapan khusus kepada jenis carta ini:
- Sumber harga: Pilih harga yang anda mahu carta tunjukkan. Secara lalai, ia ditetapkan kepada harga tutup bermaksud carta garis tangga akan dibentuk dengan harga tutup sebuah aset. Mengikut gaya dagangan anda, pilih harga yang diingini:
- Buka: Carta akan menunjukkan harga buka
- Tinggi: Menunjukkan hanya harga tertinggi
- Rendah: Menunjukkan hanya harga terendah
- Tutup: Menunjukkan hanya harga tutup
- (H + L)/2: Menunjukkan purata harga tertinggi dan terendah
- (H + L + C)/3: Menunjukkan purata harga tertinggi, terendah dan penutup
- (O + H + L + C)/4: Menunjukkan purata harga buka, tertinggi, terendah dan penutup
- Garis: Dengan tetapan ini diaktifkan, warna garis, ketebalan dan kelegapannya boleh diubah bergantung kepada kegemaran anda. Di sini, anda juga boleh memilih antara kecerunan warna dan garis padu.
Rumusan carta garis tangga
Jika anda mencartakan data kewangan, carta garis tangga boleh membantu anda memahami perubahan nilai lebih tepat berbanding jenis carta lain.
Akan tetapi ia tidak terhad kepada kewangan — terokai kepenggunaannya yang lain dalam masa yang sama anda memperkemaskan strategi dagangan unik anda.
Untuk tujuan itu, pelajari penunjuk TradingView, alatan lukisan dan cuba berlatih Dagangan Kertas — semuanya untuk memastikan analisis anda berkesan. Anda juga boleh mengubah dan menggunakan alatan dagangan lain — dan kami menggalakkan anda melakukannya.
Juga baca: