Please see AAPL chart posted before this one from few days ago*
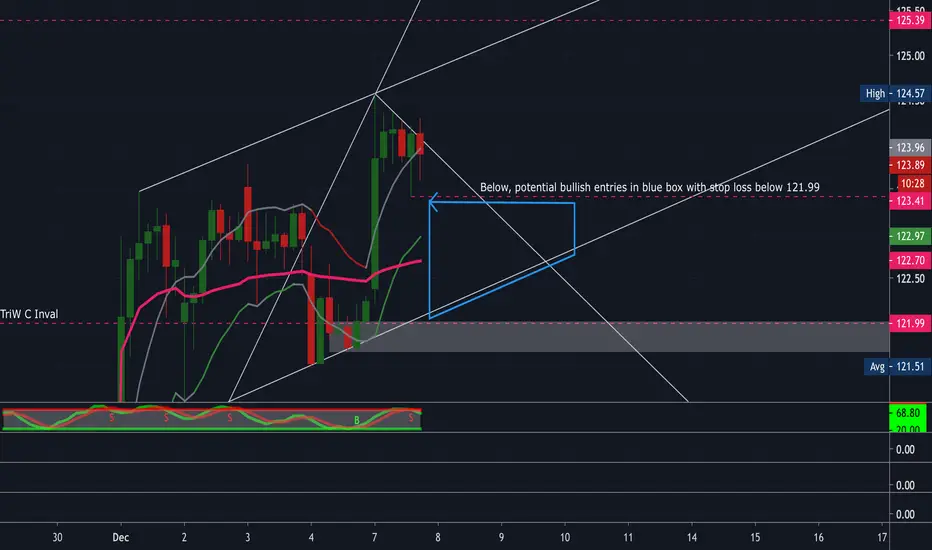
Still holding small long position. Things I'm watching to adjust / add to my position:
1. Risky: potential small short scalp trade (I entered buy Jan 15 120 put / sold 117.50 put) for cost of $84; stop loss if break high of day of $124.57)
2. Price is consolidating just below the high of 124.57; if goes below $123.41, will watch to see if potential opportunity to add to bullish longs (and exit of small scalp trade above if able to generate a few bucks profit)
3. If below $122, will watch for support line in white to hold. My key low to invalidate adding to any more bullish longs is if price goes below $121.99.
This is just a small, maybe one or two day hold trade regarding my scalp.
Again, this is just a potential smaller time frame chart to watch. If, going off previous apple chart post, price stays above the TriW C wave of $121.99, I will lean bullish still and look to add another small bullish long if I can get in below $123.41, watching for break above $125 to maintain my longs.
Penafian
Maklumat dan penerbitan adalah tidak dimaksudkan untuk menjadi, dan tidak membentuk, nasihat untuk kewangan, pelaburan, perdagangan dan jenis-jenis lain atau cadangan yang dibekalkan atau disahkan oleh TradingView. Baca dengan lebih lanjut di Terma Penggunaan.
Penafian
Maklumat dan penerbitan adalah tidak dimaksudkan untuk menjadi, dan tidak membentuk, nasihat untuk kewangan, pelaburan, perdagangan dan jenis-jenis lain atau cadangan yang dibekalkan atau disahkan oleh TradingView. Baca dengan lebih lanjut di Terma Penggunaan.