Hello, traders!
This chart has taken a beating as coming from a high of $150.00 to now currently it is at $0.53 per share. A decrease of 99% and it appears, it will continue.
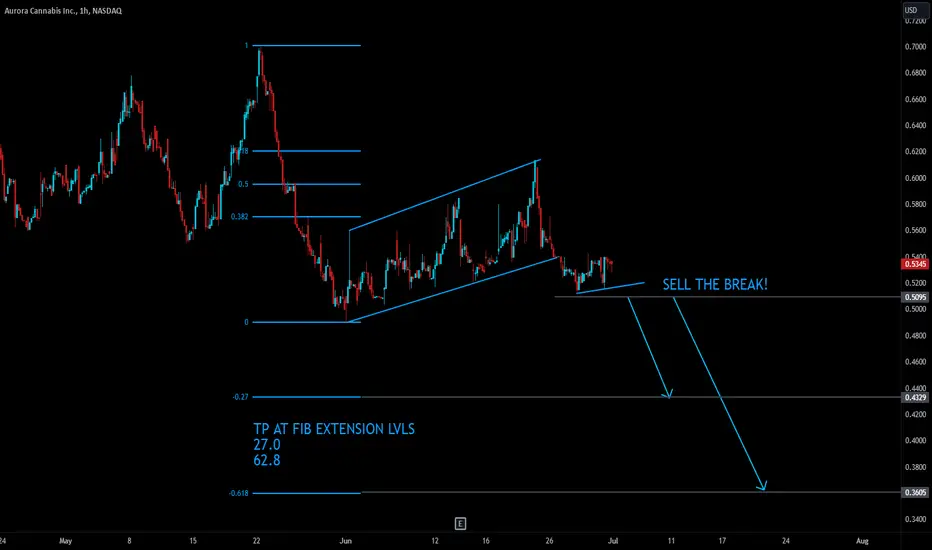
What we are currently looking at is a bearish channel, an indicator of consistent downtrend, and has broken out on the 1 hour time frame, signaling an intensification of the bearish trend. Now is the time to strategize.
We need more confirmation before entering a short. When this flag breaks, I will be short #ACB and I will be taking profits at the main impulse fib extension 27.0 and 61.8.
Manage your risk, follow your plan and document your results! :)
This chart has taken a beating as coming from a high of $150.00 to now currently it is at $0.53 per share. A decrease of 99% and it appears, it will continue.
What we are currently looking at is a bearish channel, an indicator of consistent downtrend, and has broken out on the 1 hour time frame, signaling an intensification of the bearish trend. Now is the time to strategize.
We need more confirmation before entering a short. When this flag breaks, I will be short #ACB and I will be taking profits at the main impulse fib extension 27.0 and 61.8.
Manage your risk, follow your plan and document your results! :)
Penafian
Maklumat dan penerbitan adalah tidak dimaksudkan untuk menjadi, dan tidak membentuk, nasihat untuk kewangan, pelaburan, perdagangan dan jenis-jenis lain atau cadangan yang dibekalkan atau disahkan oleh TradingView. Baca dengan lebih lanjut di Terma Penggunaan.
Penafian
Maklumat dan penerbitan adalah tidak dimaksudkan untuk menjadi, dan tidak membentuk, nasihat untuk kewangan, pelaburan, perdagangan dan jenis-jenis lain atau cadangan yang dibekalkan atau disahkan oleh TradingView. Baca dengan lebih lanjut di Terma Penggunaan.