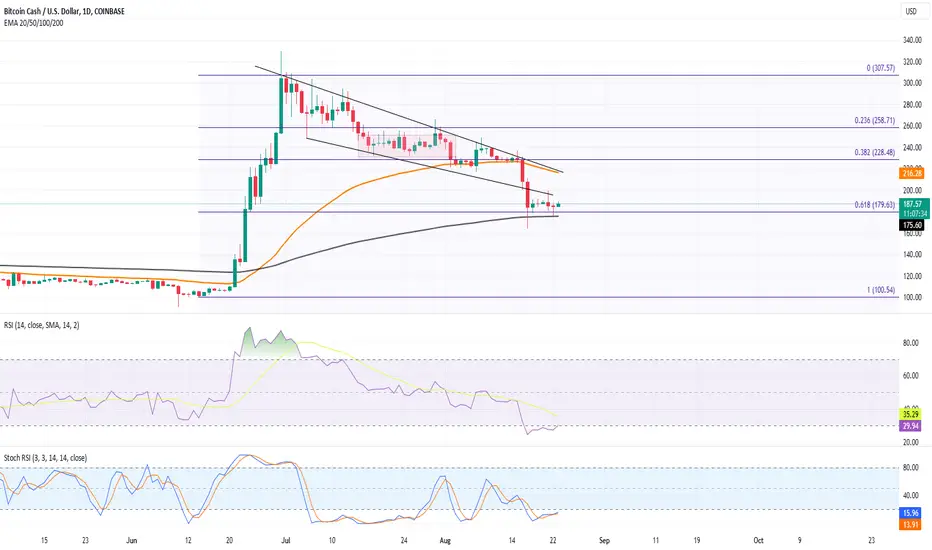
Silver Lining: BCH steadies its price at the 200-day EMA after a significant fall, suggesting a potential solid support and buying zone.
Market Resilience: BCH remains stable over the past week, largely unaffected by the broader market sell-off.
Key Support Levels: Both the 200-day EMA and the 61.80% Fibonacci level at $180 indicate strong investor confidence in BCH.
YTD Gains: BCH boasts an impressive 96% year-to-date gain, outperforming many major altcoins.
Decline from Peak: A 42% decline from its 2023 peak raises questions about BCH's future trajectory.
Technical Indicators: The daily chart's Stochastic RSI and RSI hint at a potential comeback from oversold conditions.
4H Chart Analysis: A double bottom pattern seems to form around $180, with a $190 neckline, suggesting a bullish trend.
Bullish Divergence: The 4H RSI shows a bullish divergence, increasing the likelihood of a positive breakout.
Potential Reversal: Technical signs point to BCH preparing for a reversal, possibly surpassing the $200 mark and aiming for $228 (the 38.20% Fibonacci level).
Downside Risk: If BCH dips below $175, it could further decline towards $150.
Penafian
Maklumat dan penerbitan adalah tidak dimaksudkan untuk menjadi, dan tidak membentuk, nasihat untuk kewangan, pelaburan, perdagangan dan jenis-jenis lain atau cadangan yang dibekalkan atau disahkan oleh TradingView. Baca dengan lebih lanjut di Terma Penggunaan.
Penafian
Maklumat dan penerbitan adalah tidak dimaksudkan untuk menjadi, dan tidak membentuk, nasihat untuk kewangan, pelaburan, perdagangan dan jenis-jenis lain atau cadangan yang dibekalkan atau disahkan oleh TradingView. Baca dengan lebih lanjut di Terma Penggunaan.