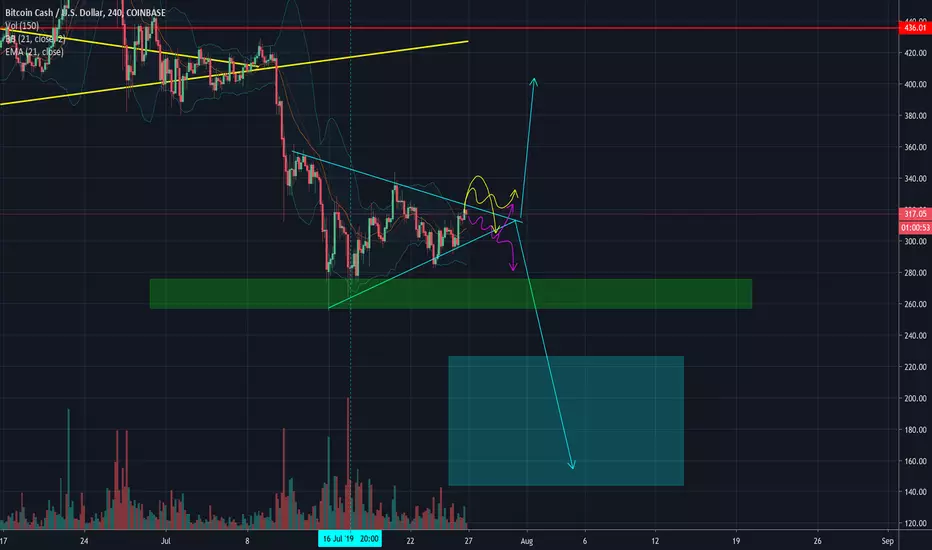
There is a symmetrical triangle on bitcoin cash at the moment. The highest volume candle is denoted by the dotted light blue line, this point is used to reference the peak width of the triangle. If this symmetrical triangle was to break out to the upside, the price objective would be ~400. Since this symmetrical triangle came from a downtrend from a top, the price objective of the symmetrical triangle including the pole from the down trend would be 155 which is seen in the light blue box (the light blue box includes the price objective if only the triangle was valid, so the upper price of the box is the price objective of the triangle), but there is strong support due to the gap around in the mid 300's so it is extremely possible that this price objective isn't hit.
No matter what direction this breaks out, this would be a solid trade. Look for a break out and consolidation on the upper or lower bounds of the triangle, or look for a spring or upthrust in the pattern. A low volume spring is very bullish and a high volume upthrust is very bearish. Crudely drawn are some examples of what to look for.
Upthrust: Bull Trap
Spring: Bear Trap
Penafian
Maklumat dan penerbitan adalah tidak dimaksudkan untuk menjadi, dan tidak membentuk, nasihat untuk kewangan, pelaburan, perdagangan dan jenis-jenis lain atau cadangan yang dibekalkan atau disahkan oleh TradingView. Baca dengan lebih lanjut di Terma Penggunaan.
Penafian
Maklumat dan penerbitan adalah tidak dimaksudkan untuk menjadi, dan tidak membentuk, nasihat untuk kewangan, pelaburan, perdagangan dan jenis-jenis lain atau cadangan yang dibekalkan atau disahkan oleh TradingView. Baca dengan lebih lanjut di Terma Penggunaan.