Technical Analysis
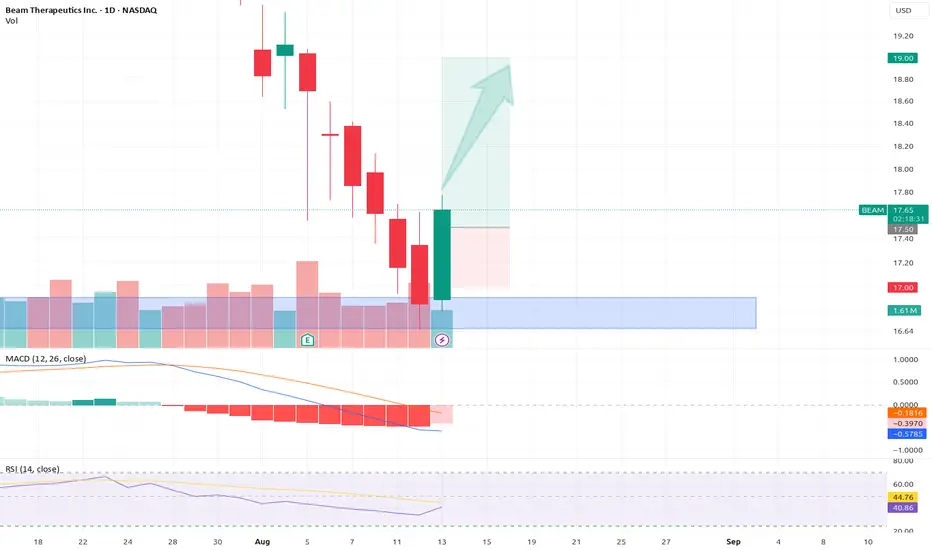
Instrument BEAM (Beam Therapeutics Inc.) – Daily/4H Chart
Key Support: Strong demand zone near $17, acting as a reversal level.
Indicators
MACD Bullish crossover above the zero line, signaling strengthening momentum.
RSI Bounced from ~50 (neutral), now trending upward without overbought conditions.
Structure Higher low formed at $17, suggesting a potential uptrend continuation.
Potential Scenarios
Bullish Breakout
If price holds above $17.50, next targets are $18.50 (resistance) and $19 (psychological level).
A close above $19 could extend gains toward $20.
Risk Management
Stop-Loss Below $17 (invalidates the reversal structure).
Take-Profit Scale out at $18.50 and $19.
Penafian
Maklumat dan penerbitan adalah tidak dimaksudkan untuk menjadi, dan tidak membentuk, nasihat untuk kewangan, pelaburan, perdagangan dan jenis-jenis lain atau cadangan yang dibekalkan atau disahkan oleh TradingView. Baca dengan lebih lanjut di Terma Penggunaan.
Penafian
Maklumat dan penerbitan adalah tidak dimaksudkan untuk menjadi, dan tidak membentuk, nasihat untuk kewangan, pelaburan, perdagangan dan jenis-jenis lain atau cadangan yang dibekalkan atau disahkan oleh TradingView. Baca dengan lebih lanjut di Terma Penggunaan.