summary of the (Beam Therapeutics Inc. – BEAM) Daily Time fram
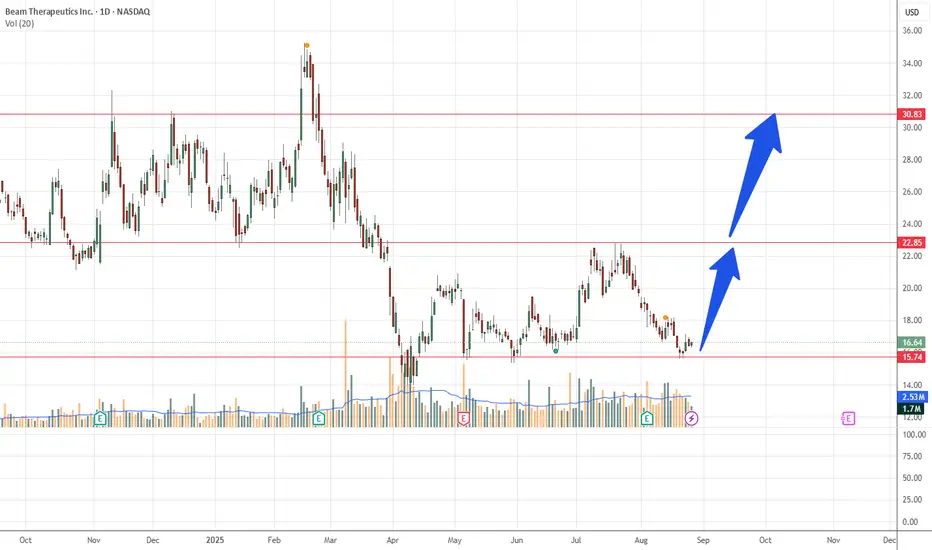
Current Price: Around $16.63 (slightly above the $16 support zone).
Support Zone: Strong support near $15.74. The stock recently bounced from this level.
Resistance Levels:
First key resistance around $22.85 – $23.24.
Next major resistance near $30.79 – $30.83.
Volume: Recent trading volume ~1.2M, close to the average. No unusual spike in volume.
First target if momentum continues is ~$23.2.
If it breaks above that, the next target zone is around $30.8.
Trend: The stock has been in a downtrend but may be forming a short-term bottom at $15.7 support.
📌 In short: BEAM is trying to bounce from strong support. The key upside checkpoints are $23 and then $31. A breakdown below $15.7 would invalidate the bullish setup.
Dagangan aktif
Dagangan ditutup: sasaran tercapai
First target reachedNota
reached second target Penafian
Maklumat dan penerbitan adalah tidak bertujuan, dan tidak membentuk, nasihat atau cadangan kewangan, pelaburan, dagangan atau jenis lain yang diberikan atau disahkan oleh TradingView. Baca lebih dalam Terma Penggunaan.
Penafian
Maklumat dan penerbitan adalah tidak bertujuan, dan tidak membentuk, nasihat atau cadangan kewangan, pelaburan, dagangan atau jenis lain yang diberikan atau disahkan oleh TradingView. Baca lebih dalam Terma Penggunaan.