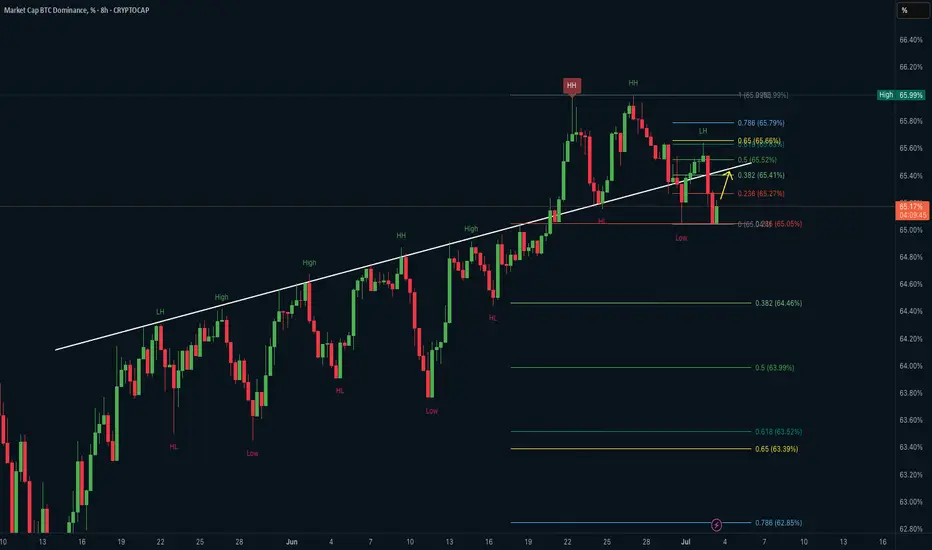
This analysis focuses on the 8 hour chart of Bitcoin Dominance (BTC.D), showing a possible retracement bounce after a recent market structure shift.
Key observations:
• BTC.D formed a higher high (HH) before pulling back sharply to a key demand zone.
• A long term ascending trendline has been broken and is currently being retested from below.
• Price tapped the 0.236 Fib retracement zone and is now bounce hard from that level.
• The yellow arrow suggests a possible short term move back toward the 0.382 or 0.5 Fib levels (~65.4%–65.5%).
Key levels to watch:
• Resistance: 65.52%, 65.66%, 65.79% (Fib cluster + previous LH)
• Support: 65.05% (local low), below which further downside may unfold
• A strong rejection at the 0.65 level could confirm lower high structure continuation
BTC Dominance is important for altcoin traders:
A rise in BTC dominance usually indicates capital rotating into BTC and away from alts, while a drop opens opportunities for altcoin strength.
Penafian
Maklumat dan penerbitan adalah tidak dimaksudkan untuk menjadi, dan tidak membentuk, nasihat untuk kewangan, pelaburan, perdagangan dan jenis-jenis lain atau cadangan yang dibekalkan atau disahkan oleh TradingView. Baca dengan lebih lanjut di Terma Penggunaan.
Penafian
Maklumat dan penerbitan adalah tidak dimaksudkan untuk menjadi, dan tidak membentuk, nasihat untuk kewangan, pelaburan, perdagangan dan jenis-jenis lain atau cadangan yang dibekalkan atau disahkan oleh TradingView. Baca dengan lebih lanjut di Terma Penggunaan.