1. Trendlines
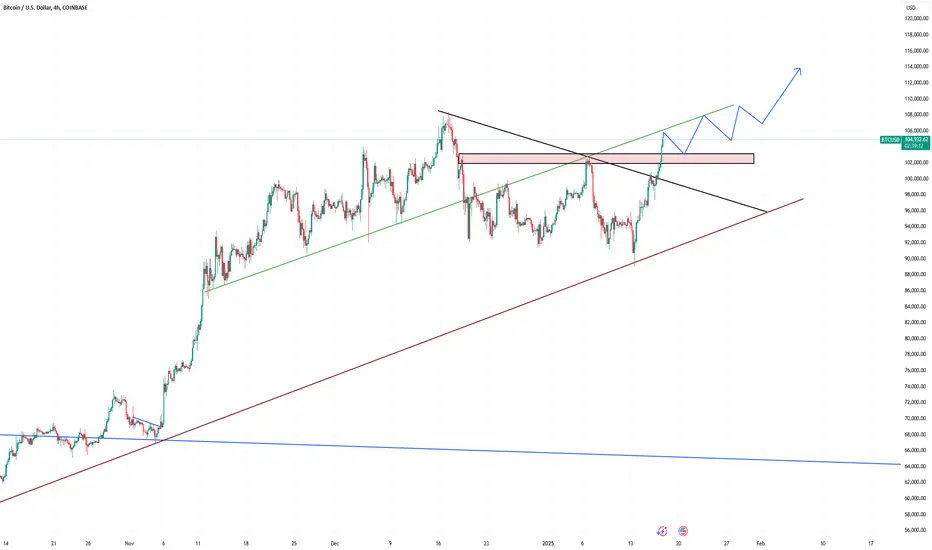
Green Ascending Trendline: Indicates an ongoing bullish trend, connecting higher lows and showing upward momentum.
Blue Long-Term Trendline: Suggests a stronger long-term support level that aligns with the overall bullish structure.
Black Descending Trendline: Marks a resistance zone from a previous downtrend, now broken, signaling a potential trend reversal.
2. Key Price Levels
Pink Horizontal Zone (Resistance Turned Support): Highlights a critical area around $102,000 to $104,000. This area acted as resistance but was broken and may now serve as support.
Current Price: The BTC/USD pair is trading around $105,000, showing strong bullish momentum.
3. Price Projection
Blue Arrows: Indicate a potential bullish continuation pattern, where the price could consolidate around the broken resistance ($102,000-$104,000) before making another upward move toward $110,000 or higher.
Consolidation Zones: Suggest minor corrections or pullbacks before the next upward push.
4. Market Sentiment
The break of the descending trendline and the successful retest of support levels signal a bullish outlook.
The chart suggests confidence in higher highs, with a steady uptrend intact.
Penafian
Maklumat dan penerbitan adalah tidak dimaksudkan untuk menjadi, dan tidak membentuk, nasihat untuk kewangan, pelaburan, perdagangan dan jenis-jenis lain atau cadangan yang dibekalkan atau disahkan oleh TradingView. Baca dengan lebih lanjut di Terma Penggunaan.
Penafian
Maklumat dan penerbitan adalah tidak dimaksudkan untuk menjadi, dan tidak membentuk, nasihat untuk kewangan, pelaburan, perdagangan dan jenis-jenis lain atau cadangan yang dibekalkan atau disahkan oleh TradingView. Baca dengan lebih lanjut di Terma Penggunaan.