Looking at the chart you shared, it’s a Bitcoin (BTC/USD) 1-hour timeframe setup.
Here's the breakdown:
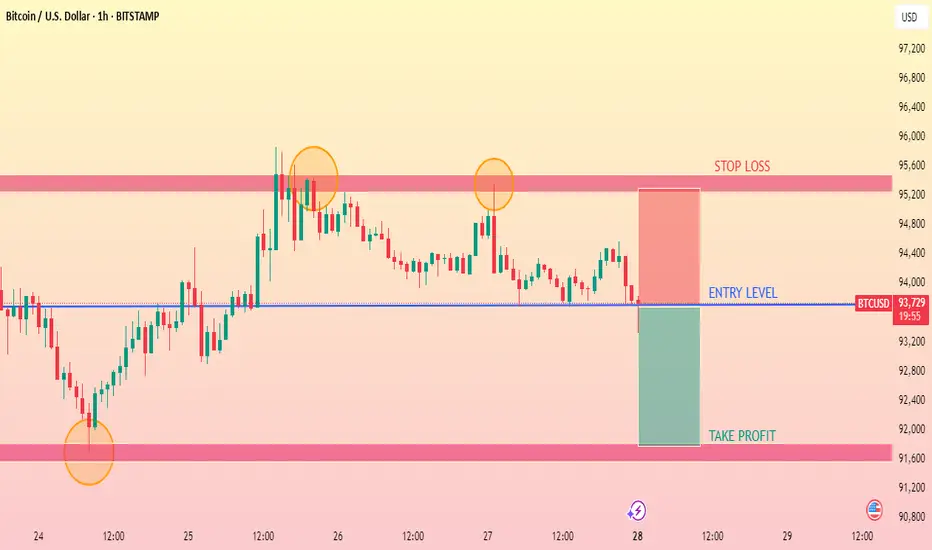
Entry Level is marked around $93,685.
Stop Loss is placed in the resistance zone around $95,200 - $95,600.
Take Profit is placed around $91,000 - $91,200.
You’ve highlighted previous important supply (resistance) and demand (support) zones with shaded pink/red areas.
Orange circles highlight price rejections from key levels (double/triple top pattern).
It looks like you're planning a short (sell) position, expecting the price to drop
Here's the breakdown:
Entry Level is marked around $93,685.
Stop Loss is placed in the resistance zone around $95,200 - $95,600.
Take Profit is placed around $91,000 - $91,200.
You’ve highlighted previous important supply (resistance) and demand (support) zones with shaded pink/red areas.
Orange circles highlight price rejections from key levels (double/triple top pattern).
It looks like you're planning a short (sell) position, expecting the price to drop
Dagangan aktif
TRADE ACTIVEPenafian
Maklumat dan penerbitan adalah tidak dimaksudkan untuk menjadi, dan tidak membentuk, nasihat untuk kewangan, pelaburan, perdagangan dan jenis-jenis lain atau cadangan yang dibekalkan atau disahkan oleh TradingView. Baca dengan lebih lanjut di Terma Penggunaan.
Penafian
Maklumat dan penerbitan adalah tidak dimaksudkan untuk menjadi, dan tidak membentuk, nasihat untuk kewangan, pelaburan, perdagangan dan jenis-jenis lain atau cadangan yang dibekalkan atau disahkan oleh TradingView. Baca dengan lebih lanjut di Terma Penggunaan.