Chart Analysis – BTC/USD (Daily Timeframe)
Trend Overview:
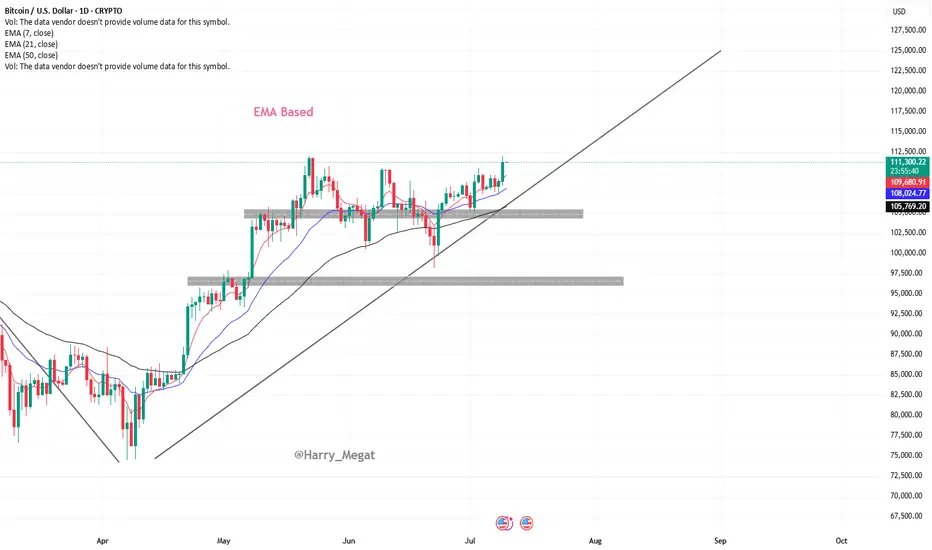
* The chart shows **Bitcoin (BTC/USD)** on the **daily timeframe**.
* Price is in a **clear uptrend**, making **higher highs and higher lows**.
* The recent breakout above **\$111,000** suggests a **bullish continuation**.
Moving Average Analysis (EMA 7, 21, 50):
* **EMA 7 > EMA 21 > EMA 50** — this alignment confirms **strong bullish momentum**.
* Price is **well above all EMAs**, especially the 50 EMA (\~\$105,546), showing trend strength and possible institutional support.
* EMAs are **sloping upward**, which further confirms the upward momentum.
Recent Breakout:
* BTC broke out of a **short-term consolidation zone** between \~\$108,000–\$111,000.
* Today’s candle shows a **strong bullish close**, indicating fresh buying interest.
* If this breakout holds, price could extend toward the **next psychological level of \$115,000–\$117,500**.
Support Zones to Watch:
* **Minor support:** \~\$109,000 (EMA 7 + breakout retest area)
* **Stronger support:** \~\$105,500 (EMA 50 and previous swing low)
A break below **\$105,500** could signal a trend shift or deeper pullback.
Summary:
Bitcoin is showing **strong bullish structure** on the daily chart with EMAs aligned upward and a recent breakout above \$111,000. If momentum holds, next upside targets are around **\$115,000–\$117,500**. The bullish trend remains intact unless price breaks and closes below **\$105,500**.

Trend Overview:
* The chart shows **Bitcoin (BTC/USD)** on the **daily timeframe**.
* Price is in a **clear uptrend**, making **higher highs and higher lows**.
* The recent breakout above **\$111,000** suggests a **bullish continuation**.
Moving Average Analysis (EMA 7, 21, 50):
* **EMA 7 > EMA 21 > EMA 50** — this alignment confirms **strong bullish momentum**.
* Price is **well above all EMAs**, especially the 50 EMA (\~\$105,546), showing trend strength and possible institutional support.
* EMAs are **sloping upward**, which further confirms the upward momentum.
Recent Breakout:
* BTC broke out of a **short-term consolidation zone** between \~\$108,000–\$111,000.
* Today’s candle shows a **strong bullish close**, indicating fresh buying interest.
* If this breakout holds, price could extend toward the **next psychological level of \$115,000–\$117,500**.
Support Zones to Watch:
* **Minor support:** \~\$109,000 (EMA 7 + breakout retest area)
* **Stronger support:** \~\$105,500 (EMA 50 and previous swing low)
A break below **\$105,500** could signal a trend shift or deeper pullback.
Summary:
Bitcoin is showing **strong bullish structure** on the daily chart with EMAs aligned upward and a recent breakout above \$111,000. If momentum holds, next upside targets are around **\$115,000–\$117,500**. The bullish trend remains intact unless price breaks and closes below **\$105,500**.
Dagangan aktif
Bitcoin (BTC) Update:BTC has surged near **\$117,000**, extending its bullish momentum and hitting fresh highs. The move confirms strong institutional demand and favorable macro tailwinds. As long as price holds above **\$112,000**, the next potential targets lie at **\$118,000** and **\$120,000**, while support now sits at **\$113,000–\$115,000** on any pullback. Trend remains firmly bullish.
Dagangan ditutup: sasaran tercapai
Gold approaches two-week highs near $3,373 amid renewed safe-haven demand. Trade tensions continue to fuel risk-off sentiment, supporting bullish momentum in the metal toward the week’s close.Penafian
Maklumat dan penerbitan adalah tidak dimaksudkan untuk menjadi, dan tidak membentuk, nasihat untuk kewangan, pelaburan, perdagangan dan jenis-jenis lain atau cadangan yang dibekalkan atau disahkan oleh TradingView. Baca dengan lebih lanjut di Terma Penggunaan.
Penafian
Maklumat dan penerbitan adalah tidak dimaksudkan untuk menjadi, dan tidak membentuk, nasihat untuk kewangan, pelaburan, perdagangan dan jenis-jenis lain atau cadangan yang dibekalkan atau disahkan oleh TradingView. Baca dengan lebih lanjut di Terma Penggunaan.