📈 Bitcoin Long-Term Technical Outlook – Monthly Chart
This chart presents a macro-level technical analysis of Bitcoin using the monthly timeframe, highlighting key structural channels and Elliott Wave projections.
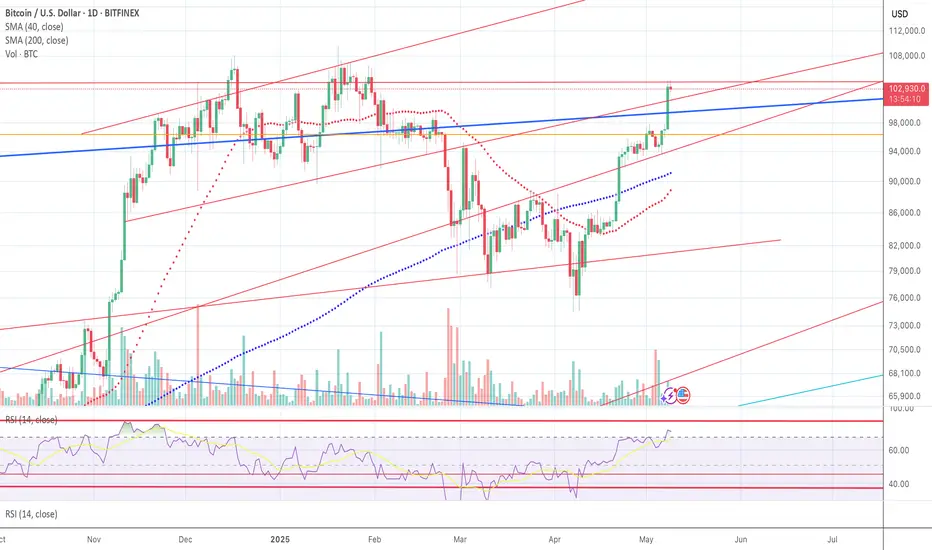
🔹 The broader ascending channel (blue) captures Bitcoin’s multi-cycle expansion since inception, with price currently rebounding from the midline support.
🔹 A secondary tighter ascending channel (red) frames the current cycle, suggesting a more accelerated slope in this bull phase. Price is approaching the upper bounds, signaling potential exhaustion areas.
🔹 The Elliott Wave structure overlays two possible scenarios:
• Primary Count (bold blue): Wave 5 in development, with an optimistic target in the ~$224K–$250K range if Wave 3 extends.
• Alternate Count (lighter blue): A more conservative end to Wave 5 closer to ~$130K.
🔹 RSI (14) on the monthly chart is nearing overbought territory but not yet peaking. The double-top formation in RSI from previous cycles is watched closely for signs of trend exhaustion.
🟢 Overall bias remains bullish as long as Bitcoin remains inside the ascending channel with higher highs and higher lows. However, caution is warranted as it approaches long-term resistance levels.
📌 Chart authored for educational purposes — not financial advice.
Penafian
Maklumat dan penerbitan adalah tidak dimaksudkan untuk menjadi, dan tidak membentuk, nasihat untuk kewangan, pelaburan, perdagangan dan jenis-jenis lain atau cadangan yang dibekalkan atau disahkan oleh TradingView. Baca dengan lebih lanjut di Terma Penggunaan.
Penafian
Maklumat dan penerbitan adalah tidak dimaksudkan untuk menjadi, dan tidak membentuk, nasihat untuk kewangan, pelaburan, perdagangan dan jenis-jenis lain atau cadangan yang dibekalkan atau disahkan oleh TradingView. Baca dengan lebih lanjut di Terma Penggunaan.