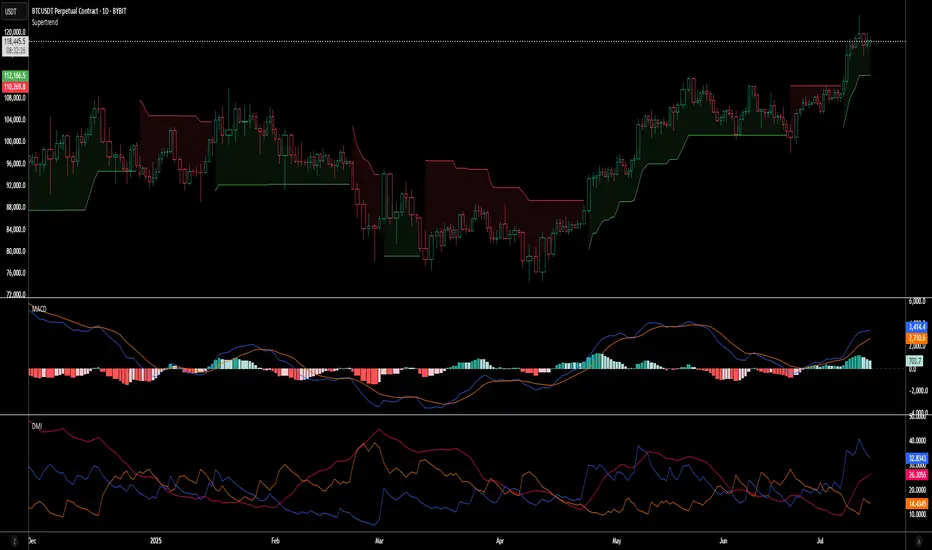
Many commonly used indicators—RSI, MACD, and others—show win rates around **30–40%** when used as direct trade signals and may make a slight profit overall, but loose in a ranging market.
Oddly enough, if you reverse them—buy when it says sell, sell when it says buy—you can often push the win rate up to **65–70%**.
But here’s the catch:
👉 Even with a high win rate, these “inverse strategies” still **tend to lose money** over time. Why? The few times the market trends it will wipe out any profits you might have made.
---
🧠 What's Really Going On?
* Indicators trigger **crowd behavior**, not institutional intent.
* Institutions use crowd-driven signals to identify **liquidity clusters**
* Standard signals become **traps**, not trade ideas.
I call this Hidden or Dynamic liquidity
So when indicators say "Buy!", the smart money sees that as an opportunity to sell *into* the crowd’s enthusiasm—then reverse the move once retail traders are trapped.
Institutions can see when, say the 20 SMA is about to cross the 50 SMA. This gives them a heads up that and opportunity may be coming to use the liquidity it generates from the ensuing retail trades to enter their opposing trades.
---
⚠️ Takeaway:
Indicators may be more useful as **tools to locate liquidity**, not predict direction.
Use them to observe where *others* are getting in, then ask:
🔍 *If I were a large player needing liquidity, where would I execute my order?*
See Indicators triggering not as entry positions but as potential pivot points.
Penafian
Maklumat dan penerbitan adalah tidak dimaksudkan untuk menjadi, dan tidak membentuk, nasihat untuk kewangan, pelaburan, perdagangan dan jenis-jenis lain atau cadangan yang dibekalkan atau disahkan oleh TradingView. Baca dengan lebih lanjut di Terma Penggunaan.
Penafian
Maklumat dan penerbitan adalah tidak dimaksudkan untuk menjadi, dan tidak membentuk, nasihat untuk kewangan, pelaburan, perdagangan dan jenis-jenis lain atau cadangan yang dibekalkan atau disahkan oleh TradingView. Baca dengan lebih lanjut di Terma Penggunaan.
