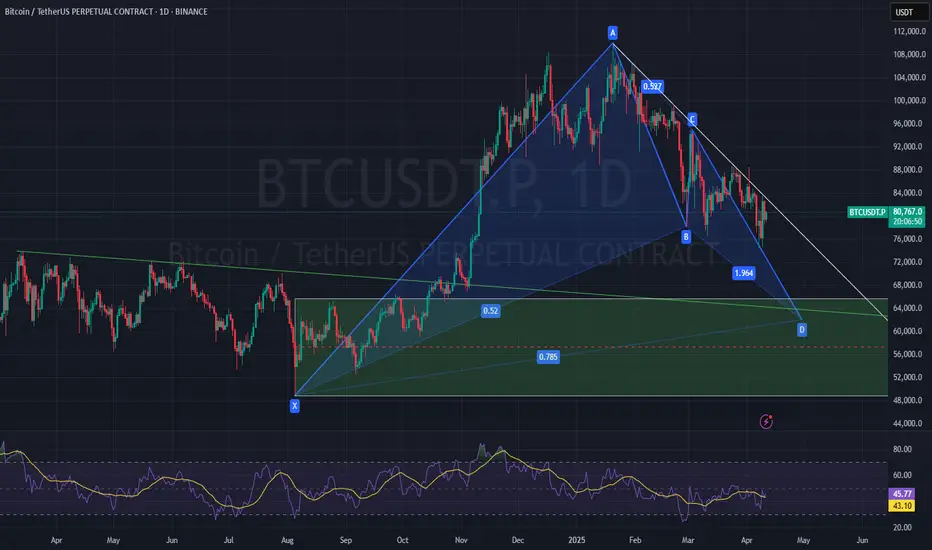
BTCUSD – Bullish Gartley Pattern Forming
✅ Market Context:
Pattern: Bullish Gartley
Current Trend: Mid-term bearish
Key Bullish Level: $62,000 (Potential PRZ – bullish reversal zone)
Resistance: Long-standing bearish trendline, tested multiple times
Support: Bullish trendline aligning near the Gartley PRZ at $62,000
🧩 Gartley Breakdown:
XA: Strong bullish move
AB: Retraces 61.8% of XA
BC: Retraces 38.2–88.6% of AB
CD: Extends to 78.6% of XA
→ Completion zone at $62,000
📈 Trade Idea – Prepare for LONG Setup
Scenario 1: Price Drops to $62,000
Look for bullish confirmation (candle pattern, divergence)
Ideal entry zone to long from PRZ
Stop-loss: Below Gartley X-point or local low (~$60,500–$61,000)
Scenario 2: Price Consolidates Under Trendline
If it breaks the bearish trendline, prepare for early momentum breakout
Wait for a retest of the breakout and enter
Targets:
TP1: $65,500 (structure)
TP2: $68,000 (Fibonacci 0.618)
TP3: $70,000+
Risk-Reward: Aim for 1:2 or higher
⚠️ What to Watch:
Daily RSI/MACD for divergence confirmation
BTC volume confirmation near $62,000
Macro news: BTC ETF flows, Fed stance on rates, CPI
Penafian
Maklumat dan penerbitan adalah tidak dimaksudkan untuk menjadi, dan tidak membentuk, nasihat untuk kewangan, pelaburan, perdagangan dan jenis-jenis lain atau cadangan yang dibekalkan atau disahkan oleh TradingView. Baca dengan lebih lanjut di Terma Penggunaan.
Penafian
Maklumat dan penerbitan adalah tidak dimaksudkan untuk menjadi, dan tidak membentuk, nasihat untuk kewangan, pelaburan, perdagangan dan jenis-jenis lain atau cadangan yang dibekalkan atau disahkan oleh TradingView. Baca dengan lebih lanjut di Terma Penggunaan.