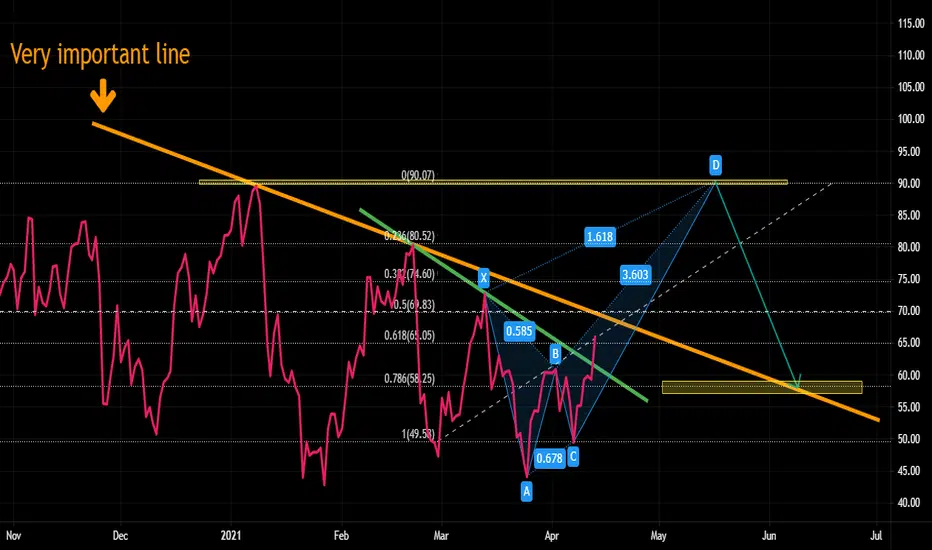
In the daily chart, an obvious divergence is visible. If Bitcoin breaks the important orange trend line (I emphasize the orange trend line is extremely important), it will break the daily divergence out and probably it will rise up in order to complete crab harmonic pattern (RSI level 90). And then, it might fall down to RSI level 58.
And yet, what will happen to Bitcoin price ?
I will illustrate that in my next post.
And yet, what will happen to Bitcoin price ?
I will illustrate that in my next post.
Penafian
Maklumat dan penerbitan adalah tidak dimaksudkan untuk menjadi, dan tidak membentuk, nasihat untuk kewangan, pelaburan, perdagangan dan jenis-jenis lain atau cadangan yang dibekalkan atau disahkan oleh TradingView. Baca dengan lebih lanjut di Terma Penggunaan.
Penafian
Maklumat dan penerbitan adalah tidak dimaksudkan untuk menjadi, dan tidak membentuk, nasihat untuk kewangan, pelaburan, perdagangan dan jenis-jenis lain atau cadangan yang dibekalkan atau disahkan oleh TradingView. Baca dengan lebih lanjut di Terma Penggunaan.