🌟Hi! Hola! Ola! Bonjour! Hallo! Marhaba!🌟
Dear Money Makers & Robbers, 🤑💰✈️
Based on 🔥Thief Trading style technical and fundamental analysis🔥, here is our master plan to heist the BTC/USDT "Bitcoin vs Tether" Crypto market. Please adhere to the strategy I've outlined in the chart, which emphasizes long entry and short entry. 🏆💸Be wealthy and safe trade.💪🏆🎉
Entry 📈 :
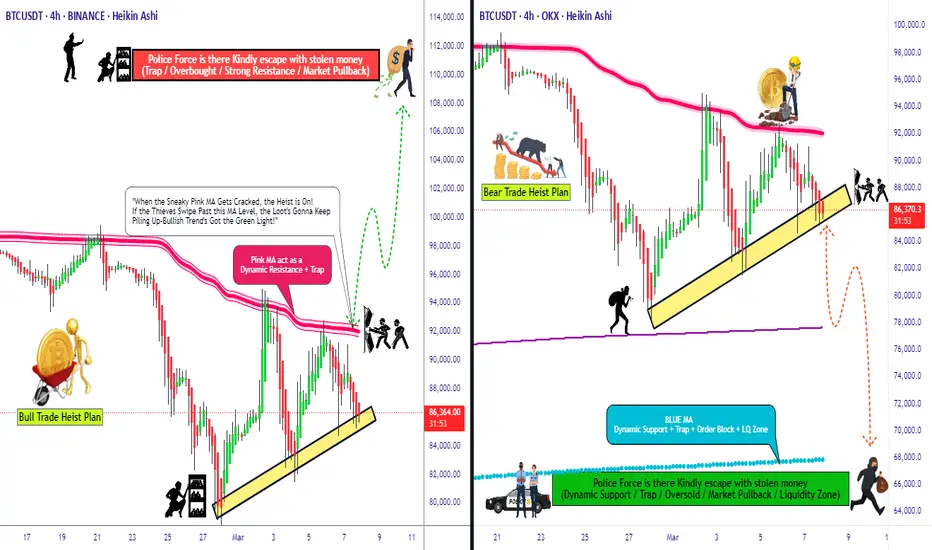
"The loot's within reach! Wait for the breakout, then grab your share - whether you're a Bullish thief or a Bearish bandit!"
🏁Buy entry above 93000
🏁Sell Entry below 84000
📌However, I recommended to place buy stop for bullish side and sell stop for bearish side.
Stop Loss 🛑:
🚩Thief SL placed at 88000 (swing Trade Basis) for Bullish Trade
🚩Thief SL placed at 92000 (swing Trade Basis) for Bearish Trade
Using the 4H period, the recent / swing low or high level.
SL is based on your risk of the trade, lot size and how many multiple orders you have to take.
Target 🎯:
🏴☠️Bullish Robbers TP 11000 (or) Escape Before the Target
🏴☠️Bearish Robbers TP 68000 (or) Escape Before the Target
📰🗞️Fundamental, Macro, COT Report, On Chain Analysis, Sentimental Outlook, Intermarket Analysis, Future Prediction:
BTC/USDT "Bitcoin vs Tether" Crypto market is currently experiencing a Neutral Trend (slightly Bearish🐼),., driven by several key factors.
1. Fundamental Analysis⭐⚡🌟
Fundamental analysis evaluates Bitcoin’s intrinsic drivers:
Adoption Trends:
Institutional inflows via Bitcoin ETFs remain strong, with $1.5 billion added in Q1 2025. MicroStrategy holds 300,000 BTC, reinforcing corporate adoption—bullish.
Regulatory Environment:
The U.S. signals a pro-crypto stance with talks of a strategic Bitcoin reserve, boosting confidence—bullish. However, global regulatory uncertainty (e.g., EU tax proposals) adds mild bearish pressure.
Halving Impact:
Post-2024 halving (April), supply issuance dropped to 450 BTC/day. Historical patterns suggest price appreciation 12-18 months later, supporting a bullish outlook for 2025.
Network Usage:
Transaction volume is up 10% year-over-year, driven by Layer 2 solutions (e.g., Lightning Network)—bullish for utility and value.
Inflation Hedge Narrative:
With U.S. inflation at 3.0%, Bitcoin’s appeal as a store of value grows—bullish, though tempered by short-term risk-off sentiment.
Detailed Explanation: Fundamentals are strongly bullish long-term due to adoption, supply scarcity, and macro trends. Short-term bearish pressures from regulatory uncertainty and profit-taking explain the current dip to 87,000.
2. Macroeconomic Factors⭐⚡🌟
Macroeconomic conditions influencing BTC/USD:
U.S. Economy:
Fed rates at 3.0% with no immediate cuts signal tighter conditions—bearish short-term as capital favors yield-bearing assets.
Unemployment steady at 4.2% supports economic stability—neutral.
Global Growth:
China’s GDP growth slows to 4.2%, reducing demand for risk assets like Bitcoin—bearish.
Eurozone PMI at 47.8 indicates contraction, pressuring global markets—bearish.
Currency Markets:
USD strength (DXY at 106) weighs on BTC/USD, as a stronger dollar reduces Bitcoin’s appeal—bearish short-term.
Commodity Prices:
Oil at 668/BBL
and gold at $2,950 reflect a mixed risk environment—neutral for Bitcoin.
Geopolitical Risk:
Middle East tensions elevate safe-haven demand, but Bitcoin’s correlation with gold is weakening—neutral to mildly bearish.
Detailed Explanation: Macro factors tilt bearish short-term due to USD strength and global slowdown, countering Bitcoin’s long-term bullish fundamentals. This tension explains the current downward trend from higher levels.
3. Commitments of Traders (COT) Data⭐⚡🌟
COT data reflects futures positioning:
Speculative Traders:
Net long positions at 15,000 contracts, down from 25,000 at the 95,000 peak. Reduced bullishness suggests caution—bearish signal.
Commercial Hedgers:
Net short at 20,000 contracts, stable. Hedgers locking in gains indicate no panic—neutral.
Open Interest:
45,000 contracts, down 10% from February highs. Declining participation hints at fading momentum—bearish.
Detailed Explanation: COT data supports a bearish short-term view. Speculators unwinding longs and falling open interest align with the downward trend, though hedgers’ stability prevents a sharper collapse.
4. On-Chain Analysis⭐⚡🌟
On-chain metrics provide insights into Bitcoin’s network activity:
Exchange Balances:
2.6 million BTC on exchanges, up 5% in March. Rising supply suggests selling pressure—bearish.
Transaction Volume:
Daily volume at $10 billion, flat month-over-month. Lack of growth signals reduced buying interest—neutral to bearish.
HODLing Behavior:
70% of BTC unmoved for over a year (13.8 million coins). Strong holder conviction limits downside—bullish long-term.
Miner Activity:
Miners hold 1.8 million BTC, with minimal outflows. Stable miner behavior supports price floors—mildly bullish.
Realized Price Levels:
Realized cap indicates a cost basis of 78,000 for recent buyers, acting as support—bullish if held.
Detailed Explanation: On-chain data is mixed. Short-term bearish signals from exchange inflows contrast with long-term bullishness from HODLing and miner stability, suggesting a correction rather than a collapse.
5. Intermarket Analysis⭐⚡🌟
Correlations with other markets:
USD Strength:
DXY at 106 pressures BTC/USD inversely—bearish short-term.
S&P 500:
At 5,900, down 2% this week, reflecting risk-off sentiment. Bitcoin’s 0.6 correlation with equities adds downward pressure—bearish.
Gold:
At $2,950, gold rises as a safe haven, decoupling from Bitcoin—neutral to bearish.
Bond Yields:
U.S. 10-year yields at 3.8% attract capital away from risk assets—bearish.
Altcoins:
ETH/BTC ratio at 0.035, with altcoins underperforming Bitcoin, reinforcing BTC’s relative strength—mildly bullish.
Detailed Explanation: Intermarket signals are bearish short-term due to USD strength, equity declines, and yield competition. Bitcoin’s resilience versus altcoins offers some support, but broader risk-off trends dominate.
6. Market Sentiment Analysis⭐⚡🌟
Investor and trader mood:
Retail Sentiment:
Social media analysis shows 45% bullish sentiment, down from 60% at 95,000. Fear of further drops prevails—bearish.
Analyst Views:
Consensus targets range from 80,000 (short-term support) to 100,000 (Q3 2025), reflecting uncertainty—mixed.
Options Market:
Call/put ratio at 0.9, with balanced positioning. No strong directional bias—neutral.
Fear & Greed Index:
At 40 (neutral), down from 70 (greed) in February, indicating cooling enthusiasm—bearish shift.
Detailed Explanation: Sentiment has turned bearish short-term as retail investors react to the decline from 95,000. Analysts’ mixed views and neutral options activity suggest a wait-and-see approach, aligning with the current trend.
7. Next Trend Move and Future Trend Prediction⭐⚡🌟
Price projections across timeframes:
Short-Term (1-2 Weeks):
Range: 84,000 - 88,500
Likely to test support at 86,000-84,000 if selling persists; a bounce to 88,500 possible on relief rally.
Catalysts: U.S. economic data (e.g., CPI on March 12), ETF flows.
Medium-Term (1-3 Months):
Range: 80,000 - 92,000
Below 84,000 targets 80,000 (realized price support); above 88,500 aims for 92,000 if risk appetite returns.
Catalysts: BOJ policy update, institutional buying.
Long-Term (6-12 Months):
Bullish Target: 100,000 - 110,000
Driven by halving cycle, adoption, and inflation hedging—65% probability.
Bearish Target: 70,000 - 75,000
Triggered by global recession or regulatory crackdown—35% probability.
Catalysts: U.S. strategic reserve decision, Q3 GDP data.
Detailed Explanation: Short-term downside to 84,000 aligns with current bearish momentum. Medium-term consolidation reflects macro uncertainty, while long-term upside to 100,000+ hinges on fundamentals prevailing over temporary setbacks.
8. Overall Summary Outlook⭐⚡🌟
BTC/USD at 87,000 is in a short-term bearish correction within a broader bullish cycle. Fundamentals (adoption, halving) and on-chain HODLing support long-term gains, but macro headwinds (USD strength, global slowdown), COT unwinding, and risk-off sentiment drive the current downward trend. Exchange inflows and declining sentiment reinforce near-term weakness, with support at 84,000-80,000 likely to hold. Medium-term recovery to 92,000 and long-term growth to 100,000+ remain plausible if catalysts align.
📌Keep in mind that these factors can change rapidly, and it's essential to stay up-to-date with market developments and adjust your analysis accordingly.
⚠️Trading Alert : News Releases and Position Management 📰 🗞️ 🚫🚏
As a reminder, news releases can have a significant impact on market prices and volatility. To minimize potential losses and protect your running positions,
we recommend the following:
Avoid taking new trades during news releases
Use trailing stop-loss orders to protect your running positions and lock in profits
💖Supporting our robbery plan 💥Hit the Boost Button💥 will enable us to effortlessly make and steal money 💰💵. Boost the strength of our robbery team. Every day in this market make money with ease by using the Thief Trading Style.🏆💪🤝❤️🎉🚀
I'll see you soon with another heist plan, so stay tuned 🤑🐱👤🤗🤩
Dear Money Makers & Robbers, 🤑💰✈️
Based on 🔥Thief Trading style technical and fundamental analysis🔥, here is our master plan to heist the BTC/USDT "Bitcoin vs Tether" Crypto market. Please adhere to the strategy I've outlined in the chart, which emphasizes long entry and short entry. 🏆💸Be wealthy and safe trade.💪🏆🎉
Entry 📈 :
"The loot's within reach! Wait for the breakout, then grab your share - whether you're a Bullish thief or a Bearish bandit!"
🏁Buy entry above 93000
🏁Sell Entry below 84000
📌However, I recommended to place buy stop for bullish side and sell stop for bearish side.
Stop Loss 🛑:
🚩Thief SL placed at 88000 (swing Trade Basis) for Bullish Trade
🚩Thief SL placed at 92000 (swing Trade Basis) for Bearish Trade
Using the 4H period, the recent / swing low or high level.
SL is based on your risk of the trade, lot size and how many multiple orders you have to take.
Target 🎯:
🏴☠️Bullish Robbers TP 11000 (or) Escape Before the Target
🏴☠️Bearish Robbers TP 68000 (or) Escape Before the Target
📰🗞️Fundamental, Macro, COT Report, On Chain Analysis, Sentimental Outlook, Intermarket Analysis, Future Prediction:
BTC/USDT "Bitcoin vs Tether" Crypto market is currently experiencing a Neutral Trend (slightly Bearish🐼),., driven by several key factors.
1. Fundamental Analysis⭐⚡🌟
Fundamental analysis evaluates Bitcoin’s intrinsic drivers:
Adoption Trends:
Institutional inflows via Bitcoin ETFs remain strong, with $1.5 billion added in Q1 2025. MicroStrategy holds 300,000 BTC, reinforcing corporate adoption—bullish.
Regulatory Environment:
The U.S. signals a pro-crypto stance with talks of a strategic Bitcoin reserve, boosting confidence—bullish. However, global regulatory uncertainty (e.g., EU tax proposals) adds mild bearish pressure.
Halving Impact:
Post-2024 halving (April), supply issuance dropped to 450 BTC/day. Historical patterns suggest price appreciation 12-18 months later, supporting a bullish outlook for 2025.
Network Usage:
Transaction volume is up 10% year-over-year, driven by Layer 2 solutions (e.g., Lightning Network)—bullish for utility and value.
Inflation Hedge Narrative:
With U.S. inflation at 3.0%, Bitcoin’s appeal as a store of value grows—bullish, though tempered by short-term risk-off sentiment.
Detailed Explanation: Fundamentals are strongly bullish long-term due to adoption, supply scarcity, and macro trends. Short-term bearish pressures from regulatory uncertainty and profit-taking explain the current dip to 87,000.
2. Macroeconomic Factors⭐⚡🌟
Macroeconomic conditions influencing BTC/USD:
U.S. Economy:
Fed rates at 3.0% with no immediate cuts signal tighter conditions—bearish short-term as capital favors yield-bearing assets.
Unemployment steady at 4.2% supports economic stability—neutral.
Global Growth:
China’s GDP growth slows to 4.2%, reducing demand for risk assets like Bitcoin—bearish.
Eurozone PMI at 47.8 indicates contraction, pressuring global markets—bearish.
Currency Markets:
USD strength (DXY at 106) weighs on BTC/USD, as a stronger dollar reduces Bitcoin’s appeal—bearish short-term.
Commodity Prices:
Oil at 668/BBL
and gold at $2,950 reflect a mixed risk environment—neutral for Bitcoin.
Geopolitical Risk:
Middle East tensions elevate safe-haven demand, but Bitcoin’s correlation with gold is weakening—neutral to mildly bearish.
Detailed Explanation: Macro factors tilt bearish short-term due to USD strength and global slowdown, countering Bitcoin’s long-term bullish fundamentals. This tension explains the current downward trend from higher levels.
3. Commitments of Traders (COT) Data⭐⚡🌟
COT data reflects futures positioning:
Speculative Traders:
Net long positions at 15,000 contracts, down from 25,000 at the 95,000 peak. Reduced bullishness suggests caution—bearish signal.
Commercial Hedgers:
Net short at 20,000 contracts, stable. Hedgers locking in gains indicate no panic—neutral.
Open Interest:
45,000 contracts, down 10% from February highs. Declining participation hints at fading momentum—bearish.
Detailed Explanation: COT data supports a bearish short-term view. Speculators unwinding longs and falling open interest align with the downward trend, though hedgers’ stability prevents a sharper collapse.
4. On-Chain Analysis⭐⚡🌟
On-chain metrics provide insights into Bitcoin’s network activity:
Exchange Balances:
2.6 million BTC on exchanges, up 5% in March. Rising supply suggests selling pressure—bearish.
Transaction Volume:
Daily volume at $10 billion, flat month-over-month. Lack of growth signals reduced buying interest—neutral to bearish.
HODLing Behavior:
70% of BTC unmoved for over a year (13.8 million coins). Strong holder conviction limits downside—bullish long-term.
Miner Activity:
Miners hold 1.8 million BTC, with minimal outflows. Stable miner behavior supports price floors—mildly bullish.
Realized Price Levels:
Realized cap indicates a cost basis of 78,000 for recent buyers, acting as support—bullish if held.
Detailed Explanation: On-chain data is mixed. Short-term bearish signals from exchange inflows contrast with long-term bullishness from HODLing and miner stability, suggesting a correction rather than a collapse.
5. Intermarket Analysis⭐⚡🌟
Correlations with other markets:
USD Strength:
DXY at 106 pressures BTC/USD inversely—bearish short-term.
S&P 500:
At 5,900, down 2% this week, reflecting risk-off sentiment. Bitcoin’s 0.6 correlation with equities adds downward pressure—bearish.
Gold:
At $2,950, gold rises as a safe haven, decoupling from Bitcoin—neutral to bearish.
Bond Yields:
U.S. 10-year yields at 3.8% attract capital away from risk assets—bearish.
Altcoins:
ETH/BTC ratio at 0.035, with altcoins underperforming Bitcoin, reinforcing BTC’s relative strength—mildly bullish.
Detailed Explanation: Intermarket signals are bearish short-term due to USD strength, equity declines, and yield competition. Bitcoin’s resilience versus altcoins offers some support, but broader risk-off trends dominate.
6. Market Sentiment Analysis⭐⚡🌟
Investor and trader mood:
Retail Sentiment:
Social media analysis shows 45% bullish sentiment, down from 60% at 95,000. Fear of further drops prevails—bearish.
Analyst Views:
Consensus targets range from 80,000 (short-term support) to 100,000 (Q3 2025), reflecting uncertainty—mixed.
Options Market:
Call/put ratio at 0.9, with balanced positioning. No strong directional bias—neutral.
Fear & Greed Index:
At 40 (neutral), down from 70 (greed) in February, indicating cooling enthusiasm—bearish shift.
Detailed Explanation: Sentiment has turned bearish short-term as retail investors react to the decline from 95,000. Analysts’ mixed views and neutral options activity suggest a wait-and-see approach, aligning with the current trend.
7. Next Trend Move and Future Trend Prediction⭐⚡🌟
Price projections across timeframes:
Short-Term (1-2 Weeks):
Range: 84,000 - 88,500
Likely to test support at 86,000-84,000 if selling persists; a bounce to 88,500 possible on relief rally.
Catalysts: U.S. economic data (e.g., CPI on March 12), ETF flows.
Medium-Term (1-3 Months):
Range: 80,000 - 92,000
Below 84,000 targets 80,000 (realized price support); above 88,500 aims for 92,000 if risk appetite returns.
Catalysts: BOJ policy update, institutional buying.
Long-Term (6-12 Months):
Bullish Target: 100,000 - 110,000
Driven by halving cycle, adoption, and inflation hedging—65% probability.
Bearish Target: 70,000 - 75,000
Triggered by global recession or regulatory crackdown—35% probability.
Catalysts: U.S. strategic reserve decision, Q3 GDP data.
Detailed Explanation: Short-term downside to 84,000 aligns with current bearish momentum. Medium-term consolidation reflects macro uncertainty, while long-term upside to 100,000+ hinges on fundamentals prevailing over temporary setbacks.
8. Overall Summary Outlook⭐⚡🌟
BTC/USD at 87,000 is in a short-term bearish correction within a broader bullish cycle. Fundamentals (adoption, halving) and on-chain HODLing support long-term gains, but macro headwinds (USD strength, global slowdown), COT unwinding, and risk-off sentiment drive the current downward trend. Exchange inflows and declining sentiment reinforce near-term weakness, with support at 84,000-80,000 likely to hold. Medium-term recovery to 92,000 and long-term growth to 100,000+ remain plausible if catalysts align.
📌Keep in mind that these factors can change rapidly, and it's essential to stay up-to-date with market developments and adjust your analysis accordingly.
⚠️Trading Alert : News Releases and Position Management 📰 🗞️ 🚫🚏
As a reminder, news releases can have a significant impact on market prices and volatility. To minimize potential losses and protect your running positions,
we recommend the following:
Avoid taking new trades during news releases
Use trailing stop-loss orders to protect your running positions and lock in profits
💖Supporting our robbery plan 💥Hit the Boost Button💥 will enable us to effortlessly make and steal money 💰💵. Boost the strength of our robbery team. Every day in this market make money with ease by using the Thief Trading Style.🏆💪🤝❤️🎉🚀
I'll see you soon with another heist plan, so stay tuned 🤑🐱👤🤗🤩
Dagangan aktif
Dagangan ditutup: sasaran tercapai
"Mark reached 50%, slipped the net—raid’s done, prize stolen!" 🎯 Join the crew getting early signals & Swing market game plans:
🔍 Our signals come loaded with:
→ Pre-news market moves
→ Macro & sentiment scans
🔑 Perfect for traders who want to rob the market clean
🤑 Discord VIP: discord.gg/ZQS3y7FhVr
🔍 Our signals come loaded with:
→ Pre-news market moves
→ Macro & sentiment scans
🔑 Perfect for traders who want to rob the market clean
🤑 Discord VIP: discord.gg/ZQS3y7FhVr
Penerbitan berkaitan
Penafian
Maklumat dan penerbitan adalah tidak dimaksudkan untuk menjadi, dan tidak membentuk, nasihat untuk kewangan, pelaburan, perdagangan dan jenis-jenis lain atau cadangan yang dibekalkan atau disahkan oleh TradingView. Baca dengan lebih lanjut di Terma Penggunaan.
🎯 Join the crew getting early signals & Swing market game plans:
🔍 Our signals come loaded with:
→ Pre-news market moves
→ Macro & sentiment scans
🔑 Perfect for traders who want to rob the market clean
🤑 Discord VIP: discord.gg/ZQS3y7FhVr
🔍 Our signals come loaded with:
→ Pre-news market moves
→ Macro & sentiment scans
🔑 Perfect for traders who want to rob the market clean
🤑 Discord VIP: discord.gg/ZQS3y7FhVr
Penerbitan berkaitan
Penafian
Maklumat dan penerbitan adalah tidak dimaksudkan untuk menjadi, dan tidak membentuk, nasihat untuk kewangan, pelaburan, perdagangan dan jenis-jenis lain atau cadangan yang dibekalkan atau disahkan oleh TradingView. Baca dengan lebih lanjut di Terma Penggunaan.