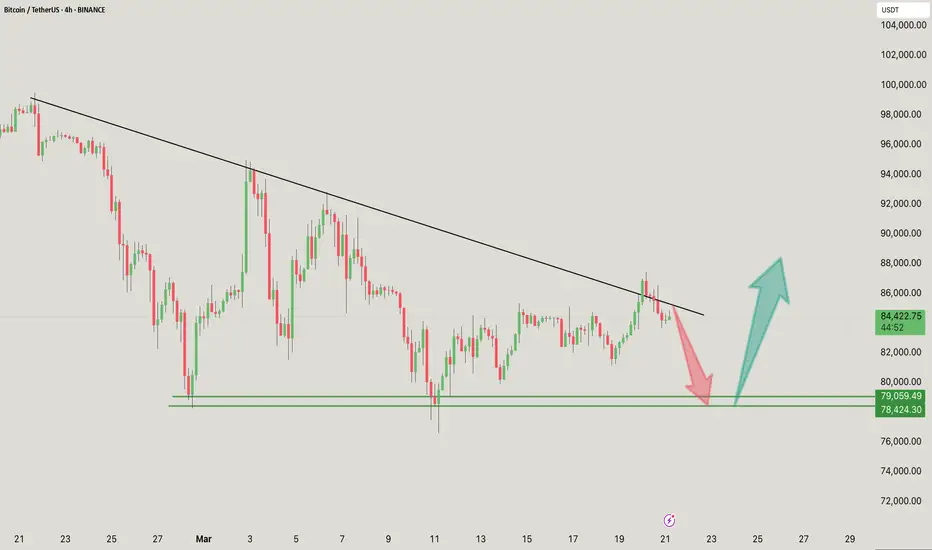
The Bitcoin (BTC/USDT) 4-hour chart suggests a key decision point near descending trendline resistance.
BTC is testing a key descending trendline, which has acted as resistance multiple times.
Rejection from this level could lead to a retracement towards the $79,000 – $78,400 support area (red arrow).
If BTC breaks above the trendline with strong volume, it could signal a bullish continuation towards $88,000+ (green arrow).
Immediate Resistance: $85,000
Key Support Area: $79,000 – $78,400
Breakout Target: $88,000+
If you found this analysis helpful, hit the Like button and share your thoughts or questions in the comments below. Your feedback matters!
Thanks for your support!
DYOR. NFA
Penerbitan berkaitan
Penafian
Maklumat dan penerbitan adalah tidak dimaksudkan untuk menjadi, dan tidak membentuk, nasihat untuk kewangan, pelaburan, perdagangan dan jenis-jenis lain atau cadangan yang dibekalkan atau disahkan oleh TradingView. Baca dengan lebih lanjut di Terma Penggunaan.
Penerbitan berkaitan
Penafian
Maklumat dan penerbitan adalah tidak dimaksudkan untuk menjadi, dan tidak membentuk, nasihat untuk kewangan, pelaburan, perdagangan dan jenis-jenis lain atau cadangan yang dibekalkan atau disahkan oleh TradingView. Baca dengan lebih lanjut di Terma Penggunaan.